
Call or Text 727-513-9780
  • Shopping Cart Shopping Cart
    0Shopping Cart
Pure Tested Peptides | America's most trusted Peptides for sale online
  • Peptides for sale
    • Oral Peptides for sale
      • Peptide Capsules for sale
      • BPC 157 Capsules 1000mcg
      • SLU-PP-332 Capsules | 1000 mcg
      • 5-Amino-1MQ 50mg Capsules
      • Tesofensine 500mcg
    • All Peptides for sale
    • Peptide Sprays
      • BPC 157 Nasal Spray Kit
      • BPC-157 TB500 Nasal Spray Kit
      • Semax Nasal Spray 10mg
      • Selank – Nasal Spray Kit – 10mg
      • Epithalon 50MG Nasal Spray Kit
      • Ipamorelin 10mg Nasal Spray
      • Klow Nasal Spray (BPC-157 + TB-500 + GHK-Cu + KPV) | 80mg
      • Hulk Nasal Spray Tesa / Ipa Blend 6/3 MG
      • Klow Nasal Spray
      • NAD + 500 mg Nasal Spray
      • PT-141 Nasal Spray Kit
    • GHRH Peptides
      • Ipa Peptides
      • CJC-1295 Peptides
        • CJC-1295 with DAC 5 mg
        • CJC-1295 without DAC 5 mg
        • CJC-1295 Ipa 10mg
      • Tesa Peptides
        • Tesa Peptide
        • Tesa 20 mg
    • GHK-Cu Peptides
      • All GHK-Cu Peptides
      • GHK-Cu 100mg
      • KLOW Peptide Blend – Buy KLOW blend online
    • BPC Peptides
      • All BPC Peptides
      • BPC-157
      • BPC-157 TB-500
      • BPC 157 capsules 1000mcg
    • SLU-PP-332 Peptides
      • All SLU-PP-332 Peptides
      • SLU-PP-332 5mg
    • GLP3 Peptides
      • GLP3-R
      • GLP3-R CAG 10mg
      • GLP3-R 20mg
    • PT-141 Peptides
      • PT-141 Peptides for sale
      • PT-141 10mg
      • PT-141 Nasal Spray
    • CAG Peptides
      • Lipo-C Peptide Blend
      • CAG 5mg
      • CAG 10mg
    • MOTS-C Peptides
      • MOTS-C Peptides for sale
      • MOTS-c peptide
      • MOTS-c 10mg *6 pack*
    • 5 Amino 1MQ Peptides
      • 5 Amino 1MQ Peptides for sale
      • 5-Amino-1MQ 50mg Capsules
      • 5-Amino-1MQ 5mg
    • Epithalon Peptides
      • Epithalon Peptides for sale
      • Epithalon 10mg
      • Epithalon 50mg
  • Shop
    • GLPs
      • 5-Amino-1MQ 50mg Capsules
      • 5-Amino-1MQ 5mg
      • GLP3-Reta
      • L-Carnitine 500mg/ml
      • Tesofensine 500mcg
      • SLU-PP-332 5mg
      • MOTS-c 10mg *6 pack*
    • Epithalon & BPC Peptides
      • Epithalon 10mg
      • Epithalon 50mg
      • BPC-157
      • BPC 157 capsules 1000mcg
      • BPC-157 TB-500
      • BPC-157 TB500 Nasal Spray Kit
      • BPC 157 Nasal Spray Kit
    • BPC TB-500 & NAD+ Peptides
      • NAD+ 500 mg
      • KLOW Peptide Blend – Buy KLOW blend online
      • GLOW Peptide Blend
      • TB 500 5mg
      • BPC 157 capsules 1000mcg – Supplement
      • BPC 157 Nasal Spray Kit
      • BPC-157
      • BPC-157 TB500 Nasal Spray Kit
      • BPC-157 TB-500
      • BPC 157 capsules 1000mcg
    • LL-37 Peptide
      • LL-37 10 mg
    • MOTS-C & Selank
      • MOTS-c peptide
      • Selank 10mg
    • GHK Peptides
      • GHK-Cu 100mg
      • GLOW Peptide Blend
      • KLOW Peptide Blend – Buy KLOW blend online
  • COAs
  • Wholesale
    • Wholesale Peptides for sale
  • PTP FAQ
  • Affiliates
    • Affiliate Program
    • Affiliate Signup
  • Contact
    • Contact Customer Service
    • Text Customer Support
  • About US
  • Shop all peptides
  • Login / Register Login / Register Page Link Login / Register Page Link
  • Click to open the search input field Click to open the search input field Search
  • Menu Menu

Tag Archive for: retatrutide phase 2

Retatrutide Phase 2 Data Review: What the Weight-Loss, Liver, and Glycemic Findings Mean for Researchers

Retatrutide Phase 2 Data Review: What the Weight-Loss, Liver, and Glycemic Findings Mean for Researchers

July 10, 2026/0 Comments/in Uncategorized/by

{"cover":"Professional landscape format (1536×1024) hero image with bold text overlay: 'Retatrutide Phase 2 Data Review: Weight-Loss, Liver & Glycemic Findings' in extra large 70pt white bold sans-serif font with dark semi-transparent overlay box, centered upper-third composition. Background shows a high-resolution clinical research laboratory scene with molecular structure visualizations, glowing blue data charts on screens, and a researcher reviewing trial data on a tablet. Color palette: deep navy blue, crisp white, teal accents. Magazine cover aesthetic, editorial quality, high contrast, photorealistic.","content":["Landscape format (1536×1024) detailed scientific infographic illustration showing a triple-receptor agonist mechanism diagram for GLP-1, GIP, and glucagon pathways. Three interconnected glowing nodes labeled with receptor names, arrows showing downstream metabolic effects on adipose tissue and liver cells. Clean white background with teal and navy color scheme, molecular pathway lines, annotated with percentage weight-loss data points. Research-grade visual, editorial quality, no people, data-driven aesthetic.","Landscape format (1536×1024) close-up medical imaging scene showing a cross-sectional liver MRI scan displayed on a lightbox monitor in a clinical setting, with a researcher's gloved hand pointing to highlighted liver fat reduction zones. Side panel bar graph showing 82.4% liver fat reduction data at 24 weeks with color-coded bars in teal and orange. Dramatic clinical lighting, sharp focus on the scan, blurred lab background, editorial photorealistic quality.","Landscape format (1536×1024) overhead flat-lay composition of a research desk with HbA1c glucose monitoring data printouts, a blood glucose meter, clinical trial result charts showing 2.0% HbA1c reduction annotations, and a researcher's notebook with handwritten analysis notes. Warm neutral tones with teal data highlights, clean organized layout, no faces visible, top-down angle, editorial quality, professional research context."]

Cover Image

An 82.4% reduction in liver fat content at 24 weeks is not a number that appears often in metabolic research. Yet that is precisely what Phase 2 data for retatrutide produced — and it is only one of several findings that have made this compound one of the most closely watched agents in obesity and metabolic liver disease science as of 2026.

This article packages the major published outcomes into a practical summary for researchers tracking developments across obesity pharmacology, MASLD, and glycemic control.

Key Takeaways

  • Retatrutide is a first-in-class triple agonist targeting GLP-1, GIP, and glucagon receptors simultaneously.
  • Phase 3 data showed approximately 28% average body weight reduction over 18 months — comparable to bariatric surgery outcomes.
  • Phase 2a liver data recorded an 82.4% reduction in liver fat content at the highest dose after 24 weeks.
  • HbA1c reductions of up to 2.0% were observed in people with type 2 diabetes over 24 to 36 weeks.
  • The gastrointestinal side-effect profile was consistent with other incretin-based therapies and generally mild to moderate.

Retatrutide triple-receptor mechanism diagram with metabolic pathway data


Understanding the Mechanism Behind the Retatrutide Phase 2 Data Review

Retatrutide's design sets it apart from earlier incretin therapies. Where agents like semaglutide target only GLP-1 receptors, retatrutide simultaneously activates three distinct pathways: GLP-1, GIP, and glucagon receptors. This triple-agonist architecture is the foundation for its amplified metabolic effects.

  • GLP-1 receptor activation suppresses appetite, slows gastric emptying, and improves insulin secretion.
  • GIP receptor activation enhances insulin sensitivity and may reduce GLP-1-related nausea.
  • Glucagon receptor activation increases energy expenditure and drives hepatic fat mobilization.

The combination produces a synergistic effect that neither dual nor single agonists can fully replicate. Researchers exploring the broader GLP-1 generations overview will recognize this as a meaningful step forward in receptor pharmacology.

For context on how growth-hormone-related peptides have historically approached body composition, the research on tesa and body composition offers a useful comparison point — particularly regarding visceral fat as a target tissue.


Weight-Loss Findings: What the Phase 2 and Phase 3 Numbers Show

The weight-loss data across retatrutide trials is the headline story. In Phase 3 results announced in May 2026, participants achieved an average body weight reduction of approximately 28% over 18 months. That figure places pharmacological treatment within the range historically associated with bariatric surgery.

Phase 2 data, published in the New England Journal of Medicine, established the dose-response curve and confirmed that higher doses produced proportionally greater weight loss, with the 12 mg dose group achieving the most substantial reductions.

Trial Phase Duration Average Weight Loss
Phase 2 (highest dose) 48 weeks ~24%
Phase 3 18 months ~28%
Bariatric surgery (historical) 12-18 months 25-35%

Key implication for researchers: The convergence of pharmacological and surgical outcomes signals that the ceiling for drug-based obesity treatment has not yet been reached. This matters for study design, endpoint selection, and comparator choice in future trials.


Liver and Glycemic Findings: A Closer Look at the Retatrutide Phase 2 Data Review

Clinical liver MRI scan showing retatrutide liver fat reduction data

Liver Fat Reduction in MASLD Research

The hepatic data from the Phase 2a trial is particularly relevant for researchers focused on metabolic dysfunction-associated steatotic liver disease (MASLD). At the highest dose, retatrutide produced an 82.4% reduction in liver fat content at 24 weeks, as measured by MRI-PDFF. Lower doses also produced statistically significant reductions, reinforcing the dose-response relationship.

This level of hepatic fat clearance is clinically meaningful. MASLD affects a large proportion of people with obesity and type 2 diabetes, and current pharmacological options remain limited. Retatrutide's glucagon receptor activity is thought to be the primary driver of hepatic fat mobilization — a mechanism distinct from GLP-1-only agents.

Researchers studying metabolic peptides such as SLU-PP-332 for metabolic research will find the hepatic fat data particularly relevant, as both pathways intersect at mitochondrial and lipid metabolism.

Glycemic Control in Type 2 Diabetes

HbA1c reduction data charts from retatrutide glycemic control research

In participants with type 2 diabetes, retatrutide produced HbA1c reductions of up to 2.0% over 24 to 36 weeks. That magnitude of glycemic improvement is clinically significant and comparable to the most effective approved agents in the class.

Fasting glucose reductions were also observed across dose groups, with higher doses producing greater improvements. The combined weight-loss and glycemic effects make retatrutide particularly relevant for researchers studying cardiometabolic risk reduction.

For comparison, the tesa dosage research for fat loss context illustrates how dose optimization remains central to metabolic peptide research — a principle that applies equally here.


Safety Profile and Research Considerations

The adverse event profile observed in Phase 2 trials was consistent with other incretin-based therapies. Gastrointestinal events — nausea, vomiting, diarrhea — were the most commonly reported and were generally mild to moderate in severity. Discontinuation rates due to adverse events were low.

Researchers should note:

  • Dose titration protocols appear to reduce GI event frequency.
  • No new safety signals were identified beyond those expected for the class.
  • Cardiovascular and renal endpoints remain under evaluation in ongoing trials.

Those tracking broader longevity peptide research themes will recognize that metabolic improvement at this scale — reduced visceral fat, improved insulin sensitivity, lower liver fat — carries implications well beyond weight management alone.

Eli Lilly has indicated plans to seek FDA approval pending the successful completion of ongoing late-stage trials, with a potential submission timeline by end of 2026.


Conclusion

The retatrutide Phase 2 data review presents a compelling case for why this compound is reshaping discussions across obesity pharmacology, MASLD research, and type 2 diabetes management. Three findings stand out: surgery-comparable weight loss, an 82.4% reduction in liver fat at 24 weeks, and HbA1c reductions of up to 2.0% in diabetic populations.

Actionable next steps for researchers:

  • Review the full Phase 2 NEJM publication for dose-response methodology and endpoint definitions.
  • Evaluate retatrutide's hepatic fat data against current MASLD trial benchmarks.
  • Monitor Phase 3 cardiovascular and renal outcome data as it becomes available.
  • Consider how triple-receptor agonism compares to GLP-1/GIP dual agonists in your specific research context.
  • Track FDA submission timelines, which may affect research access and regulatory landscape planning.

For researchers building a broader understanding of metabolic peptide science, the GLP-1 generations overview and SLU-PP-332 metabolic research resources provide useful adjacent context as the field continues to evolve rapidly in 2026.

https://www.puretestedpeptides.com/wp-content/uploads/2026/07/Retatrutide-Phase-2-Data-Review-What-the-Weight-Loss-Liver-and-Glycemic-Findings-Mean-for-Researchers-1.png 1024 1536 https://www.puretestedpeptides.com/wp-content/uploads/2026/01/buy-peptides-online.jpg 2026-07-10 13:17:132026-07-10 13:17:13Retatrutide Phase 2 Data Review: What the Weight-Loss, Liver, and Glycemic Findings Mean for Researchers
Retatrutide Phase 2 Data Review: What the Weight-Loss, Liver, and Glycemic Findings Mean for Researchers

Retatrutide Phase 2 Data Review: What the Weight-Loss, Liver, and Glycemic Findings Mean for Researchers

July 10, 2026/0 Comments/in Uncategorized/by

{"cover":"Professional landscape format (1536×1024) hero image with bold text overlay: 'Retatrutide Phase 2 Data Review: Weight-Loss, Liver & Glycemic Findings' in extra large 70pt white bold sans-serif font with dark semi-transparent overlay box, centered upper-third composition. Background shows a high-resolution clinical research laboratory scene with molecular structure visualizations, glowing blue data charts on screens, and a researcher reviewing trial data on a tablet. Color palette: deep navy blue, crisp white, teal accents. Magazine cover aesthetic, editorial quality, high contrast, photorealistic.","content":["Landscape format (1536×1024) detailed scientific infographic illustration showing a triple-receptor agonist mechanism diagram for GLP-1, GIP, and glucagon pathways. Three interconnected glowing nodes labeled with receptor names, arrows showing downstream metabolic effects on adipose tissue and liver cells. Clean white background with teal and navy color scheme, molecular pathway lines, annotated with percentage weight-loss data points. Research-grade visual, editorial quality, no people, data-driven aesthetic.","Landscape format (1536×1024) close-up medical imaging scene showing a cross-sectional liver MRI scan displayed on a lightbox monitor in a clinical setting, with a researcher's gloved hand pointing to highlighted liver fat reduction zones. Side panel bar graph showing 82.4% liver fat reduction data at 24 weeks with color-coded bars in teal and orange. Dramatic clinical lighting, sharp focus on the scan, blurred lab background, editorial photorealistic quality.","Landscape format (1536×1024) overhead flat-lay composition of a research desk with HbA1c glucose monitoring data printouts, a blood glucose meter, clinical trial result charts showing 2.0% HbA1c reduction annotations, and a researcher's notebook with handwritten analysis notes. Warm neutral tones with teal data highlights, clean organized layout, no faces visible, top-down angle, editorial quality, professional research context."]

Cover Image

An 82.4% reduction in liver fat content at 24 weeks is not a number that appears often in metabolic research. Yet that is precisely what Phase 2 data for retatrutide produced — and it is only one of several findings that have made this compound one of the most closely watched agents in obesity and metabolic liver disease science as of 2026.

This article packages the major published outcomes into a practical summary for researchers tracking developments across obesity pharmacology, MASLD, and glycemic control.

Key Takeaways

  • Retatrutide is a first-in-class triple agonist targeting GLP-1, GIP, and glucagon receptors simultaneously.
  • Phase 3 data showed approximately 28% average body weight reduction over 18 months — comparable to bariatric surgery outcomes.
  • Phase 2a liver data recorded an 82.4% reduction in liver fat content at the highest dose after 24 weeks.
  • HbA1c reductions of up to 2.0% were observed in people with type 2 diabetes over 24 to 36 weeks.
  • The gastrointestinal side-effect profile was consistent with other incretin-based therapies and generally mild to moderate.

Retatrutide triple-receptor mechanism diagram with metabolic pathway data


Understanding the Mechanism Behind the Retatrutide Phase 2 Data Review

Retatrutide's design sets it apart from earlier incretin therapies. Where agents like semaglutide target only GLP-1 receptors, retatrutide simultaneously activates three distinct pathways: GLP-1, GIP, and glucagon receptors. This triple-agonist architecture is the foundation for its amplified metabolic effects.

  • GLP-1 receptor activation suppresses appetite, slows gastric emptying, and improves insulin secretion.
  • GIP receptor activation enhances insulin sensitivity and may reduce GLP-1-related nausea.
  • Glucagon receptor activation increases energy expenditure and drives hepatic fat mobilization.

The combination produces a synergistic effect that neither dual nor single agonists can fully replicate. Researchers exploring the broader GLP-1 generations overview will recognize this as a meaningful step forward in receptor pharmacology.

For context on how growth-hormone-related peptides have historically approached body composition, the research on tesa and body composition offers a useful comparison point — particularly regarding visceral fat as a target tissue.


Weight-Loss Findings: What the Phase 2 and Phase 3 Numbers Show

The weight-loss data across retatrutide trials is the headline story. In Phase 3 results announced in May 2026, participants achieved an average body weight reduction of approximately 28% over 18 months. That figure places pharmacological treatment within the range historically associated with bariatric surgery.

Phase 2 data, published in the New England Journal of Medicine, established the dose-response curve and confirmed that higher doses produced proportionally greater weight loss, with the 12 mg dose group achieving the most substantial reductions.

Trial Phase Duration Average Weight Loss
Phase 2 (highest dose) 48 weeks ~24%
Phase 3 18 months ~28%
Bariatric surgery (historical) 12-18 months 25-35%

Key implication for researchers: The convergence of pharmacological and surgical outcomes signals that the ceiling for drug-based obesity treatment has not yet been reached. This matters for study design, endpoint selection, and comparator choice in future trials.


Liver and Glycemic Findings: A Closer Look at the Retatrutide Phase 2 Data Review

Clinical liver MRI scan showing retatrutide liver fat reduction data

Liver Fat Reduction in MASLD Research

The hepatic data from the Phase 2a trial is particularly relevant for researchers focused on metabolic dysfunction-associated steatotic liver disease (MASLD). At the highest dose, retatrutide produced an 82.4% reduction in liver fat content at 24 weeks, as measured by MRI-PDFF. Lower doses also produced statistically significant reductions, reinforcing the dose-response relationship.

This level of hepatic fat clearance is clinically meaningful. MASLD affects a large proportion of people with obesity and type 2 diabetes, and current pharmacological options remain limited. Retatrutide's glucagon receptor activity is thought to be the primary driver of hepatic fat mobilization — a mechanism distinct from GLP-1-only agents.

Researchers studying metabolic peptides such as SLU-PP-332 for metabolic research will find the hepatic fat data particularly relevant, as both pathways intersect at mitochondrial and lipid metabolism.

Glycemic Control in Type 2 Diabetes

HbA1c reduction data charts from retatrutide glycemic control research

In participants with type 2 diabetes, retatrutide produced HbA1c reductions of up to 2.0% over 24 to 36 weeks. That magnitude of glycemic improvement is clinically significant and comparable to the most effective approved agents in the class.

Fasting glucose reductions were also observed across dose groups, with higher doses producing greater improvements. The combined weight-loss and glycemic effects make retatrutide particularly relevant for researchers studying cardiometabolic risk reduction.

For comparison, the tesa dosage research for fat loss context illustrates how dose optimization remains central to metabolic peptide research — a principle that applies equally here.


Safety Profile and Research Considerations

The adverse event profile observed in Phase 2 trials was consistent with other incretin-based therapies. Gastrointestinal events — nausea, vomiting, diarrhea — were the most commonly reported and were generally mild to moderate in severity. Discontinuation rates due to adverse events were low.

Researchers should note:

  • Dose titration protocols appear to reduce GI event frequency.
  • No new safety signals were identified beyond those expected for the class.
  • Cardiovascular and renal endpoints remain under evaluation in ongoing trials.

Those tracking broader longevity peptide research themes will recognize that metabolic improvement at this scale — reduced visceral fat, improved insulin sensitivity, lower liver fat — carries implications well beyond weight management alone.

Eli Lilly has indicated plans to seek FDA approval pending the successful completion of ongoing late-stage trials, with a potential submission timeline by end of 2026.


Conclusion

The retatrutide Phase 2 data review presents a compelling case for why this compound is reshaping discussions across obesity pharmacology, MASLD research, and type 2 diabetes management. Three findings stand out: surgery-comparable weight loss, an 82.4% reduction in liver fat at 24 weeks, and HbA1c reductions of up to 2.0% in diabetic populations.

Actionable next steps for researchers:

  • Review the full Phase 2 NEJM publication for dose-response methodology and endpoint definitions.
  • Evaluate retatrutide's hepatic fat data against current MASLD trial benchmarks.
  • Monitor Phase 3 cardiovascular and renal outcome data as it becomes available.
  • Consider how triple-receptor agonism compares to GLP-1/GIP dual agonists in your specific research context.
  • Track FDA submission timelines, which may affect research access and regulatory landscape planning.

For researchers building a broader understanding of metabolic peptide science, the GLP-1 generations overview and SLU-PP-332 metabolic research resources provide useful adjacent context as the field continues to evolve rapidly in 2026.

https://www.puretestedpeptides.com/wp-content/uploads/2026/07/Retatrutide-Phase-2-Data-Review-What-the-Weight-Loss-Liver-and-Glycemic-Findings-Mean-for-Researchers-2.png 1024 1536 https://www.puretestedpeptides.com/wp-content/uploads/2026/01/buy-peptides-online.jpg 2026-07-10 13:17:132026-07-10 13:17:13Retatrutide Phase 2 Data Review: What the Weight-Loss, Liver, and Glycemic Findings Mean for Researchers
Retatrutide Phase 2 Data Review: What the Weight-Loss, Liver, and Glycemic Findings Mean for Researchers

Retatrutide Phase 2 Data Review: What the Weight-Loss, Liver, and Glycemic Findings Mean for Researchers

July 10, 2026/0 Comments/in Uncategorized/by

{"cover":"Professional landscape format (1536×1024) hero image with bold text overlay: 'Retatrutide Phase 2 Data Review: Weight-Loss, Liver & Glycemic Findings' in extra large 70pt white bold sans-serif font with dark semi-transparent overlay box, centered upper-third composition. Background shows a high-resolution clinical research laboratory scene with molecular structure visualizations, glowing blue data charts on screens, and a researcher reviewing trial data on a tablet. Color palette: deep navy blue, crisp white, teal accents. Magazine cover aesthetic, editorial quality, high contrast, photorealistic.","content":["Landscape format (1536×1024) detailed scientific infographic illustration showing a triple-receptor agonist mechanism diagram for GLP-1, GIP, and glucagon pathways. Three interconnected glowing nodes labeled with receptor names, arrows showing downstream metabolic effects on adipose tissue and liver cells. Clean white background with teal and navy color scheme, molecular pathway lines, annotated with percentage weight-loss data points. Research-grade visual, editorial quality, no people, data-driven aesthetic.","Landscape format (1536×1024) close-up medical imaging scene showing a cross-sectional liver MRI scan displayed on a lightbox monitor in a clinical setting, with a researcher's gloved hand pointing to highlighted liver fat reduction zones. Side panel bar graph showing 82.4% liver fat reduction data at 24 weeks with color-coded bars in teal and orange. Dramatic clinical lighting, sharp focus on the scan, blurred lab background, editorial photorealistic quality.","Landscape format (1536×1024) overhead flat-lay composition of a research desk with HbA1c glucose monitoring data printouts, a blood glucose meter, clinical trial result charts showing 2.0% HbA1c reduction annotations, and a researcher's notebook with handwritten analysis notes. Warm neutral tones with teal data highlights, clean organized layout, no faces visible, top-down angle, editorial quality, professional research context."]

Cover Image

An 82.4% reduction in liver fat content at 24 weeks is not a number that appears often in metabolic research. Yet that is precisely what Phase 2 data for retatrutide produced — and it is only one of several findings that have made this compound one of the most closely watched agents in obesity and metabolic liver disease science as of 2026.

This article packages the major published outcomes into a practical summary for researchers tracking developments across obesity pharmacology, MASLD, and glycemic control.

Key Takeaways

  • Retatrutide is a first-in-class triple agonist targeting GLP-1, GIP, and glucagon receptors simultaneously.
  • Phase 3 data showed approximately 28% average body weight reduction over 18 months — comparable to bariatric surgery outcomes.
  • Phase 2a liver data recorded an 82.4% reduction in liver fat content at the highest dose after 24 weeks.
  • HbA1c reductions of up to 2.0% were observed in people with type 2 diabetes over 24 to 36 weeks.
  • The gastrointestinal side-effect profile was consistent with other incretin-based therapies and generally mild to moderate.

Retatrutide triple-receptor mechanism diagram with metabolic pathway data


Understanding the Mechanism Behind the Retatrutide Phase 2 Data Review

Retatrutide's design sets it apart from earlier incretin therapies. Where agents like semaglutide target only GLP-1 receptors, retatrutide simultaneously activates three distinct pathways: GLP-1, GIP, and glucagon receptors. This triple-agonist architecture is the foundation for its amplified metabolic effects.

  • GLP-1 receptor activation suppresses appetite, slows gastric emptying, and improves insulin secretion.
  • GIP receptor activation enhances insulin sensitivity and may reduce GLP-1-related nausea.
  • Glucagon receptor activation increases energy expenditure and drives hepatic fat mobilization.

The combination produces a synergistic effect that neither dual nor single agonists can fully replicate. Researchers exploring the broader GLP-1 generations overview will recognize this as a meaningful step forward in receptor pharmacology.

For context on how growth-hormone-related peptides have historically approached body composition, the research on tesa and body composition offers a useful comparison point — particularly regarding visceral fat as a target tissue.


Weight-Loss Findings: What the Phase 2 and Phase 3 Numbers Show

The weight-loss data across retatrutide trials is the headline story. In Phase 3 results announced in May 2026, participants achieved an average body weight reduction of approximately 28% over 18 months. That figure places pharmacological treatment within the range historically associated with bariatric surgery.

Phase 2 data, published in the New England Journal of Medicine, established the dose-response curve and confirmed that higher doses produced proportionally greater weight loss, with the 12 mg dose group achieving the most substantial reductions.

Trial Phase Duration Average Weight Loss
Phase 2 (highest dose) 48 weeks ~24%
Phase 3 18 months ~28%
Bariatric surgery (historical) 12-18 months 25-35%

Key implication for researchers: The convergence of pharmacological and surgical outcomes signals that the ceiling for drug-based obesity treatment has not yet been reached. This matters for study design, endpoint selection, and comparator choice in future trials.


Liver and Glycemic Findings: A Closer Look at the Retatrutide Phase 2 Data Review

Clinical liver MRI scan showing retatrutide liver fat reduction data

Liver Fat Reduction in MASLD Research

The hepatic data from the Phase 2a trial is particularly relevant for researchers focused on metabolic dysfunction-associated steatotic liver disease (MASLD). At the highest dose, retatrutide produced an 82.4% reduction in liver fat content at 24 weeks, as measured by MRI-PDFF. Lower doses also produced statistically significant reductions, reinforcing the dose-response relationship.

This level of hepatic fat clearance is clinically meaningful. MASLD affects a large proportion of people with obesity and type 2 diabetes, and current pharmacological options remain limited. Retatrutide's glucagon receptor activity is thought to be the primary driver of hepatic fat mobilization — a mechanism distinct from GLP-1-only agents.

Researchers studying metabolic peptides such as SLU-PP-332 for metabolic research will find the hepatic fat data particularly relevant, as both pathways intersect at mitochondrial and lipid metabolism.

Glycemic Control in Type 2 Diabetes

HbA1c reduction data charts from retatrutide glycemic control research

In participants with type 2 diabetes, retatrutide produced HbA1c reductions of up to 2.0% over 24 to 36 weeks. That magnitude of glycemic improvement is clinically significant and comparable to the most effective approved agents in the class.

Fasting glucose reductions were also observed across dose groups, with higher doses producing greater improvements. The combined weight-loss and glycemic effects make retatrutide particularly relevant for researchers studying cardiometabolic risk reduction.

For comparison, the tesa dosage research for fat loss context illustrates how dose optimization remains central to metabolic peptide research — a principle that applies equally here.


Safety Profile and Research Considerations

The adverse event profile observed in Phase 2 trials was consistent with other incretin-based therapies. Gastrointestinal events — nausea, vomiting, diarrhea — were the most commonly reported and were generally mild to moderate in severity. Discontinuation rates due to adverse events were low.

Researchers should note:

  • Dose titration protocols appear to reduce GI event frequency.
  • No new safety signals were identified beyond those expected for the class.
  • Cardiovascular and renal endpoints remain under evaluation in ongoing trials.

Those tracking broader longevity peptide research themes will recognize that metabolic improvement at this scale — reduced visceral fat, improved insulin sensitivity, lower liver fat — carries implications well beyond weight management alone.

Eli Lilly has indicated plans to seek FDA approval pending the successful completion of ongoing late-stage trials, with a potential submission timeline by end of 2026.


Conclusion

The retatrutide Phase 2 data review presents a compelling case for why this compound is reshaping discussions across obesity pharmacology, MASLD research, and type 2 diabetes management. Three findings stand out: surgery-comparable weight loss, an 82.4% reduction in liver fat at 24 weeks, and HbA1c reductions of up to 2.0% in diabetic populations.

Actionable next steps for researchers:

  • Review the full Phase 2 NEJM publication for dose-response methodology and endpoint definitions.
  • Evaluate retatrutide's hepatic fat data against current MASLD trial benchmarks.
  • Monitor Phase 3 cardiovascular and renal outcome data as it becomes available.
  • Consider how triple-receptor agonism compares to GLP-1/GIP dual agonists in your specific research context.
  • Track FDA submission timelines, which may affect research access and regulatory landscape planning.

For researchers building a broader understanding of metabolic peptide science, the GLP-1 generations overview and SLU-PP-332 metabolic research resources provide useful adjacent context as the field continues to evolve rapidly in 2026.

https://www.puretestedpeptides.com/wp-content/uploads/2026/07/Retatrutide-Phase-2-Data-Review-What-the-Weight-Loss-Liver-and-Glycemic-Findings-Mean-for-Researchers.png 1024 1536 https://www.puretestedpeptides.com/wp-content/uploads/2026/01/buy-peptides-online.jpg 2026-07-10 13:17:112026-07-10 13:17:11Retatrutide Phase 2 Data Review: What the Weight-Loss, Liver, and Glycemic Findings Mean for Researchers
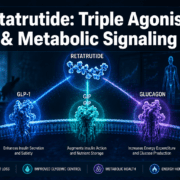
Retatrutide Mechanism of Action: How Triple Agonism Changes Metabolic Signaling in Research Models

Retatrutide Mechanism of Action: How Triple Agonism Changes Metabolic Signaling in Research Models

June 24, 2026/0 Comments/in Uncategorized/by

Activating three distinct metabolic receptors with a single molecule is not a theoretical concept — retatrutide does exactly that, and the downstream signaling consequences are reshaping how researchers think about obesity, glycemic control, and liver health. Understanding the Retatrutide Mechanism of Action: How Triple Agonism Changes Metabolic Signaling in Research Models is essential for anyone tracking the frontier of incretin-based research in 2026.

Key Takeaways

  • Retatrutide simultaneously activates GLP-1, GIP, and glucagon receptors, producing broader metabolic effects than single or dual agonists
  • Its highest receptor potency is at the GIP receptor (EC50 = 0.0643 nM), followed by GLP-1 and glucagon
  • Phase 2 data showed a 24.2% reduction in total body weight over 48 weeks at the 12-mg dose
  • Hepatic fat was reduced by 82.4% relative, with 86% of subjects achieving liver fat normalization
  • Triple agonism integrates appetite suppression, insulin secretion, and energy expenditure into one coordinated signal

How Triple Receptor Activation Defines the Retatrutide Mechanism of Action

GLP-1 GIP glucagon receptor binding molecular diagram

Retatrutide is a synthetic peptide engineered to bind three G-protein-coupled receptors: the glucagon-like peptide-1 (GLP-1) receptor, the glucose-dependent insulinotropic polypeptide (GIP) receptor, and the glucagon receptor (GCGR). Each receptor contributes a distinct layer of metabolic regulation.

Receptor Primary Metabolic Role EC50 (Potency)
GIP Insulin secretion, fat metabolism 0.0643 nM
GLP-1 Appetite suppression, insulin release 0.775 nM
Glucagon Energy expenditure, hepatic glucose output 5.79 nM

Retatrutide shows the strongest binding affinity at the GIP receptor, making GIP activity a dominant driver of its early metabolic effects. GLP-1 receptor activation adds appetite suppression and slows gastric emptying, which reduces caloric intake. Glucagon receptor co-activation increases thermogenesis and promotes hepatic fat oxidation — a mechanism largely absent from GLP-1-only therapies.

For context on how GIP receptor biology fits into the broader incretin landscape, the GIP receptor and its importance overview provides useful background on why this target matters.

This triple-pathway engagement is also explored in the GLP-3 triple agonist research overview, which compares receptor-targeting strategies across next-generation incretin compounds.


Metabolic Signaling Outcomes Observed in Research Models

Metabolic pathway downstream signaling liver fat weight loss data

The Retatrutide Mechanism of Action: How Triple Agonism Changes Metabolic Signaling in Research Models becomes most apparent when examining what happens downstream of receptor binding. Each activated receptor triggers intracellular cAMP elevation, which cascades into tissue-specific effects:

  • Pancreatic beta cells: Enhanced glucose-stimulated insulin secretion via GLP-1 and GIP pathways
  • Hypothalamus: Appetite-suppressing signals that reduce total caloric intake
  • Adipose tissue: Increased lipolysis and thermogenic activation via glucagon receptor
  • Liver: Reduced de novo lipogenesis and accelerated fatty acid oxidation

These coordinated signals produced striking outcomes in Phase 2 research. At the 12-mg weekly dose over 48 weeks, subjects achieved a mean 24.2% reduction in total body weight, with 63% reaching at least 20% weight loss. Glycemic improvements were equally notable — an absolute HbA1c reduction of 2.02%, with 27% of diabetic participants reaching normoglycemia (HbA1c below 5.7%).

Liver outcomes were particularly compelling. Retatrutide produced an 82.4% relative reduction in hepatic fat, normalizing liver fat levels in 86% of participants — a finding with direct implications for metabolic dysfunction-associated steatotic liver disease research.

Researchers studying complementary metabolic pathways may find value in reviewing MOTS-c and metabolic flexibility research, which examines mitochondrial-level energy regulation as a parallel axis of metabolic control.

For those tracking incretin-based approaches more broadly, the GLP-1 incretin research themes page contextualizes where retatrutide sits within the evolving GLP receptor pharmacology space.


Comparative Advantage and the Broader Research Context

Comparative bar chart triple agonist vs single dual agonist outcomes

The Retatrutide Mechanism of Action: How Triple Agonism Changes Metabolic Signaling in Research Models stands apart from earlier incretin therapies precisely because it does not rely on a single signaling axis. Single GLP-1 agonists suppress appetite effectively but offer limited thermogenic benefit. Dual GLP-1/GIP agonists add insulin sensitization but leave glucagon-driven energy expenditure largely untouched.

Retatrutide closes that gap. The glucagon receptor component raises resting energy expenditure without triggering hyperglycemia — a balance made possible because GLP-1 and GIP co-activation simultaneously stimulates insulin secretion to offset glucagon's glucose-raising effect.

"Triple agonism represents a significant advancement in addressing complex metabolic disorders," noted lead Phase 2 investigator Dr. Ania M. Jastreboff — a statement supported by the breadth of endpoints improved in the trial data.

The safety profile observed in research settings was consistent with other incretin-based therapies, with gastrointestinal adverse events being the most commonly reported and generally non-severe.

Researchers exploring adjacent peptide mechanisms may also find the cagrilintide and GLP-1 synergy research article relevant, as it examines how amylin-pathway co-targeting compares to incretin stacking strategies.

For those interested in the specific retatrutide compound used in research settings, the GLP-3 Retatrutide product page provides purity and specification details relevant to preclinical study design.

Additional context on the evolving peptide research landscape is available through the what is new in peptide research resource.


Conclusion

The Retatrutide Mechanism of Action: How Triple Agonism Changes Metabolic Signaling in Research Models represents a meaningful step forward in metabolic pharmacology. By engaging GLP-1, GIP, and glucagon receptors simultaneously, retatrutide produces coordinated effects on appetite, insulin secretion, thermogenesis, and hepatic fat that no single-axis therapy can replicate.

Actionable next steps for researchers:

  • Review Phase 2 endpoint data across weight, glycemic, and hepatic fat outcomes to identify which research models align with your study design
  • Compare retatrutide's receptor potency profile against dual agonists to define the incremental contribution of glucagon receptor activation
  • Assess preclinical model selection criteria based on the compound's dominant GIP receptor affinity
  • Explore complementary metabolic peptides such as MOTS-c or cagrilintide to understand synergistic or additive signaling possibilities

As triple agonism moves through later-stage research phases in 2026, its mechanistic profile offers a detailed map for designing studies that capture the full breadth of metabolic signaling it engages.

https://www.puretestedpeptides.com/wp-content/uploads/2026/06/Retatrutide-Mechanism-of-Action-How-Triple-Agonism-Changes-Metabolic-Signaling-in-Research-Models.png 1024 1536 https://www.puretestedpeptides.com/wp-content/uploads/2026/01/buy-peptides-online.jpg 2026-06-24 13:20:112026-06-24 13:20:11Retatrutide Mechanism of Action: How Triple Agonism Changes Metabolic Signaling in Research Models
×

Helpful Links

  • My account
  • Cart
  • Checkout
  • Refund and Returns Policy
  • Privacy Policy
  • SMS Privacy Policy
  • Login
  • My Account
  • Logout

USA Made Lab Tested Peptides

All products are sold for research, laboratory, or analytical purposes only, and are not for human consumption


Pure Tested Peptides is a chemical supplier. Pure Tested Peptides is not a compounding / chemical compounding facility as defined under 503A of the Federal Food, Drug, and Cosmetic act. Pure Tested Peptides is not an outsourcing facility as defined under 503B of the Federal Food, Drug, and Cosmetic act.

The statements made within this website have not been evaluated by the US Food and Drug Administration. The products we offer are not intended to diagnose, treat, cure or prevent any disease.

Human/Animal Consumption Prohibited. Laboratory/In-Vitro Experimental Use Only

Scroll to top Scroll to top Scroll to top