Call or Text 727-513-9780
  • Shopping Cart Shopping Cart
    0Shopping Cart
Pure Tested Peptides | America's most trusted Peptides for sale online
  • Peptides for sale
    • Oral Peptides for sale
      • Peptide Capsules for sale
      • BPC 157 Capsules 1000mcg
      • SLU-PP-332 Capsules | 1000 mcg
      • 5-Amino-1MQ 50mg Capsules
      • Tesofensine 500mcg
    • All Peptides for sale
    • Peptide Sprays
      • BPC 157 Nasal Spray Kit
      • BPC-157 TB500 Nasal Spray Kit
      • Semax Nasal Spray 10mg
      • Selank – Nasal Spray Kit – 10mg
      • Epithalon 50MG Nasal Spray Kit
      • Ipamorelin 10mg Nasal Spray
      • Klow Nasal Spray (BPC-157 + TB-500 + GHK-Cu + KPV) | 80mg
      • Hulk Nasal Spray Tesa / Ipa Blend 6/3 MG
      • Klow Nasal Spray
      • NAD + 500 mg Nasal Spray
      • PT-141 Nasal Spray Kit
    • GHRH Peptides
      • Ipa Peptides
      • CJC-1295 Peptides
        • CJC-1295 with DAC 5 mg
        • CJC-1295 without DAC 5 mg
        • CJC-1295 Ipa 10mg
      • Tesa Peptides
        • Tesa Peptide
        • Tesa 20 mg
    • GHK-Cu Peptides
      • All GHK-Cu Peptides
      • GHK-Cu 100mg
      • KLOW Peptide Blend – Buy KLOW blend online
    • BPC Peptides
      • All BPC Peptides
      • BPC-157
      • BPC-157 TB-500
      • BPC 157 capsules 1000mcg
    • SLU-PP-332 Peptides
      • All SLU-PP-332 Peptides
      • SLU-PP-332 5mg
    • GLP3 Peptides
    • PT-141 Peptides
      • PT-141 Peptides for sale
      • PT-141 10mg
      • PT-141 Nasal Spray
    • CAG Peptides
      • Lipo-C Peptide Blend
      • CAG 5mg
      • CAG 10mg
    • MOTS-C Peptides
      • MOTS-C Peptides for sale
      • MOTS-c peptide
      • MOTS-c 10mg *6 pack*
    • 5 Amino 1MQ Peptides
      • 5 Amino 1MQ Peptides for sale
      • 5-Amino-1MQ 50mg Capsules
      • 5-Amino-1MQ 5mg
    • Epithalon Peptides
      • Epithalon Peptides for sale
      • Epithalon 10mg
      • Epithalon 50mg
  • Shop
    • GLPs
      • 5-Amino-1MQ 50mg Capsules
      • 5-Amino-1MQ 5mg
      • L-Carnitine 500mg/ml
      • Tesofensine 500mcg
      • SLU-PP-332 5mg
      • MOTS-c 10mg *6 pack*
    • Epithalon & BPC Peptides
      • Epithalon 10mg
      • Epithalon 50mg
      • BPC-157
      • BPC 157 capsules 1000mcg
      • BPC-157 TB-500
      • BPC-157 TB500 Nasal Spray Kit
      • BPC 157 Nasal Spray Kit
    • BPC TB-500 & NAD+ Peptides
      • NAD+ 500 mg
      • KLOW Peptide Blend – Buy KLOW blend online
      • GLOW Peptide Blend
      • TB 500 5mg
      • BPC 157 capsules 1000mcg – Supplement
      • BPC 157 Nasal Spray Kit
      • BPC-157
      • BPC-157 TB500 Nasal Spray Kit
      • BPC-157 TB-500
      • BPC 157 capsules 1000mcg
    • LL-37 Peptide
      • LL-37 10 mg
    • MOTS-C & Selank
      • MOTS-c peptide
      • Selank 10mg
    • GHK Peptides
      • GHK-Cu 100mg
      • GLOW Peptide Blend
      • KLOW Peptide Blend – Buy KLOW blend online
  • COAs
  • Wholesale
    • Wholesale Peptides for sale
  • PTP FAQ
  • Affiliates
    • Selank Peptide: Advanced Pharmacological Mechanisms Underlying Its Anxiolytic and Nootropic Effects in Research
      • 5-Amino-1MQ Peptide: Detailed Mechanisms of NNMT Inhibition and Its Impact on Cellular Metabolism Research
        • MOTS-C Peptide: Unraveling Its Role in Mitochondrial Dynamics and Energy Metabolism Research
          • Epithalon Peptide and Telomerase Regulation: Investigating Its Impact on Cellular Senescence and Lifespan Research Models
            • GLP2-T vs GLP2 Tirz Peptide: Understanding the Naming, Mechanistic Nuances, and Research Implications for Gut Health
      • Peptides and Polypeptides in Modern Pharmacology: What Research on Metoprolol, Prednisone, and Amlodipine Reveals
        • Polypeptide Peptides vs NSAIDs: What Naproxen and Diclofenac Teach Tissue-Repair Researchers About BPC‑157 and TB‑500
          • Peptides and Polypeptides in Endocrine Pharmacology: How GLP-1, GLP-2, and GLP-3 Retatrutide Differ From Classic Drugs Like Prednisone and Amlodipine
          • 5‑Amino‑1MQ Peptide and NNMT Inhibition: How It Compares With Statins Like Atorvastatin in Adipose and Lipid Metabolism Research
      • Enclomiphene, Estrogen Receptor Signaling, and Luteinizing Phase Biology: What Hormone Researchers Should Measure
        • Mesenchymal Stem Cells, BPC‑157, and GHK‑Cu: How Tissue Repair Peptides Compare With Classic NSAIDs Like Naproxen in Injury Models
          • Peptide Calculator Use Cases Beyond Growth Hormone: Working Through GLP‑3 Retatrutide, MOTS‑c, and BPC‑157 Research Dosing
        • Polypeptide Peptides in Endocrine and Metabolic Pharmacology: Lessons From Amlodipine, Prednisone, and Metoprolol
        • Peptides Calculator for Advanced Blends: Worked Examples for Tesamorelin, CJC‑1295, and Ipamorelin Stacks
          • Peptides and Polypeptides in Human Physiology: How Molecular Size Shapes Research Applications
            • Selank Peptide: Advanced Pharmacological Mechanisms Underlying Its Anxiolytic and Nootropic Effects in Research
          • 5-Amino-1MQ Peptide: Detailed Mechanisms of NNMT Inhibition and Its Impact on Cellular Metabolism Research
            • MOTS-C Peptide: Unraveling Its Role in Mitochondrial Dynamics and Energy Metabolism Research
              • Epithalon Peptide and Telomerase Regulation: Investigating Its Impact on Cellular Senescence and Lifespan Research Models
                • GLP2-T vs GLP2 Tirz Peptide: Understanding the Naming, Mechanistic Nuances, and Research Implications for Gut Health
                  • Peptides and Polypeptides in Endocrine Pharmacology: How GLP-1, GLP-2, and GLP-3 Retatrutide Differ From Classic Drugs Like Prednisone and Amlodipine
                    • Polypeptide Peptides vs NSAIDs: What Naproxen and Diclofenac Teach Tissue-Repair Researchers About BPC‑157 and TB‑500
                      • Peptides and Polypeptides in Modern Pharmacology: What Research on Metoprolol, Prednisone, and Amlodipine Reveals
                        • 5‑Amino‑1MQ Peptide and NNMT Inhibition: How It Compares With Statins Like Atorvastatin in Adipose and Lipid Metabolism Research
                        • Enclomiphene, Estrogen Receptor Signaling, and Luteinizing Phase Biology: What Hormone Researchers Should Measure
                        • Mesenchymal Stem Cells, BPC‑157, and GHK‑Cu: How Tissue Repair Peptides Compare With Classic NSAIDs Like Naproxen in Injury Models
                        • Peptide Calculator Use Cases Beyond Growth Hormone: Working Through GLP‑3 Retatrutide, MOTS‑c, and BPC‑157 Research Dosing
                        • Polypeptide Peptides in Endocrine and Metabolic Pharmacology: Lessons From Amlodipine, Prednisone, and Metoprolol
                        • Peptides Calculator for Advanced Blends: Worked Examples for Tesamorelin, CJC‑1295, and Ipamorelin Stacks
                        • Peptides and Polypeptides in Human Physiology: How Molecular Size Shapes Research Applications
                        • Selank Peptide: Advanced Pharmacological Mechanisms Underlying Its Anxiolytic and Nootropic Effects in Research
                        • MOTS-C Peptide: Unraveling Its Role in Mitochondrial Dynamics and Energy Metabolism Research
                        • Peptides and Polypeptides in Modern Pharmacology: What Research on Metoprolol, Prednisone, and Amlodipine Reveals
                        • Peptides and Polypeptides in Endocrine Pharmacology: How GLP-1, GLP-2, and GLP-3 Retatrutide Differ From Classic Drugs Like Prednisone and Amlodipine
                        • 5-Amino-1MQ Peptide: Detailed Mechanisms of NNMT Inhibition and Its Impact on Cellular Metabolism Research
                        • Mesenchymal Stem Cells, BPC‑157, and GHK‑Cu: How Tissue Repair Peptides Compare With Classic NSAIDs Like Naproxen in Injury Models
                        • Peptide Calculator Use Cases Beyond Growth Hormone: Working Through GLP‑3 Retatrutide, MOTS‑c, and BPC‑157 Research Dosing
                        • GLP2-T vs GLP2 Tirz Peptide: Understanding the Naming, Mechanistic Nuances, and Research Implications for Gut Health
                        • Polypeptide Peptides in Endocrine and Metabolic Pharmacology: Lessons From Amlodipine, Prednisone, and Metoprolol
                        • Polypeptide Peptides vs NSAIDs: What Naproxen and Diclofenac Teach Tissue-Repair Researchers About BPC‑157 and TB‑500
                        • Peptides and Polypeptides in Human Physiology: How Molecular Size Shapes Research Applications
                        • Peptides Calculator for Advanced Blends: Worked Examples for Tesamorelin, CJC‑1295, and Ipamorelin Stacks
                        • 5‑Amino‑1MQ Peptide and NNMT Inhibition: How It Compares With Statins Like Atorvastatin in Adipose and Lipid Metabolism Research
                        • Enclomiphene, Estrogen Receptor Signaling, and Luteinizing Phase Biology: What Hormone Researchers Should Measure
                        • Epithalon Peptide and Telomerase Regulation: Investigating Its Impact on Cellular Senescence and Lifespan Research Models
                        • Best research protocol Klow blend
                        • best time to take BPC-157
                        • best time to take DSIP (Delta Sleep Inducing Peptide)
                        • best time to take CJC-1295
                        • best time to take AOD-9604
                        • best time to take Follistatin 344
                        • best time to take Ipamorelin
                        • best time to take MK-677 (Ibutamoren)
                        • best time to take Ligandrol (LGD-4033) — research compound
                        • best time to take Ostarine (MK-2866) — research compound
                        • best time to take GHK-CU
                        • best time to take TB-500
                        • best time to take MOTS-c
                        • best time to take Semax
                        • best time to take RAD-140 (Testolone) — research compound
                        • best time to take Thymosin Alpha-1
                        • best time to take PEG-MGF
                        • Biolife Plasma, Octapharma Plasma, and Research Peptides: How Plasma Donation Labs Differ From Peptide Suppliers
                        • best time to take YK-11 — research compound
                        • best time to take PT-141 (Bremelanotide)
                        • Best research protocol Klow blend
                        • 5-Amino-1MQ and MOTS-C Synergy: Metabolic Signaling, Mitochondria, and Research Design
                        • BPC-157 and TB-500: Investigating Their Combined Effects on Angiogenesis and Cellular Migration in Tissue Repair Models
                        • BPC-157 Peptide: Gut Barrier Function, Inflammation, and Tissue-Recovery Research
                        • 5‑Amino‑1MQ and MOTS‑c Synergy in Metabolic Research: Designing NNMT and Mitochondrial Biogenesis Stacks
                        • CJC-1295 with DAC vs. Without DAC: Half-Life, Release Kinetics, and Research Implications
                        • CJC‑1295 with DAC vs. Without DAC: Expanding on Half‑Life Differences Using Tesamorelin and Ipamorelin Blend Case Studies
                        • Collagen Biology and Copper‑Binding Peptides: How GHK‑Cu, Glow Blend, and Klow Blend Interact with Skin and Connective Tissue
                        • Collagen Biology and Regenerative Peptides: How GHK‑Cu, Glow Blend, and Klow Blend Affect Extracellular Matrix Research
                    • DNA, Telomeres, and Longevity Peptides: Positioning Epithalon and MOTS‑c in Genetic Aging Research
                      • Enclomiphene Citrate: serm Mechanism, Testosterone Research, and Stack Compatibility
                        • Enclomiphene vs Enclomiphene Citrate: Formulation, Bioavailability, and Research Distinctions
                        • Epithalon Peptide Research: Telomerase Activation, Aging, and Pineal Gland Function
                        • Estrogen Receptor Signaling and Enclomiphene: How Selective Modulators Compare with Classic Polypeptide Hormones
                        • GHK-Cu Peptide: Advanced Mechanisms in Extracellular Matrix Remodeling and Wound Healing Research
                        • GHK-Cu Peptide: Collagen Synthesis, Wound Repair, and Skin-Barrier Research Models
                        • GLP-1 vs GLP-3 vs GLP-2: Peptide Classification and Research Applications
                        • GLP-2 Peptide Research Guide: Gut Barrier Function, Nutrient Absorption, and Intestinal Recovery Models
                        • GLP-3 Retatrutide vs. GLP-1 Drugs: What Triple-Agonist Biology Changes in Research Models
                        • Ipamorelin and Tesamorelin Combination: Synergistic GH Secretagogue Research and Dosing Protocols
                        • GLP2 Tirz Peptide: What It Is, Why the Name Exists, and How Researchers Should Interpret It
                        • Klow Blend Peptide Nasal Spray: What the Formulation Is Trying to Do in Cognitive Research
                        • Mitochondria, NNMT Inhibition, and Peptide Modulators: Where MOTS‑c and 5‑Amino‑1MQ Fit in Cellular Energy Research
                        • MOTS-c Peptide: Mitochondrial Function, Energy Metabolism, and What Researchers Measure
                        • MOTS-c vs. 5-Amino-1MQ: Which Metabolic Research Questions Each Compound Actually Answers
                        • Nasal Spray Peptides: Bioavailability, Administration, and Semax/Selank Research Applications
                        • PT-141 Peptide Research: Mechanism of Action and Melanocortin Receptor Signaling
                        • Retatrutide for Research: Mechanism, Structure, and GLP-1/GLP-3 Dual Action
                        • Retatrutide for Obesity and Type 2 Diabetes: What the Latest Trial Data Suggest
                        • Tesofensine Peptide Research: Mechanism, Appetite Suppression, and Neuropeptide Y Pathways
  • Contact
    • Contact Customer Service
    • Text Customer Support
  • About US
  • Shop all peptides
  • Affiliate Program
    • Affiliate Signup
  • Login / Register Login / Register Page Link Login / Register Page Link
  • Click to open the search input field Click to open the search input field Search
  • Menu Menu
Prednisone and Metabolic Peptides: A Glucocorticoid-Control Framework for Glucose, Appetite, and Inflammation Experiments

Prednisone and Metabolic Peptides: A Glucocorticoid-Control Framework for Glucose, Appetite, and Inflammation Experiments

October 13, 2026/0 Comments/in Uncategorized/by

}

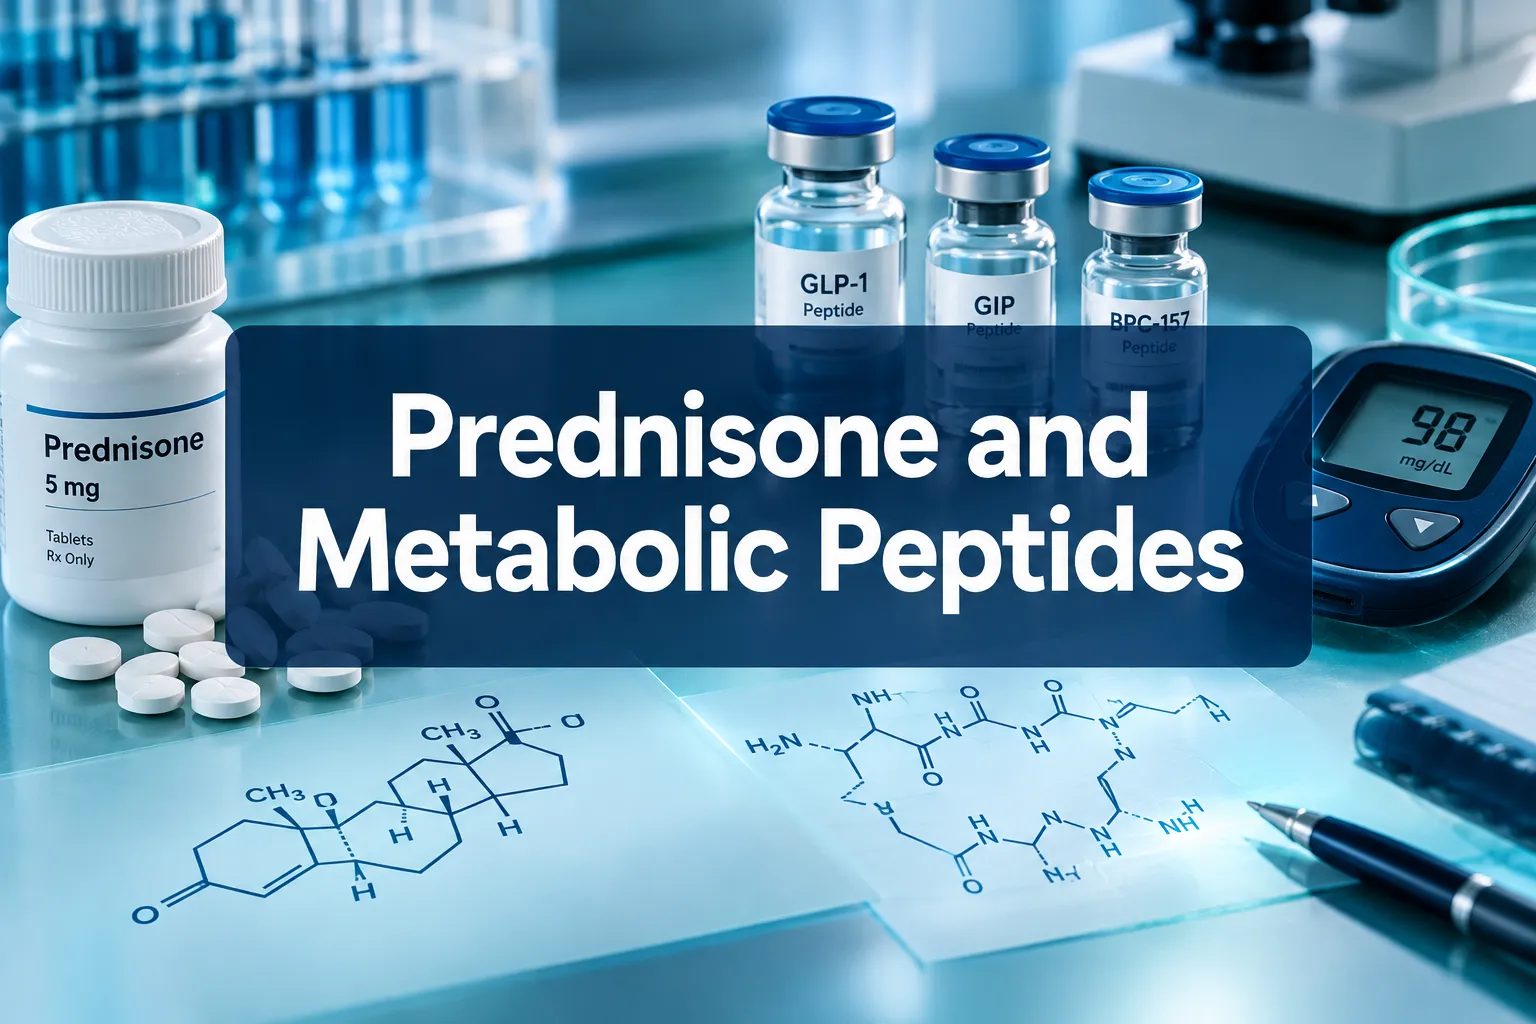
Professional () hero image with 'Prednisone and Metabolic Peptides' in crisp white on a deep navy semi-transparent panel,

Glucocorticoids cause measurable hyperglycemia in roughly 50 percent of hospitalized patients who receive them, yet most experimental designs still treat prednisone as a simple background variable rather than an active metabolic driver. That gap matters enormously when researchers are trying to isolate peptide activity from steroid noise. Building a rigorous Prednisone and Metabolic Peptides: A Glucocorticoid-Control Framework for Glucose, Appetite, and Inflammation Experiments requires separating three overlapping effects, glucose dysregulation, appetite amplification, and inflammatory signaling, and assigning each a mechanistic control arm that can be tested independently.

Key Takeaways

  • Prednisone activates glucocorticoid receptors in multiple organs simultaneously, producing coordinated changes in glucose, appetite peptides, and inflammatory markers.
  • Acute medium-dose exposure creates a predictable midday-to-midnight postprandial glucose and peptide profile that can anchor time-structured experimental sampling.
  • Chronic low-dose exposure produces a distinct "mild steroid diabetes" phenotype dominated by hepatic insulin resistance rather than sustained fasting hyperglycemia.
  • Adipokines such as leptin and resistin serve as measurable intermediaries linking glucocorticoid exposure to both appetite and inflammation endpoints.
  • GLP-1 receptor agonists are the leading peptide class for countering glucocorticoid metabolic toxicity and represent a strong experimental comparator arm.

How Prednisone Disrupts the Glucose-Peptide Axis
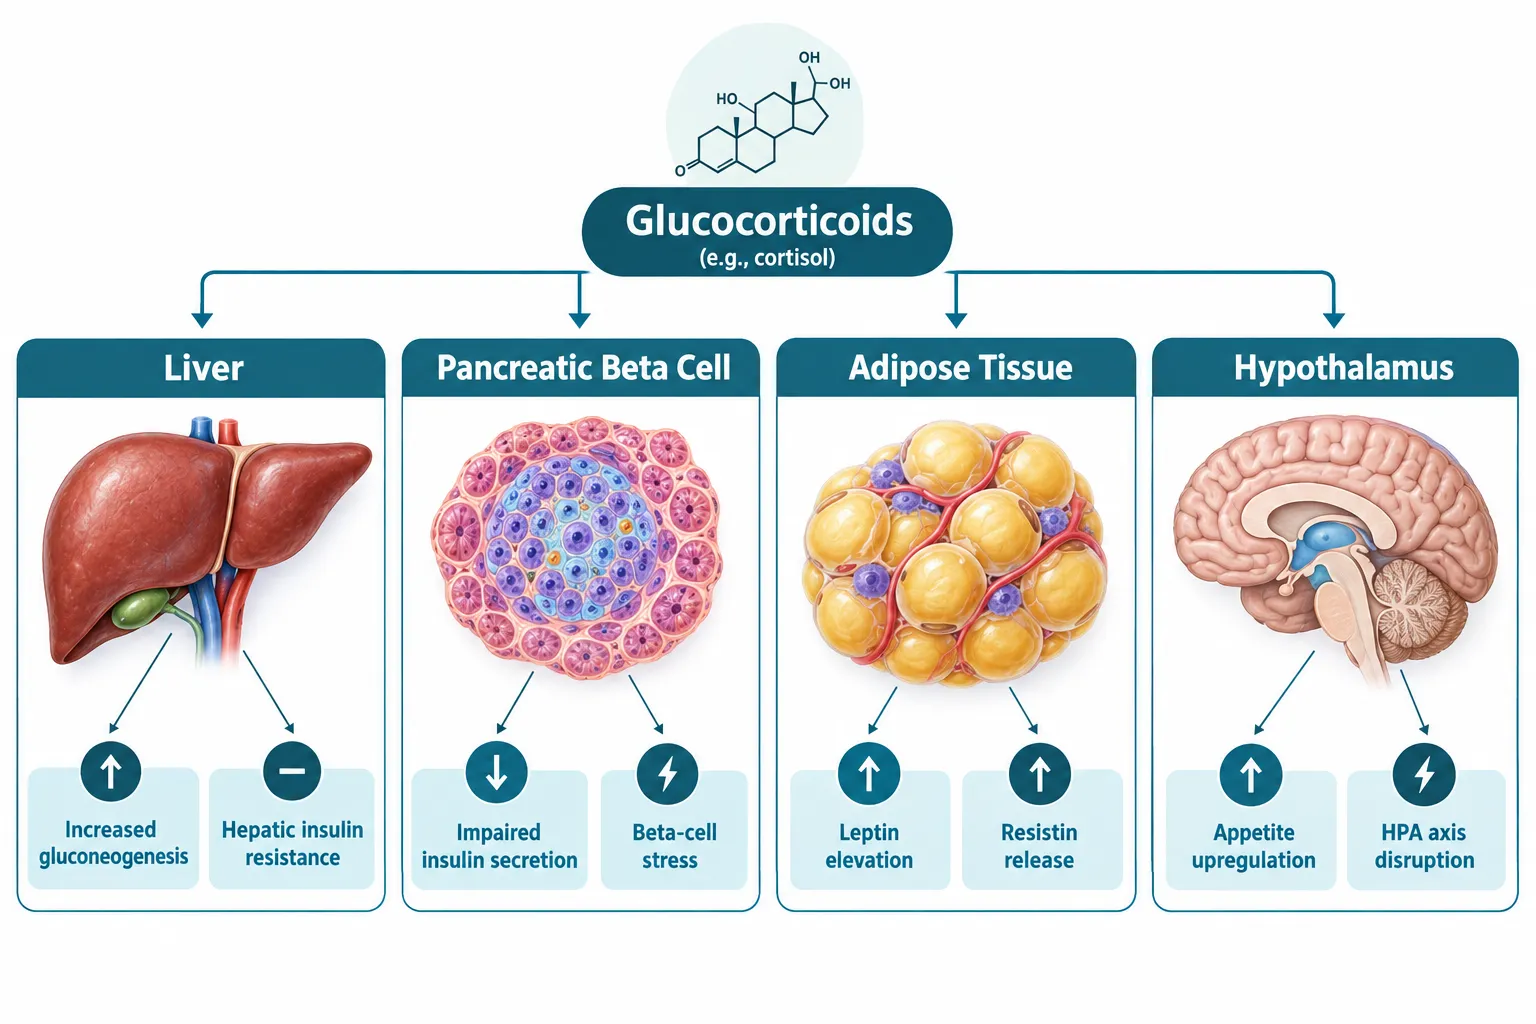
How Prednisone Disrupts the Glucose-Peptide Axis

Prednisone is converted to prednisolone in the liver, where it binds glucocorticoid receptors and triggers a cascade that spans at least five organ systems. Understanding each node is essential before selecting experimental endpoints.

The four primary disruption sites are:

Organ Glucocorticoid Effect Measurable Peptide Change
Liver Increased gluconeogenesis Elevated fasting glucose, altered C-peptide
Pancreatic beta cells Impaired insulin secretion Reduced insulin, suppressed C-peptide
Adipose tissue Leptin and resistin release Elevated adipokines, insulin resistance
Hypothalamus Appetite upregulation Altered hunger signaling, increased caloric intake

Acute medium-dose prednisone in controlled studies produces marked postprandial hyperglycemia from midday through midnight. In individuals with type 2 diabetes, insulin and C-peptide secretion are suppressed during this window, while at-risk subjects show altered C-peptide patterns even without overt diabetes. This predictable 24-hour glucose and peptide profile is highly useful as a temporal anchor for sampling schedules.

Short-term moderate doses in healthy volunteers significantly increase circulating glucose, insulin, C-peptide, glucagon, and IGF-I, while simultaneously lowering IGF-II and specific IGF-binding proteins. Notably, these changes occur without immediate impairment of whole-body muscle protein metabolism, which means acute experiments can focus on the glucose-peptide axis without confounding from skeletal muscle wasting in the early window.

"Prednisone does not act on one pathway, it acts on an inter-organ control system, and experiments that ignore that architecture will produce uninterpretable peptide data."


Designing the Glucocorticoid-Control Framework for Glucose, Appetite, and Inflammation Experiments
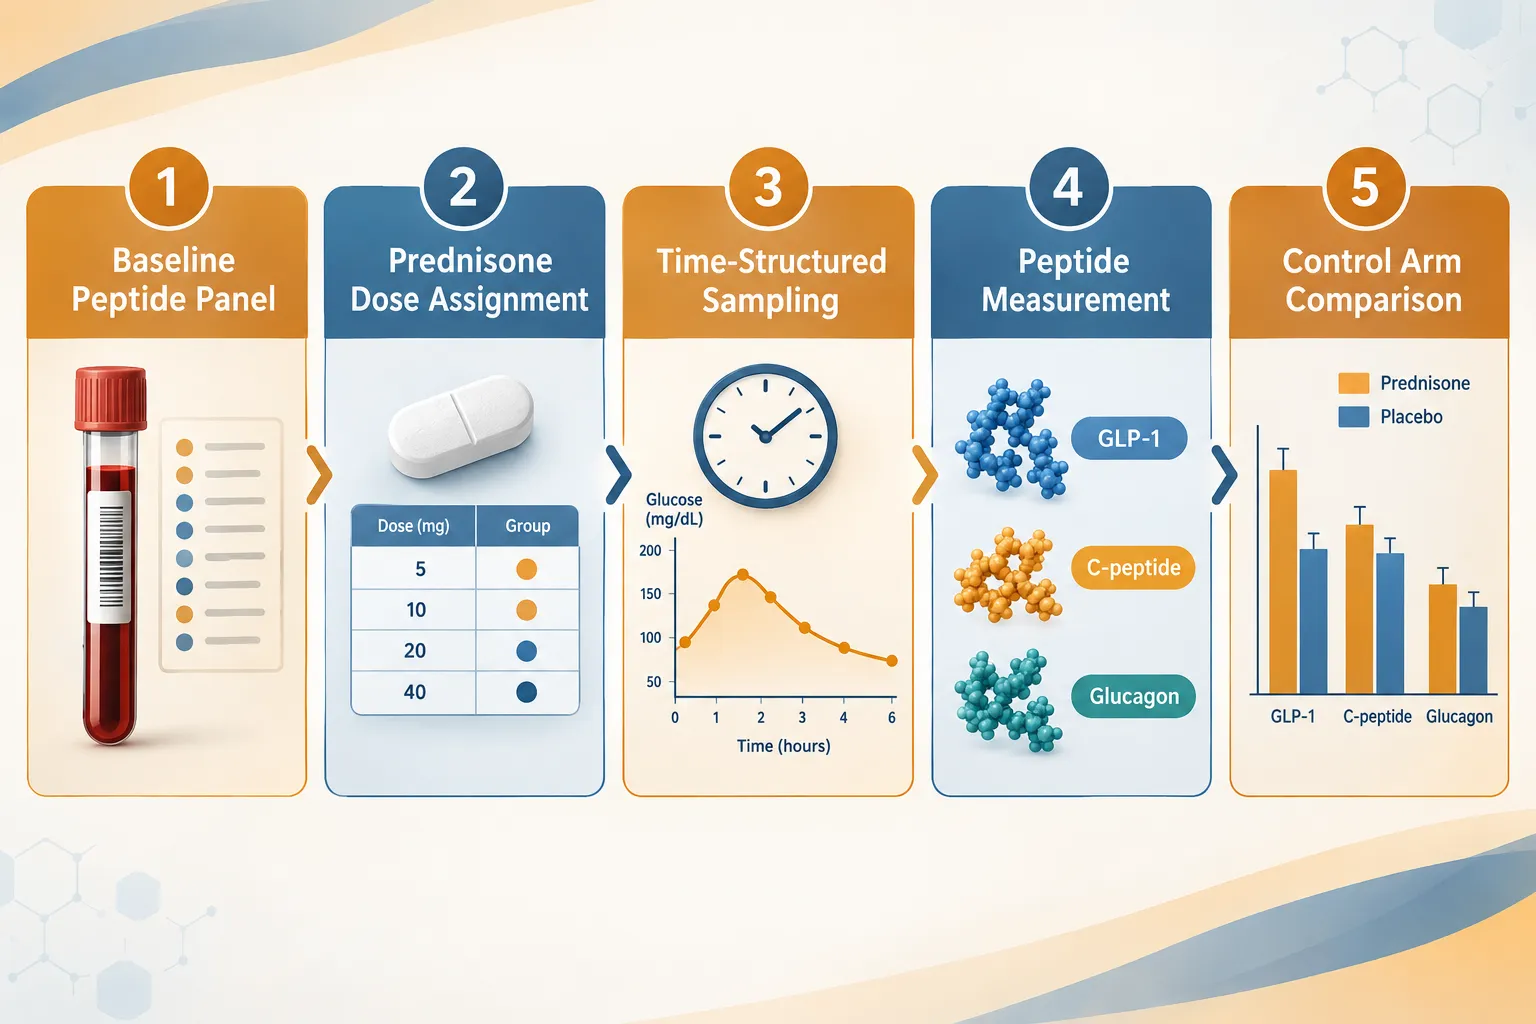
Designing the Glucocorticoid-Control Framework for Glucose, Appetite, and Inflammation Experiments

A well-structured Prednisone and Metabolic Peptides: A Glucocorticoid-Control Framework for Glucose, Appetite, and Inflammation Experiments separates dose-dependent effects into three distinct experimental arms.

Arm 1, Acute High-Dose Glucose and Peptide Profiling

Acute high-dose exposure is characterized by rapid fluid retention, appetite stimulation, and a sharp postprandial glucose rise. The recommended peptide panel for this arm includes:

  • Insulin and C-peptide (sampled hourly from 0800 to 2400)
  • Glucagon (to capture counter-regulatory response)
  • IGF-I and IGF-II (to detect early anabolic-catabolic shift)
  • Leptin and resistin (adipokine intermediaries linking appetite and inflammation)

High-dose prednisolone increases both leptin and resistin, making these adipokines reliable biomarkers of glucocorticoid intensity. Incorporating them into the panel connects glucose dysregulation to appetite and inflammatory signaling within a single measurement framework.

For researchers working with lab tested peptides in this context, purity verification is a non-negotiable prerequisite to avoid confounding the peptide signal with degradation products.

Arm 2, Chronic Low-Dose Steroid Diabetes Control

Chronic low-dose prednisolone at 10 mg/day or less produces a distinct phenotype: hepatic insulin resistance and reduced peripheral non-oxidative glucose disposal, resulting in mild postprandial hyperglycemia while fasting glucose and HbA1c remain near baseline. This "mild steroid diabetes" profile is easily missed by fasting-only sampling protocols.

Critical design points for this arm:

  • Use postprandial glucose sampling rather than fasting-only measures
  • Include hepatic insulin sensitivity indices alongside peripheral measures
  • Track weight trajectory and fluid balance as appetite endpoints
  • Sample adipokines at baseline and at four-week intervals

Arm 3, GLP-1 Peptide Comparator

GLP-1 receptor agonists are now the leading peptide class for countering glucocorticoid-related hyperglycemia and weight gain. Early evidence positions them as central candidates in experimental designs examining peptide-based control of glucocorticoid metabolic toxicity. Researchers exploring GLP-1 peptide sourcing and research concepts will find that this comparator arm requires careful dose-timing relative to prednisone administration to avoid masking the steroid's glucose signature.

Related incretin-based research can also draw on GLP-3 peptide formulations and cagrilintide peptide combinations, which target both appetite suppression and glucose regulation through complementary receptor pathways.


Separating Appetite Effects from Glucose Effects in Prednisone Research
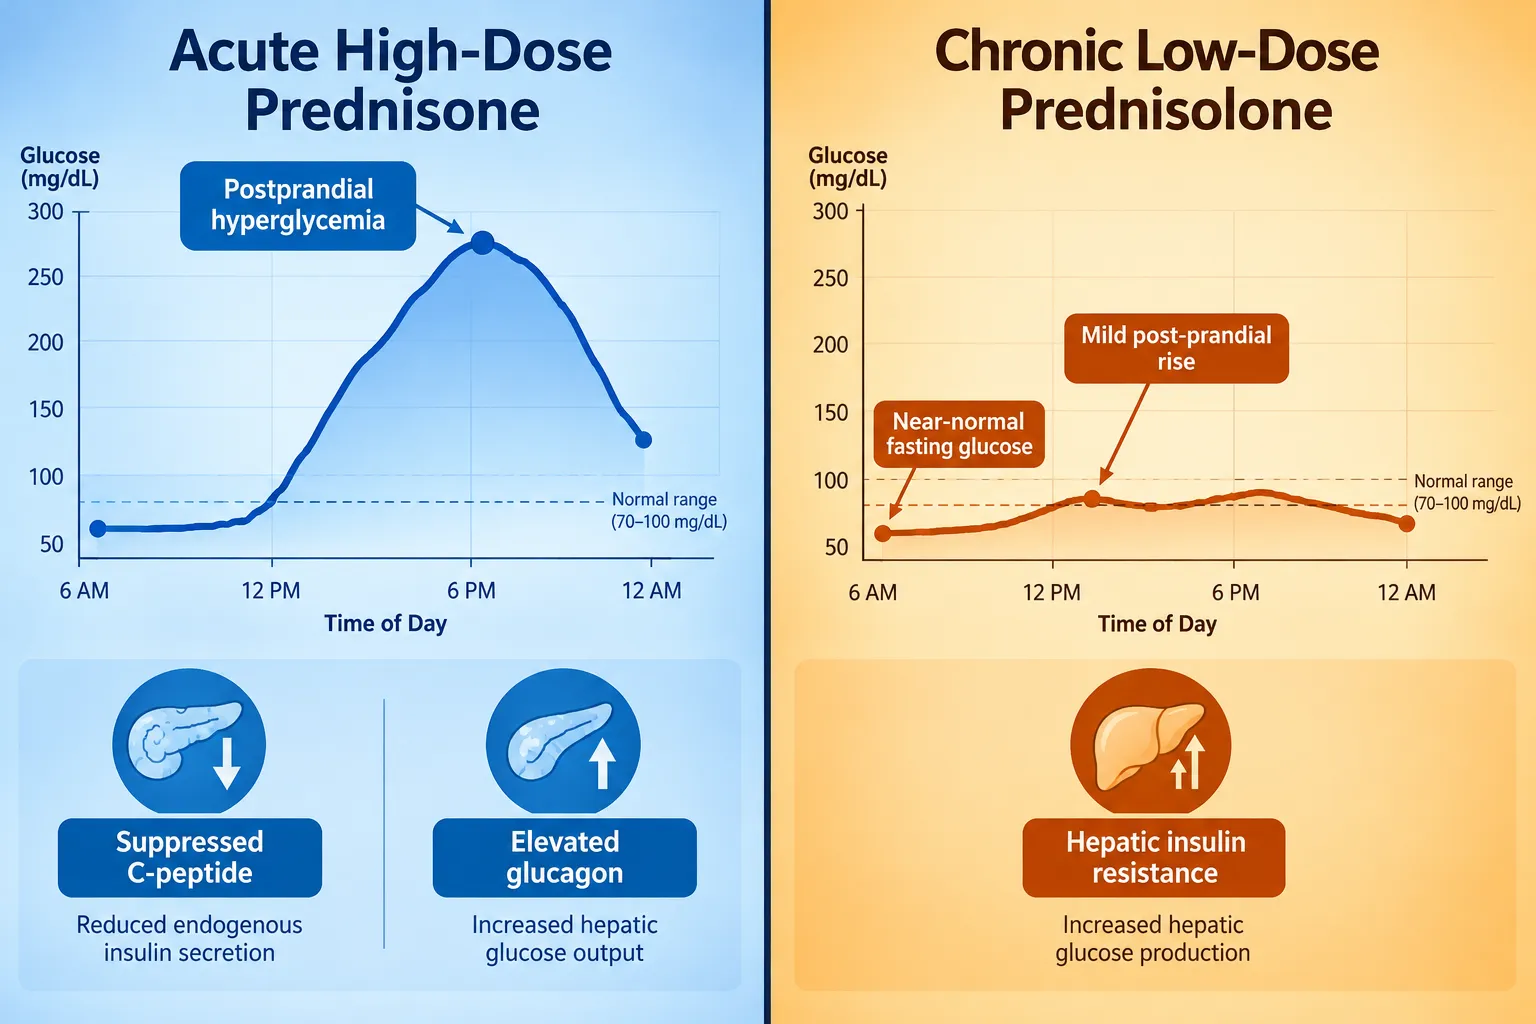
Separating Appetite Effects from Glucose Effects in Prednisone Research

One of the most common errors in glucocorticoid research is conflating appetite-driven weight gain with glucose-driven metabolic change. The Prednisone and Metabolic Peptides: A Glucocorticoid-Control Framework for Glucose, Appetite, and Inflammation Experiments addresses this by assigning independent measurement tracks to each pathway.

Appetite track endpoints:

  • Daily caloric intake logs (validated recall instruments)
  • Leptin and resistin at fasting and two hours postprandial
  • Body weight and waist circumference at weekly intervals
  • Fluid balance (to separate fluid-related weight gain from fat mass gain)

Glucose track endpoints:

  • Continuous glucose monitoring or hourly postprandial sampling
  • Fasting insulin, C-peptide, and HOMA-IR
  • Urinary 3-methylhistidine (early muscle wasting marker from metabolomic profiling)
  • DHEA-S (decreases under glucocorticoid load, useful as an exposure marker)

Metabolomic studies of prednisolone in healthy subjects show increased urinary and serum proteinogenic amino acids alongside elevated glucose and carnitine-related metabolites. These profiles offer rich readouts that can integrate glucocorticoid dose with downstream inflammation or muscle outcomes when added to a standard peptide panel.

For mitochondrial and oxidative stress dimensions of glucocorticoid exposure, SS-31 peptide research offers a mechanistically distinct comparator, given SS-31's role in cardiolipin stabilization and mitochondrial membrane protection under metabolic stress conditions.

Researchers interested in cellular energy metabolism alongside glucocorticoid effects may also find value in reviewing NAD peptides as a complementary readout for mitochondrial function during steroid exposure.


Conclusion

A rigorous glucocorticoid-control framework does not treat prednisone as background noise, it treats it as an active experimental variable with predictable, dose-dependent effects on glucose, appetite peptides, and inflammatory markers. The actionable next steps for researchers are clear:

  1. Select dose tier first. Acute high-dose and chronic low-dose regimens produce mechanistically distinct phenotypes that require different sampling schedules and peptide panels.
  2. Build a multi-peptide panel. Insulin, C-peptide, glucagon, IGF-I, leptin, and resistin together cover the glucose, appetite, and inflammation axes simultaneously.
  3. Assign a GLP-1 comparator arm. GLP-1 receptor agonists are the best-evidenced peptide class for countering glucocorticoid metabolic toxicity and provide a clean experimental contrast.
  4. Separate appetite from glucose tracking. Use independent measurement instruments for caloric intake and fluid balance so that weight gain data can be correctly attributed.
  5. Verify peptide purity. Every peptide used in the experimental panel should come from a verified, lab-tested source to ensure signal integrity across the full measurement window.

Applying these principles transforms prednisone from a confounding variable into a well-characterized experimental tool, and makes every downstream peptide measurement more interpretable.

https://www.puretestedpeptides.com/wp-content/uploads/2026/10/prednisone-and-metabolic-peptides-a-glucocorticoid-control-framework-for-glucose.webp 1024 1536 https://www.puretestedpeptides.com/wp-content/uploads/2026/01/buy-peptides-online.jpg 2026-10-13 13:05:542026-10-13 13:05:54Prednisone and Metabolic Peptides: A Glucocorticoid-Control Framework for Glucose, Appetite, and Inflammation Experiments
Trazodone, Appetite, and Peptide Weight-Loss Models: Controlling Sedation, Sleep, and Food-Intake Confounders

Trazodone, Appetite, and Peptide Weight-Loss Models: Controlling Sedation, Sleep, and Food-Intake Confounders

October 13, 2026/0 Comments/in Uncategorized/by

Roughly 40% of adults prescribed trazodone use it primarily for sleep rather than depression, yet most peptide weight-loss trials fail to screen for concurrent sedative use. That gap is not trivial. When a sedating psychotropic runs alongside a metabolic peptide like retatrutide or a GLP-1 receptor agonist, the result is a tangled web of overlapping effects on sleep architecture, daytime activity, meal timing, and caloric intake. Untangling those effects is exactly what rigorous study design demands. Understanding trazodone, appetite, and peptide weight-loss models: controlling sedation, sleep, and food-intake confounders is therefore essential for anyone designing or interpreting metabolic research in 2026.

Key Takeaways

  • Trazodone is largely weight-neutral but can shift sleep timing, reduce daytime activity, and alter meal patterns, all of which confound peptide weight-loss data.
  • GLP-1 and related peptides reduce weight primarily by cutting caloric intake, not by raising energy expenditure, making food-intake measurement especially critical.
  • Sleep duration and quality are independent predictors of weight-loss success; trazodone's sleep-extending effects must be separated from peptide-driven changes.
  • Late-evening eating and compressed pre-sleep intervals measurably undermine peptide efficacy, and trazodone can shift both behaviors.
  • Researchers should apply standardized confounder controls, actigraphy, meal-timing logs, sedation scales, before attributing weight outcomes to peptide pharmacology alone.

Trazodone's Pharmacological Profile and Its Weight Implications

Trazodone's Pharmacological Profile and Its Weight Implications

Trazodone is a serotonin antagonist and reuptake inhibitor (SARI) with pronounced sedative and anxiolytic properties at low doses of 25-75 mg, reaching full antidepressant effect at 150-300 mg. Its sedation profile places it alongside mirtazapine and tricyclics in terms of CNS burden, a fact that distinguishes it sharply from activating agents such as bupropion.

On appetite and weight, the picture is reassuring but nuanced:

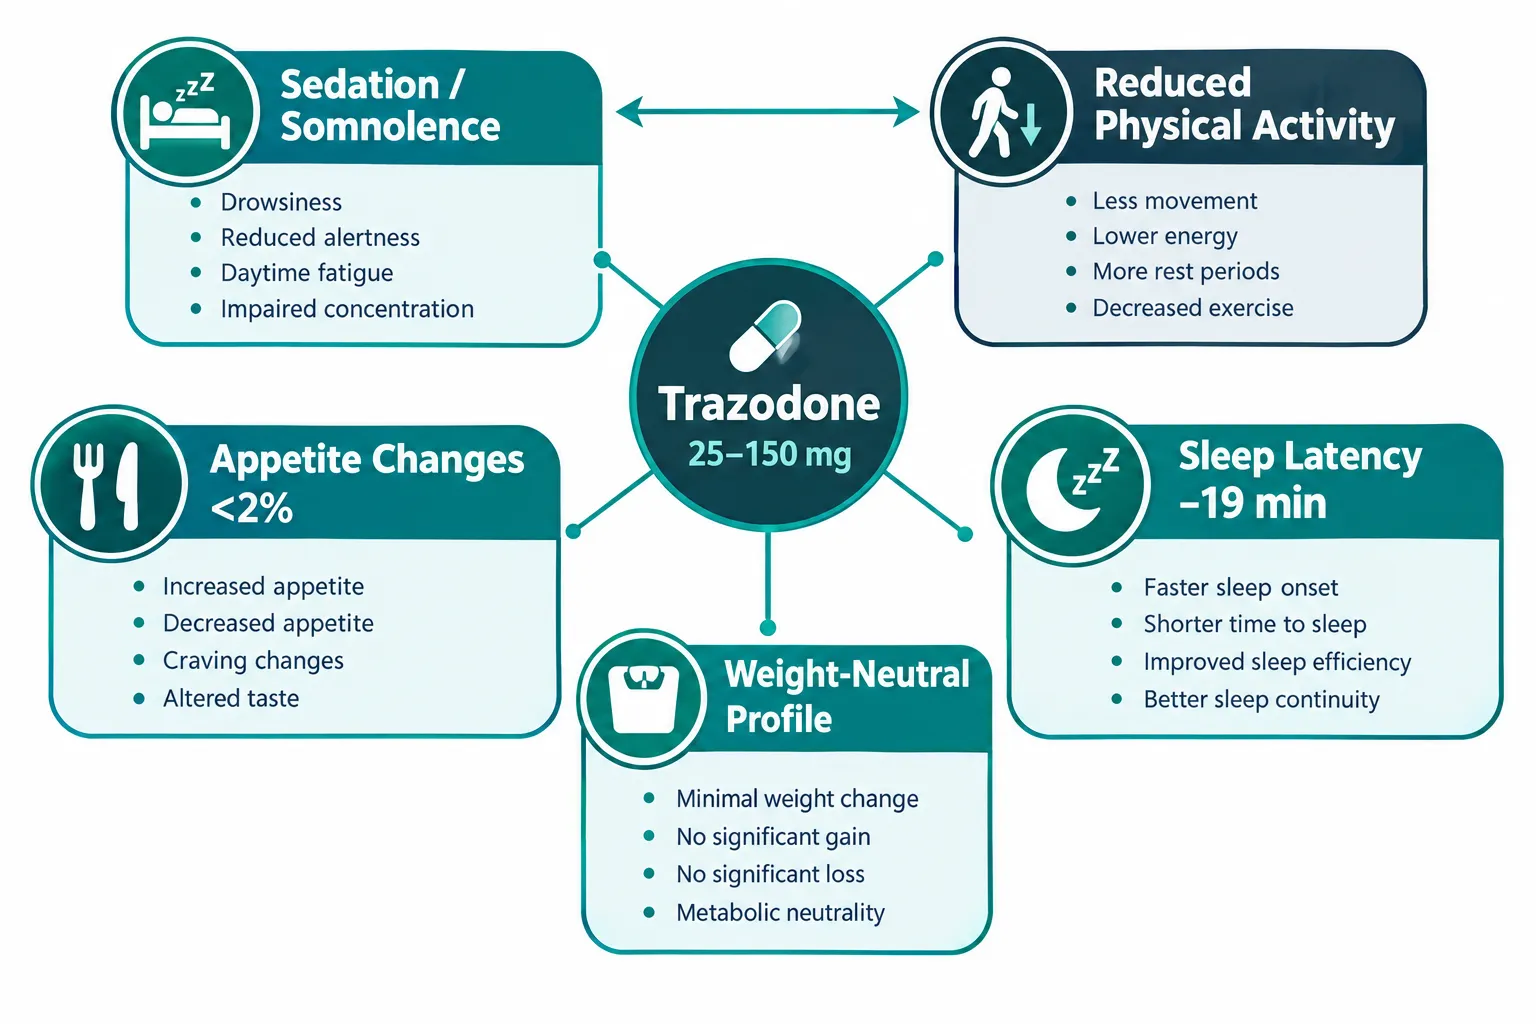
  • Increased appetite is listed as an adverse reaction with an incidence below 2% in controlled trials.
  • Roughly equal proportions of trial participants gained weight (about 5%) and lost weight (about 6%), supporting a predominantly weight-neutral classification.
  • Long-term data show minimal impact on glucose metabolism or body composition.
  • Any observed weight change may partly reflect improved depressive symptoms rather than direct pharmacologic action on appetite circuits.

"Trazodone lacks the appetite-stimulating profile seen with mirtazapine and many antipsychotics, but its sedation burden is a separate and underappreciated confounder in metabolic studies."

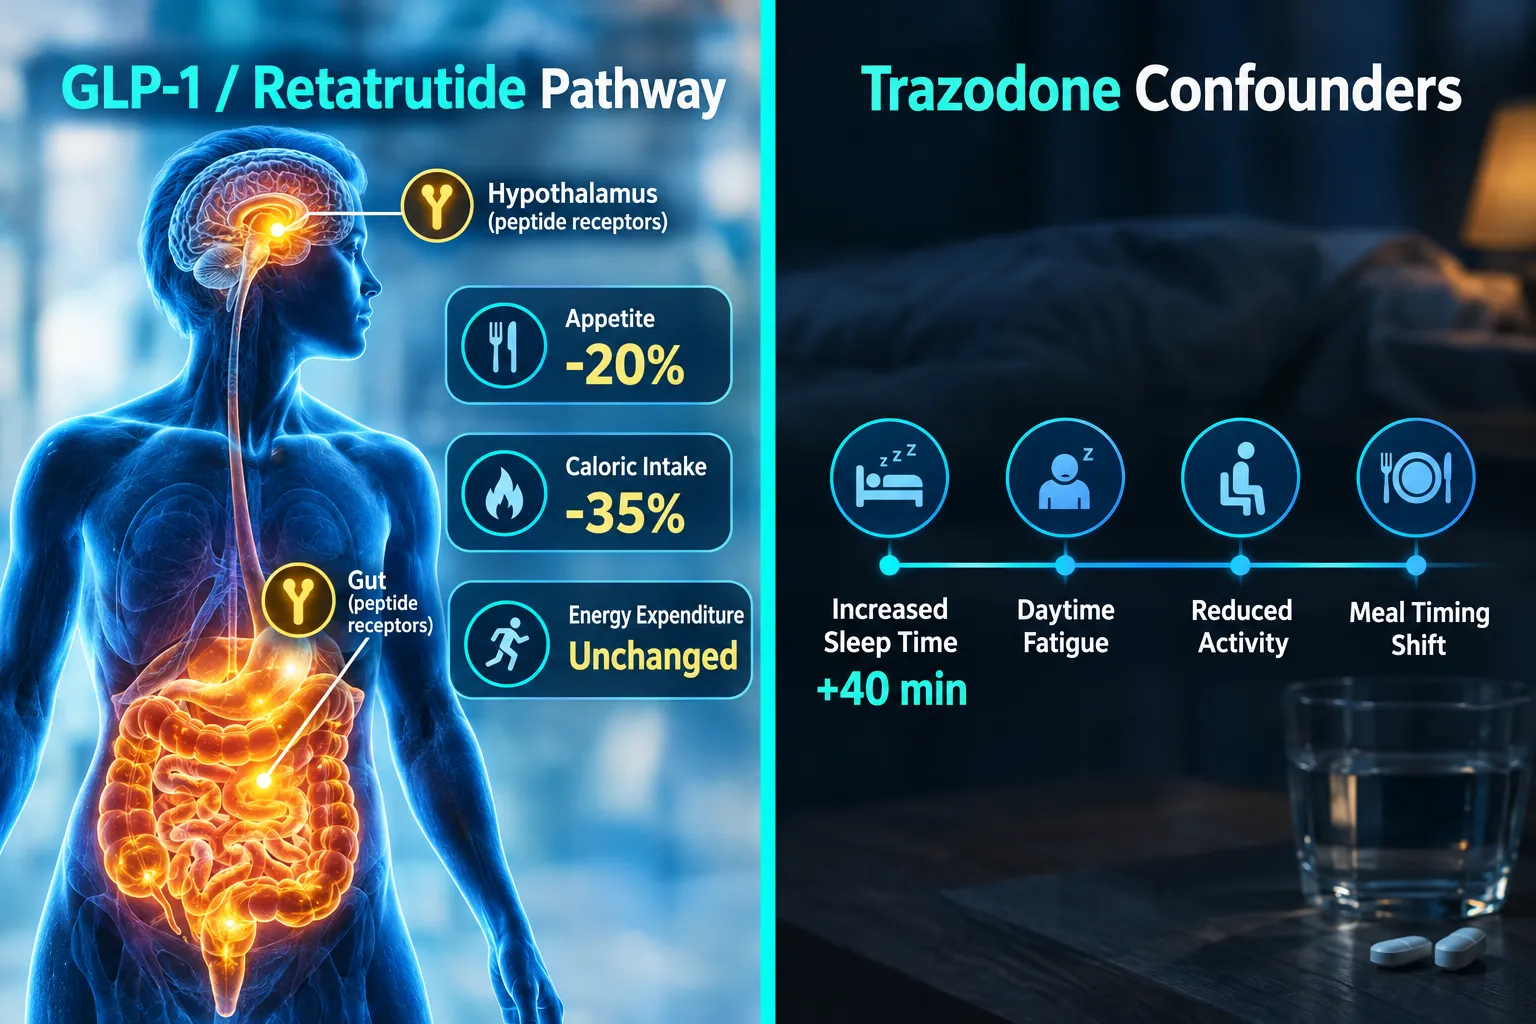
Where trazodone becomes problematic in research is not through appetite stimulation but through behavioral pathways: increased total sleep time (approximately 40 minutes in randomized trials), reduced sleep-onset latency (roughly 19 minutes), and daytime grogginess that suppresses physical activity. These effects are most prominent at 50-150 mg, the exact range used off-label for insomnia.

Importantly, the American Academy of Sleep Medicine and VA/DoD guidelines advise against trazodone for chronic insomnia disorder, recommending it only when other options fail or comorbid depression is present. Despite this, off-label prescribing remains widespread, meaning researchers enrolling metabolic-study participants will frequently encounter undisclosed trazodone use.


GLP-1 and Retatrutide Mechanisms: Why Food Intake Measurement Is Non-Negotiable

GLP-1 and Retatrutide Mechanisms: Why Food Intake Measurement Is Non-Negotiable

Understanding the intersection of trazodone, appetite, and peptide weight-loss models: controlling sedation, sleep, and food-intake confounders requires clarity on how peptide agents actually produce weight loss.

GLP-1 receptor agonists and next-generation multi-agonist peptides such as retatrutide reduce subjective appetite by approximately 0-20% and lower ad libitum energy intake by up to 35% in both obese and non-obese subjects. Crucially, across multiple studies, GLP-1 receptor agonist monotherapy or combination therapy showed non-significant effects on energy expenditure in a substantial proportion of trial datasets. Weight loss is therefore driven almost entirely by decreased caloric intake, not by metabolic rate changes.

This has a direct implication: any co-administered agent that alters eating behavior, meal timing, or sleep-related food consumption will distort the apparent efficacy of the peptide.

Key peptide-relevant confounders introduced by trazodone:

Confounder Mechanism Direction of Bias
Extended sleep duration Reduces waking hours available for eating May falsely amplify peptide weight loss
Daytime sedation Lowers physical activity and NEAT May reduce energy expenditure independently
Meal timing shift Sedation can delay or compress eating windows Interacts with peptide gastric-emptying effects
Grogginess / dizziness Reduces adherence to structured meal protocols Introduces noise in intake measurements

Researchers exploring what is the strongest peptide for weight loss need to account for these behavioral confounders before drawing mechanistic conclusions from body-weight endpoints.

GLP-1 agonists do improve obstructive sleep apnea, but this benefit is driven largely by weight loss rather than direct effects on sleep physiology. A concurrent sedative like trazodone can alter arousal threshold and sleep continuity in ways that mimic or mask those improvements, making it essential to model the two pharmacologic effects separately. Studies examining GLP-3 peptide variants or agents like cagrilintide peptide face the same confounding challenge when participants use sedating psychotropics.


Designing Confounder Controls for Trazodone in Peptide Weight-Loss Studies

Designing Confounder Controls for Trazodone in Peptide Weight-Loss Studies

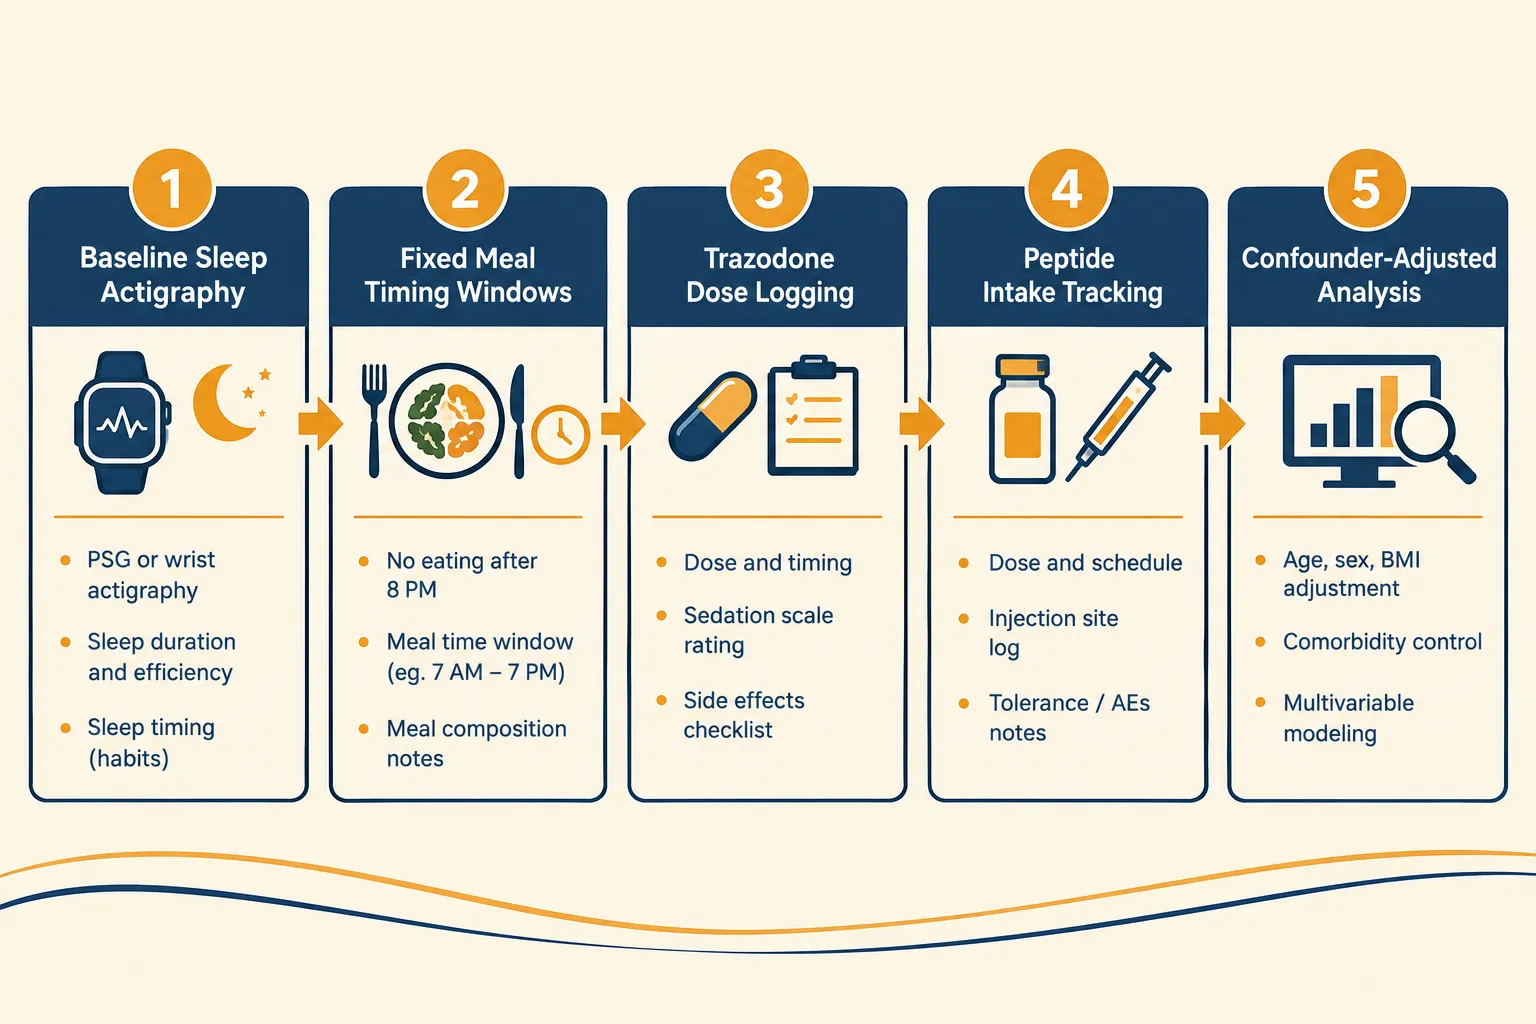
Addressing trazodone, appetite, and peptide weight-loss models: controlling sedation, sleep, and food-intake confounders at the design stage is far more effective than attempting statistical adjustment after data collection.

Sleep and activity controls:

  • Wrist actigraphy or polysomnography at baseline and follow-up intervals
  • Standardized sedation rating scales administered at each study visit
  • Daily step counts or accelerometry to capture trazodone-driven reductions in non-exercise activity thermogenesis (NEAT)

Meal-timing and food-intake controls:

  • Fixed eating windows with no food intake after 8:00 p.m.
  • A minimum three-hour gap between the last meal and sleep onset
  • Validated 24-hour dietary recall or continuous food logging apps

Research published in 2025 found that severe stress, late dinner timing (after 9 p.m.), and less than three hours between dinner and bedtime significantly undermined peptide-based weight-loss treatment by disrupting sleep. Trazodone can shift all three of these variables simultaneously, compressing the pre-sleep interval by advancing sleep onset while leaving dinner timing unchanged.

Short objective sleep duration also predicts poor long-term weight-loss maintenance independently of intervention type, age, and sex. Worse perceived sleep quality during caloric restriction is associated with less total weight loss. This means trazodone's sleep-extending effect could artificially improve weight-loss outcomes in short trials while masking inadequate peptide response.

Recommended stratification variables:

  • Trazodone dose (none / low 25-75 mg / therapeutic 150-300 mg)
  • Baseline insomnia severity index score
  • Comorbid depression status (since weight change may reflect mood improvement)
  • BMI and type 2 diabetes status, both of which confound GLP-1 treatment selection and baseline disease severity

For researchers sourcing compounds for mechanistic studies, lab tested peptides with verified purity are a prerequisite for isolating pharmacologic effects from analytical noise. Similarly, understanding peptide half life is critical when scheduling blood draws and behavioral assessments around trazodone's own pharmacokinetic curve.

Emerging multi-receptor peptide agents, including those reviewed under buy reta peptide research tags, present additional complexity because their CNS effects, including possible alterations in sleep architecture and arousal, have not been fully characterized. A 2025 editorial in a leading sleep journal raised concerns that GLP-1 class agents may affect sleep continuity and circadian regulation in patients predisposed to hyperarousal, and called for systematic assessment of insomnia alongside peptide therapy. When trazodone is also present, combined CNS effects could mask or exaggerate true drug-related changes in both sleep and weight.


Conclusion

Trazodone's weight-neutral pharmacology does not make it a benign bystander in peptide weight-loss research. Its sedating effects extend sleep, suppress daytime activity, shift meal timing, and introduce behavioral confounders that can inflate, deflate, or simply obscure the true metabolic signal of GLP-1 agonists, retatrutide, and related compounds.

Actionable next steps for researchers and clinicians:

  1. Screen all participants for current trazodone use and dose at enrollment, not just at baseline questionnaire.
  2. Stratify or exclude trazodone users in primary analyses; include them in sensitivity analyses with dose as a covariate.
  3. Deploy objective sleep measurement (actigraphy minimum, polysomnography preferred) at baseline and at each major timepoint.
  4. Enforce meal-timing protocols with a hard cutoff at least three hours before trazodone-adjusted sleep onset.
  5. Separate sleep-quality improvements from peptide-driven weight loss using validated insomnia and sleep-apnea measures before attributing outcome differences to appetite suppression.

Rigorous control of these confounders is not methodological perfectionism, it is the minimum standard for generating trustworthy data on peptide-based metabolic therapies in a real-world population where sedative co-prescribing is common.

https://www.puretestedpeptides.com/wp-content/uploads/2026/10/trazodone-appetite-and-peptide-weight-loss-models-controlling-sedation-sleep-and.webp 1024 1536 https://www.puretestedpeptides.com/wp-content/uploads/2026/01/buy-peptides-online.jpg 2026-10-13 13:05:052026-10-13 13:05:05Trazodone, Appetite, and Peptide Weight-Loss Models: Controlling Sedation, Sleep, and Food-Intake Confounders
Ondansetron Beyond Nausea: Serotonin-Receptor Controls for Gastric Emptying, Intake, and GLP-Class Peptide Experiments

Ondansetron Beyond Nausea: Serotonin-Receptor Controls for Gastric Emptying, Intake, and GLP-Class Peptide Experiments

October 13, 2026/0 Comments/in Uncategorized/by

Blocking a single receptor subtype can change how much a person eats at a meal without meaningfully changing how fast the stomach empties, and that endpoint separation is exactly what makes ondansetron scientifically interesting far outside the antiemetic ward. This article examines the topic of Ondansetron Beyond Nausea: Serotonin-Receptor Controls for Gastric Emptying, Intake, and GLP-Class Peptide Experiments with a focus on receptor selectivity, measurable physiological endpoints, and what preclinical peptide work actually shows versus what clinical evidence supports.

Key Takeaways

  • Ondansetron is a selective 5-HT3 receptor antagonist whose effects on gastric emptying and food intake are largely independent of each other.
  • Human studies show it increases meal volume at maximum satiation without producing major changes in gastric emptying time.
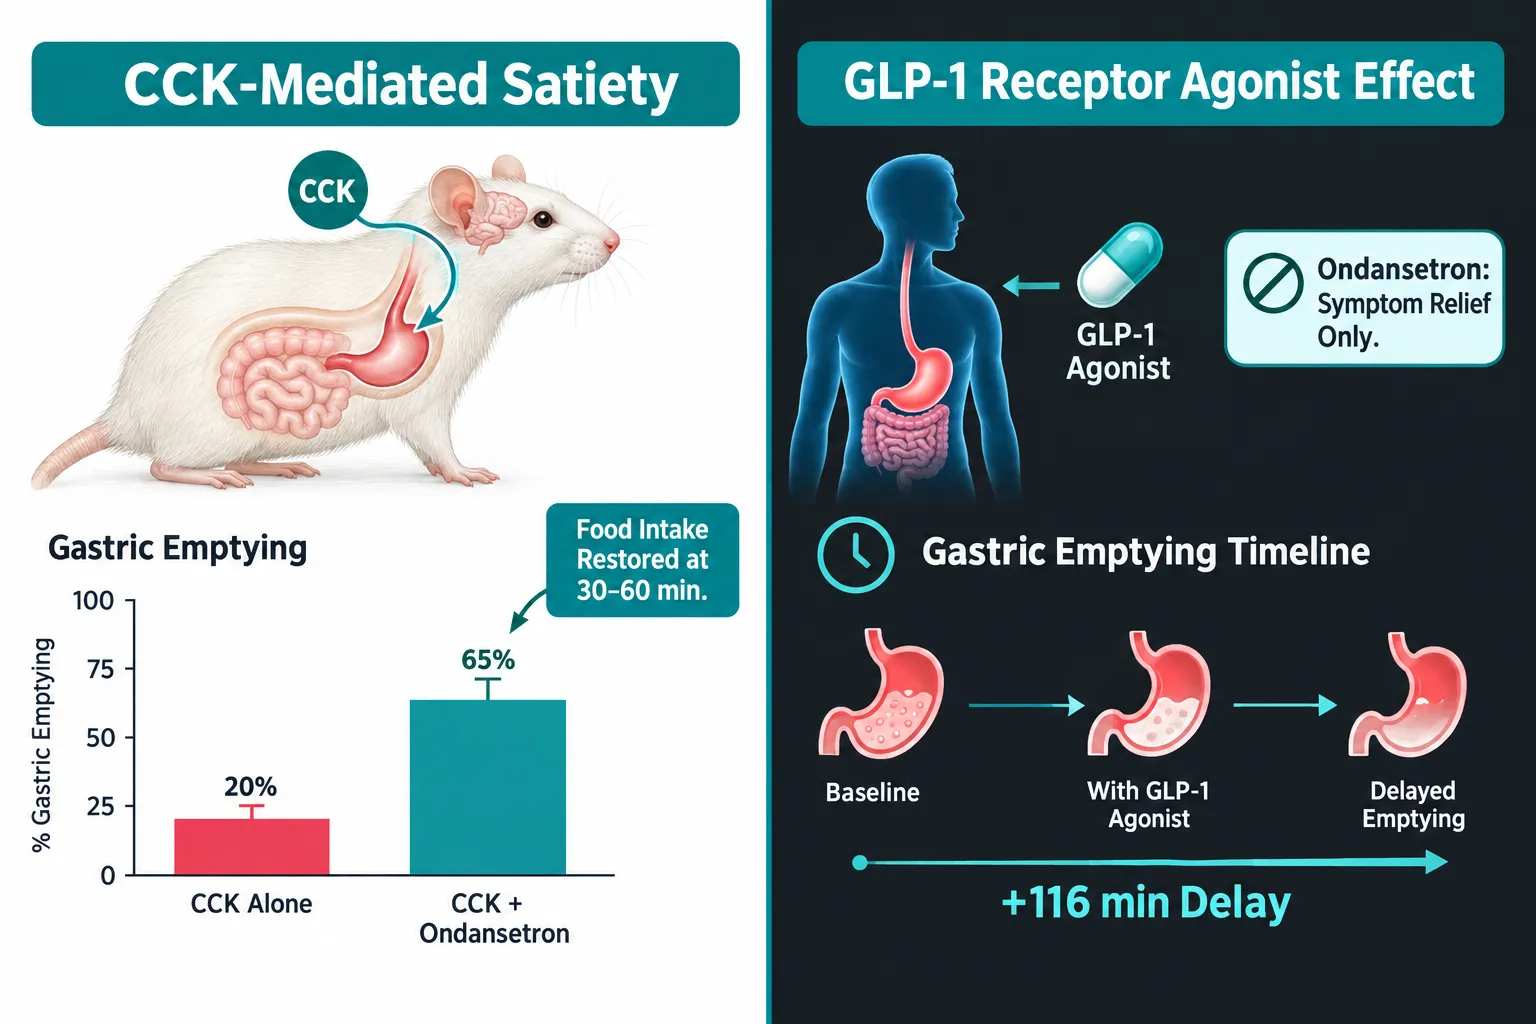
  • In animal models, 5-HT3 blockade reverses CCK-induced reductions in food intake and gastric emptying delay.
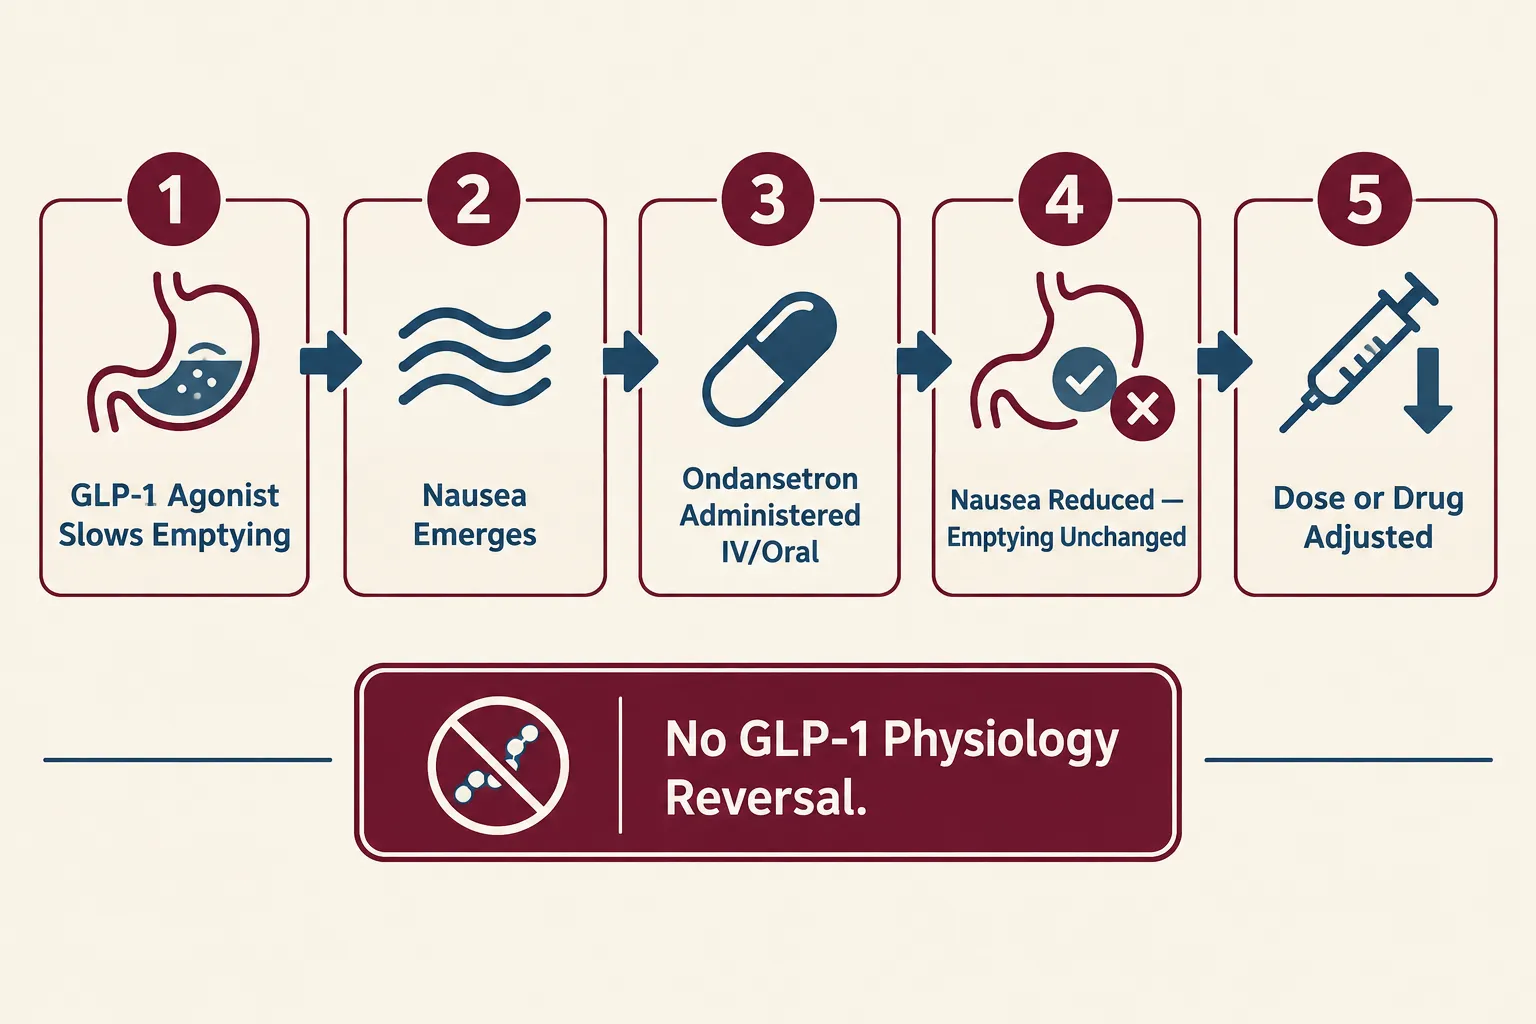
  • GLP-1 receptor agonists delay gastric emptying significantly; ondansetron manages the resulting nausea but does not correct the underlying motility disorder.
  • No high-quality clinical trials as of 2026 have established ondansetron as a modifier of GLP-1 or incretin peptide physiology.

How 5-HT3 Receptor Selectivity Creates Separated Endpoints

How 5-HT3 Receptor Selectivity Creates Separated Endpoints

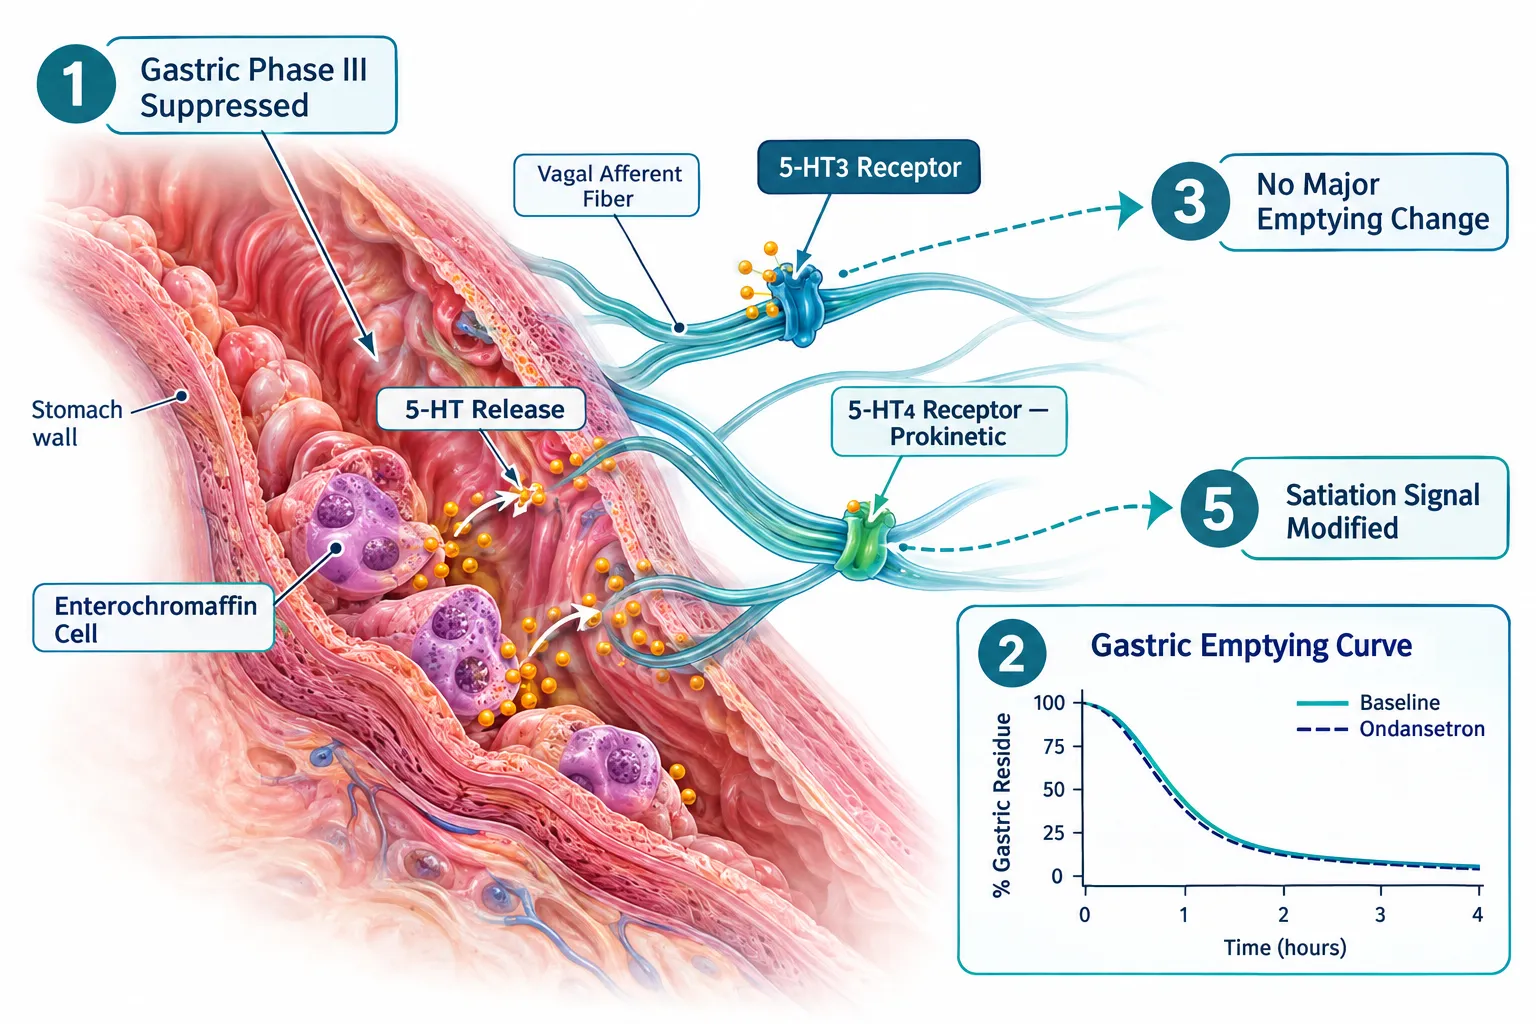
The gastrointestinal tract contains more serotonin (5-hydroxytryptamine, or 5-HT) than the entire brain. Enterochromaffin cells lining the gut wall release 5-HT in response to mechanical pressure, nutrients, and chemical signals. That serotonin then acts on multiple receptor subtypes, primarily 5-HT3 and 5-HT4, which have opposite effects on gastric motility.

5-HT4 agonists accelerate gastric emptying and are classified as prokinetics. 5-HT3 antagonists like ondansetron do something more nuanced: they suppress gastric phase III contractions of the migrating motor complex, shift intestinal motor activity, and alter satiation signaling, yet produce no significant change in overall gastric emptying time in controlled human studies.

This is the core of the "beyond nausea" story. The receptor selectivity of ondansetron separates nausea suppression from motility acceleration, and it separates satiation modulation from mechanical gastric changes. In a placebo-controlled trial, ondansetron increased the volume of liquid meal consumed at maximum satiation from roughly 784 mL to 907 mL, a statistically significant shift, without altering gastric compliance, basal tone, or fundic relaxation. The stomach was not mechanically different; the satiation signal arriving at the brain was.

"The receptor selectivity of ondansetron separates nausea suppression from motility acceleration, and satiation modulation from mechanical gastric change."

This endpoint separation matters for researchers designing peptide experiments. If a compound under study delays gastric emptying and suppresses intake, adding ondansetron can help isolate which effect is driven by 5-HT3-mediated vagal signaling versus direct mechanical slowing.


CCK Interactions and the Preclinical Case for Serotonin-Receptor Controls for Gastric Emptying, Intake, and GLP-Class Peptide Experiments

CCK Interactions and the Preclinical Case for Serotonin-Receptor Controls for Gastric Emptying, Intake, and GLP-Class Peptide

The clearest mechanistic evidence for ondansetron's "beyond nausea" role comes from cholecystokinin (CCK) research, not GLP-1 work. CCK is a gut peptide released after fat and protein ingestion; it suppresses feeding partly by slowing gastric emptying of solid meals. In rat models:

  • Ondansetron significantly attenuated CCK-induced reductions in food intake at 30 and 60 minutes post-administration.
  • It reversed CCK-induced inhibition of gastric emptying of both solid meals and nutrient loads.
  • A 5-HT3 agonist (m-chlorophenylbiguanide) reduced food intake on its own, while ondansetron blocked that effect.

These findings establish a mechanistic framework: when peptide-induced satiety is mediated through slowed gastric emptying and vagal 5-HT3 signaling, blocking 5-HT3 receptors can restore intake and motility simultaneously. The pathway runs through the vagus nerve, not through central appetite circuits directly.

What This Means for GLP-Class Peptide Research

GLP-1 receptor agonists present a related but distinct picture. Short-acting agents like exenatide and lixisenatide increase gastric emptying half-time by approximately 116 minutes in clinical settings, raising aspiration risk during anesthesia and causing persistent nausea in a subset of patients. A case report of semaglutide-induced gastroparesis documented severe nausea and delayed emptying; intravenous ondansetron 4 mg every six hours improved nausea and allowed semisolid diet tolerance, but did not correct the underlying gastric emptying delay.

This is a critical distinction. The GLP-1 receptor itself drives the motility disorder. Ondansetron addresses the 5-HT3-mediated nausea signal that accompanies it, not the root cause. Current clinical reviews and guidelines treat ondansetron as adjunctive symptom control in this context, with primary management focused on dose reduction or discontinuation of the GLP-1 agent.

For researchers exploring GLP-3 peptide signaling pathways or working with GLP-3R 30mg peptide in experimental settings, understanding this receptor-level separation is essential for clean endpoint interpretation.


Clinical Limits and Experimental Opportunities in Ondansetron Beyond Nausea Research

Clinical Limits and Experimental Opportunities in Ondansetron Beyond Nausea Research

The table below summarizes what ondansetron does and does not do across key physiological endpoints, based on current evidence:

Endpoint Human Clinical Evidence Preclinical (Animal) Evidence
Gastric emptying time No significant change Accelerates; reverses drug-induced delay
Gastric compliance/tone No significant change Not well characterized
Meal volume at satiation Increases significantly Increases (CCK model)
Phase III motor activity Suppressed Suppressed
GLP-1-induced nausea Reduced (symptom control) Not established
GLP-1-induced emptying delay Not corrected Not established

The translational gap is real. Rodent studies show that ondansetron can prevent thermogenic supplement-induced gastric emptying delays and normalize food intake increases, effects blocked by 5-HT3 pretreatment. These findings are compelling for experimental design but have not moved into routine clinical protocols for GLP-1-related dysmotility.

For investigators sourcing research-grade compounds, resources on lab tested peptides and guidance on where to buy peptides can support rigorous experimental setups. Those studying mitochondrial and metabolic peptide interactions may also find value in reviewing SS-31 peptide benefits and SS-31 peptide research options for complementary mechanistic work.

No high-quality clinical trials published through 2026 have directly tested ondansetron as a regulator of GLP-1 or incretin peptide physiology. Expert consensus keeps its role squarely in symptom management while directing mechanistic and therapeutic attention toward modifying GLP-1 exposure itself, through dose adjustment, agent selection, or timing, and using established prokinetics when motility correction is the actual goal.


Conclusion

The science of Ondansetron Beyond Nausea: Serotonin-Receptor Controls for Gastric Emptying, Intake, and GLP-Class Peptide Experiments is best understood through the lens of receptor selectivity and endpoint separation. Ondansetron reliably modifies satiation signaling and suppresses nausea through 5-HT3 blockade, but it does not function as a prokinetic in humans and does not reverse GLP-1-mediated gastric slowing at the receptor level.

Actionable next steps for researchers and clinicians:

  • Use ondansetron as a pharmacological tool to isolate 5-HT3-dependent components of peptide-induced satiety in preclinical models.
  • Do not substitute it for prokinetics when gastric emptying correction is the therapeutic target.
  • In GLP-1 agonist protocols, prioritize dose management for motility issues and reserve ondansetron for symptomatic nausea relief.
  • Monitor the translational literature: the CCK and thermogenic-supplement animal data suggest 5-HT3 pathways may have untapped roles in peptide-mediated intake regulation that future trials could clarify.
  • Consult a peptides specialist when designing multi-peptide protocols that involve gastric motility endpoints.

The receptor is selective. The endpoints are separable. That precision is the opportunity.
https://www.puretestedpeptides.com/wp-content/uploads/2026/10/ondansetron-beyond-nausea-serotonin-receptor-controls-for-gastric-emptying-intak.webp 1024 1536 https://www.puretestedpeptides.com/wp-content/uploads/2026/01/buy-peptides-online.jpg 2026-10-13 13:05:032026-10-13 13:05:03Ondansetron Beyond Nausea: Serotonin-Receptor Controls for Gastric Emptying, Intake, and GLP-Class Peptide Experiments
Famotidine Versus Omeprazole in Intestinal Peptide Models: H2-Blocker and Proton-Pump Inhibitor Controls

Famotidine Versus Omeprazole in Intestinal Peptide Models: H2-Blocker and Proton-Pump Inhibitor Controls

October 13, 2026/0 Comments/in Uncategorized/by

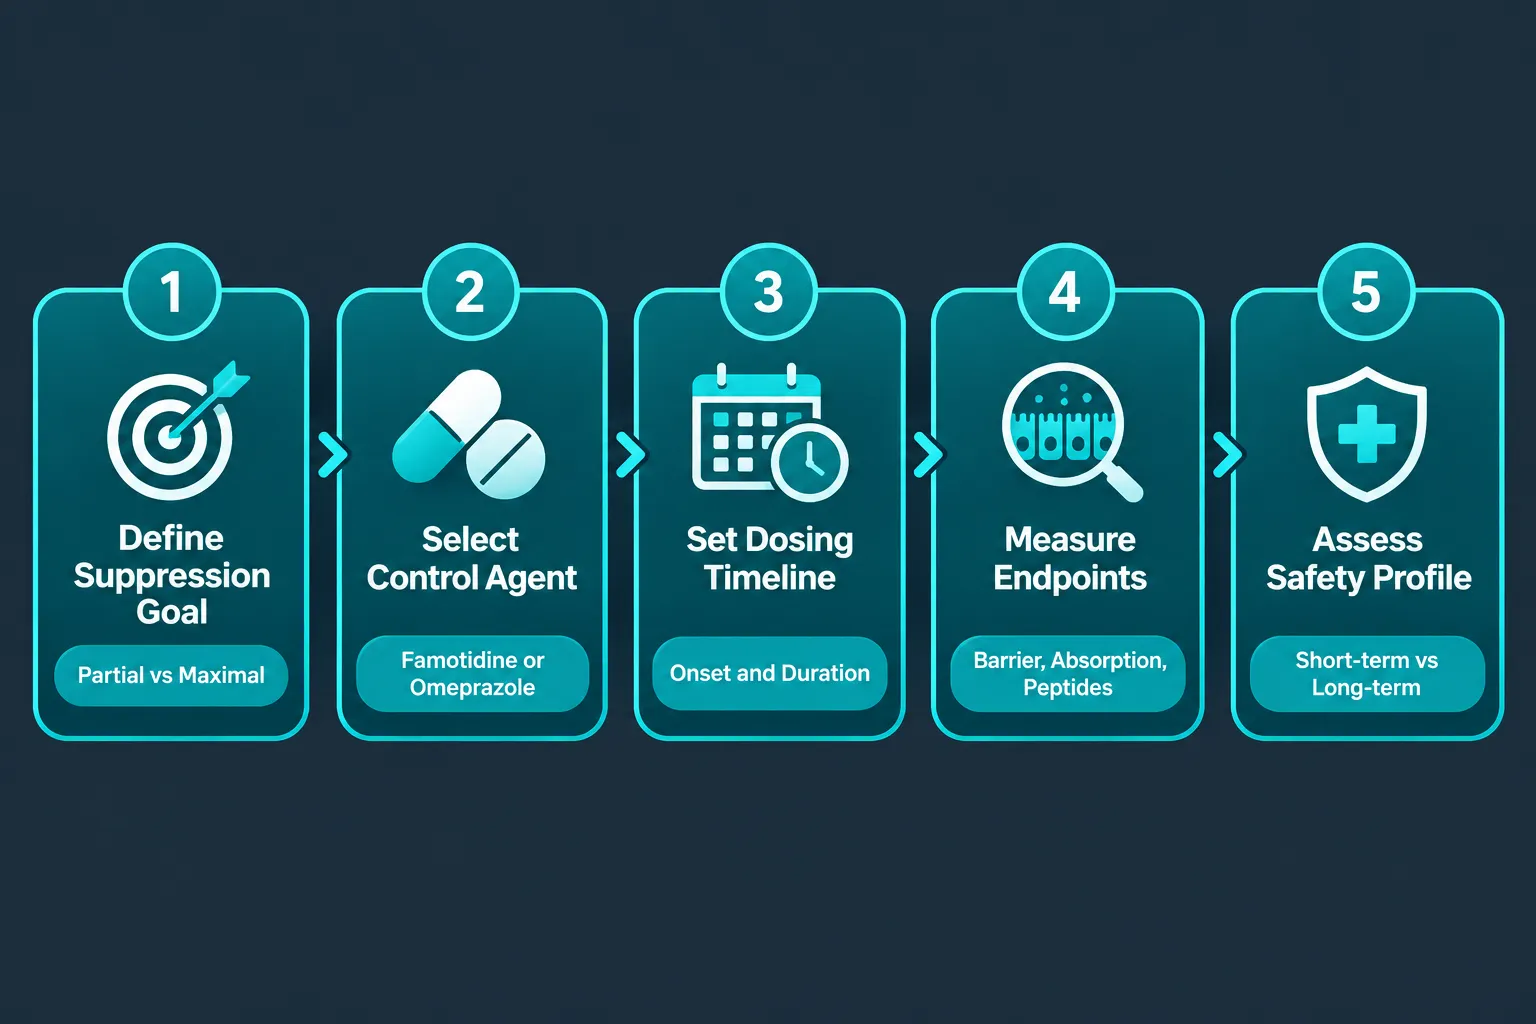
Acid-suppressing drugs rank among the most prescribed medications worldwide, yet the choice between an H2-receptor antagonist and a proton-pump inhibitor carries consequences that extend far beyond heartburn relief. When researchers design intestinal peptide models, systems built to study how gut hormones, barrier function, and nutrient absorption respond to pharmacologic intervention, the selection of a control drug is not a minor detail. It shapes every downstream readout. Famotidine versus omeprazole in intestinal peptide models represents a fundamental methodological decision, one that determines whether an experiment captures partial or maximal acid suppression, short-burst or sustained pH shifts, and modest or profound changes to the intestinal microenvironment.

Key Takeaways

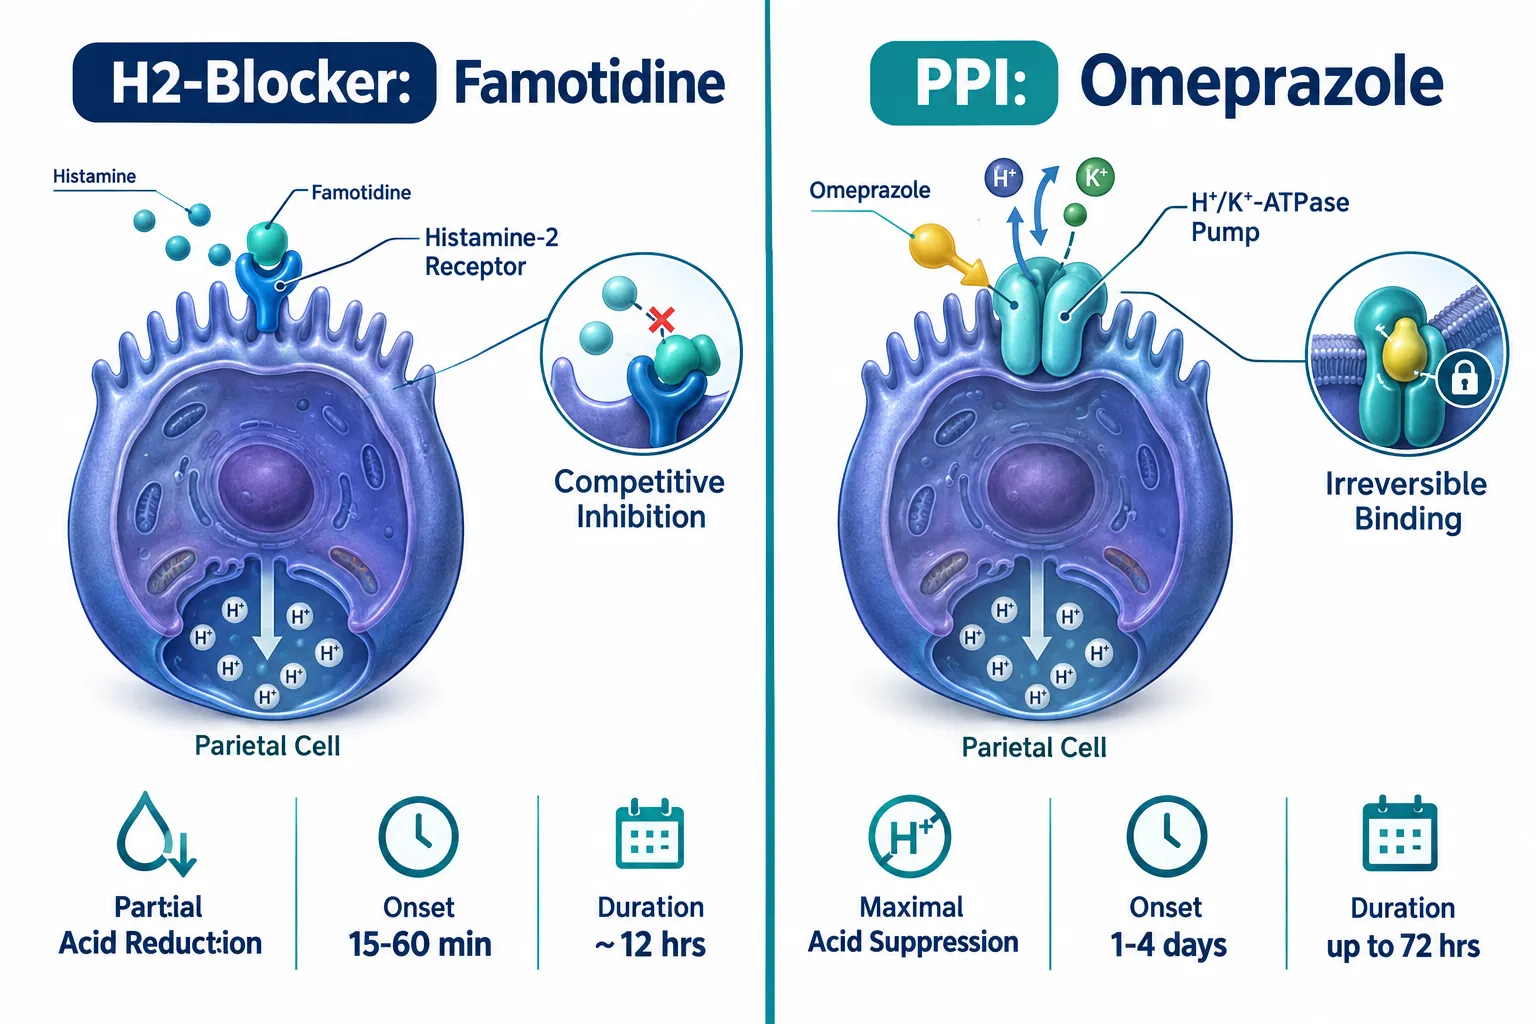
  • Famotidine (H2-blocker) competitively inhibits histamine-2 receptors for partial, shorter-duration acid suppression; omeprazole (PPI) irreversibly inactivates the gastric proton pump for deeper, longer-lasting suppression.
  • Onset and duration differ substantially: famotidine acts within 15-60 minutes with relief lasting roughly 12 hours, while omeprazole may take 1-4 days to reach full effect but sustains suppression for up to 72 hours.
  • In intestinal peptide models, these pharmacodynamic differences translate into distinct effects on mucosal barrier integrity, nutrient absorption, and inflammatory marker levels.
  • Long-term PPI use carries a broader systemic side-effect burden, including risks of bone loss, hypomagnesemia, and altered gut microbiota, which must be factored into experimental design.
  • Famotidine and omeprazole are best treated as complementary comparators, partial versus maximal suppression controls, rather than interchangeable agents in research protocols.

Mechanisms of Action: How Each Drug Suppresses Acid

Understanding famotidine versus omeprazole in intestinal peptide models begins with their distinct molecular targets.

Mechanisms of Action: How Each Drug Suppresses Acid

Famotidine works by competitively and reversibly binding histamine-2 receptors on gastric parietal cells. Because histamine is only one of three stimuli that drive acid secretion (alongside gastrin and acetylcholine), blocking its receptor produces partial suppression. Gastric juice volume falls, and basal acid output drops meaningfully, but the proton pump itself remains fully functional. This partial suppression profile makes famotidine a useful "low-ceiling" control in models where researchers need to observe how moderate pH elevation, without complete acid abolition, affects intestinal peptide release or mucosal signaling.

Omeprazole, by contrast, is a prodrug that is activated in the acidic secretory canaliculi of parietal cells. Once activated, it forms a covalent, irreversible bond with the H+/K+-ATPase proton pump, blocking the final step of acid secretion regardless of which upstream stimulus triggered it. The result is near-complete acid suppression that persists until new pump proteins are synthesized, a process taking one to three days. This makes omeprazole the reference standard for "maximal suppression" controls in experimental gastrointestinal frameworks.

Key distinction: Famotidine modulates acid; omeprazole abolishes it. That difference is the methodological fulcrum in any controlled intestinal study.


Onset, Duration, and Dosing Implications in Research Models

The pharmacokinetic profiles of these two drug classes are as important as their mechanisms when designing controlled experiments.

Parameter Famotidine (H2-Blocker) Omeprazole (PPI)
Onset of action 15-60 minutes 1-4 days (full effect)
Duration of effect Up to ~12 hours Up to 72 hours
Dosing frequency Typically twice daily Once daily
Acid suppression depth Partial Near-complete
Reversibility Reversible Irreversible (until pump renewal)

These differences carry direct consequences for intestinal peptide models. A model examining acute postprandial GLP-related signaling, such as those explored in research on GLP-3 peptide signaling pathways, requires precise control over the luminal pH environment at specific time points. Famotidine's rapid onset makes it suitable for acute-phase protocols. Omeprazole's sustained suppression is better suited to chronic-exposure or multi-day washout designs.

Researchers exploring intestinal peptide models and controlled experimental frameworks must account for the lag phase inherent in PPI therapy. Enrolling subjects or initiating measurements before omeprazole reaches steady-state suppression introduces confounding variables that can distort peptide-level readouts.


Effects on Intestinal Barrier, Absorption, and Microbiome Readouts

The choice of control drug in famotidine versus omeprazole in intestinal peptide models affects three major downstream systems: the mucosal barrier, nutrient absorption, and the gut microbiome.

Effects on Intestinal Barrier, Absorption, and Microbiome Readouts

Intestinal Barrier and Mucosal Integrity

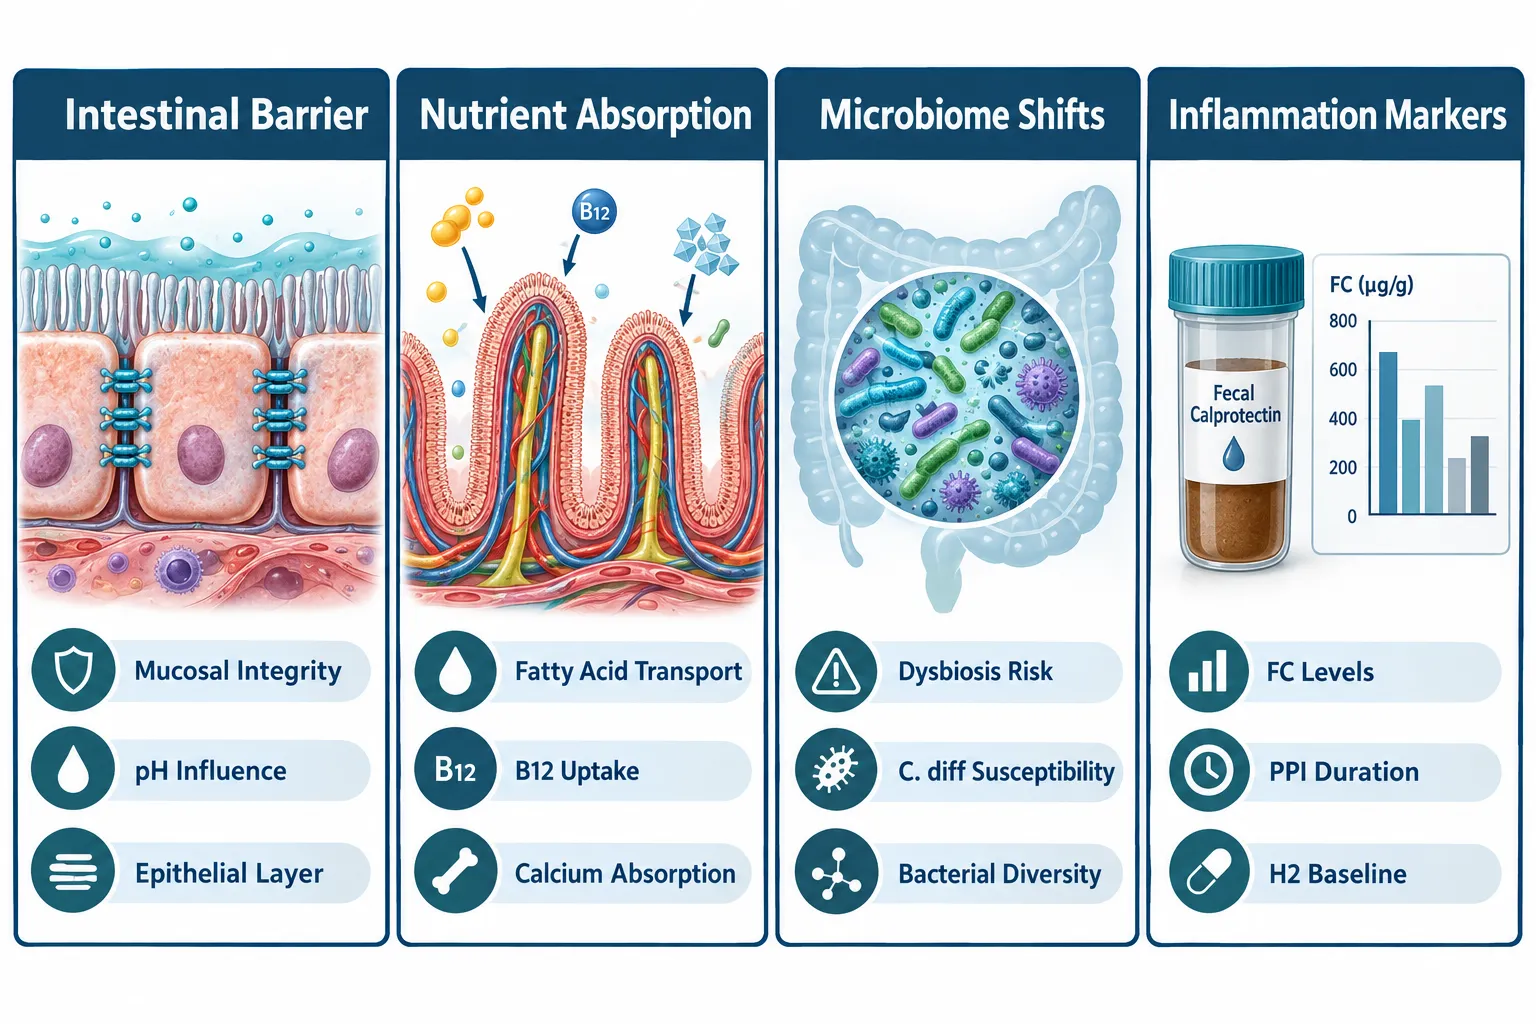
PPIs are more effective than H2-blockers at preventing stress-related mucosal erosions, upper GI bleeding, and peptic ulcer disease. In critically ill patients and chronic NSAID users, omeprazole consistently outperforms famotidine in healing esophageal and gastric mucosa. A clinical trial of reflux esophagitis patients found omeprazole achieved a 75.4% symptom improvement rate at week four, compared with 41.5% for famotidine at week two. For models using mucosal integrity as a primary endpoint, omeprazole provides a more robust protective baseline.

Nutrient Absorption

Long-term PPI use introduces measurable changes to intestinal absorption. In cystic fibrosis patients, omeprazole therapy was associated with decreased plasma heptadecanoic acid absorption in 78% of subjects completing a mixed triglyceride breath test, suggesting that sustained acid suppression alters intestinal fatty acid uptake. PPIs have also been linked to reduced absorption of calcium, magnesium, and vitamin B12, all relevant variables in any model tracking nutrient-transport peptides. Famotidine, with its partial suppression profile, produces fewer documented absorption disturbances, making it a cleaner baseline for nutrient-focused protocols.

For researchers studying peptides involved in metabolic signaling, including those available as GLP-3 peptide for sale for research purposes, the absorption environment established by the control drug will influence how gut hormones respond to luminal nutrients.

Microbiome and Inflammatory Markers

Omeprazole's prolonged acid suppression raises luminal pH, which alters the composition of the gut microbiome and increases susceptibility to Clostridioides difficile overgrowth. Research tracking fecal calprotectin (FC), a validated marker of intestinal inflammation, in NSAID and PPI users found a statistically significant negative correlation between duration of PPI use and FC levels (Spearman rs = -0.270, p = 0.002). This suggests that PPI exposure progressively modulates intestinal inflammatory tone, creating a shifting baseline that must be controlled for in longitudinal peptide studies.

Famotidine does not carry the same magnitude of microbiome disruption risk, which is one reason it remains a preferred comparator in short-term or microbiome-sensitive experimental designs. Researchers working with SS-31 peptide research models or other mitochondria-targeted peptides that intersect with oxidative stress and gut inflammation should account for these microbiome-level differences when selecting a control agent.


Safety Profiles and Long-Term Experimental Considerations

Safety data directly informs how long each drug can serve as a control without introducing its own confounding effects.

Safety Profiles and Long-Term Experimental Considerations

Famotidine's side-effect profile is generally mild and transient. Headache, dizziness, and minor gastrointestinal symptoms are the most commonly reported events. Rare but serious adverse effects, including blood count changes, liver enzyme elevations, and CNS effects, occur mainly in older adults or individuals with renal impairment. For most short-to-medium-term intestinal models, famotidine presents a low systemic burden.

Omeprazole's long-term safety profile is more complex. Sustained PPI use is associated with:

  • Bone fractures due to impaired calcium absorption
  • Hypomagnesemia, which can affect smooth muscle and nerve function in the gut
  • Chronic kidney injury with prolonged exposure
  • Vitamin B12 deficiency, relevant in neurological and metabolic peptide models
  • Elevated C. difficile risk, a critical confound in microbiome studies

These risks do not disqualify omeprazole as a control agent, but they impose time limits and monitoring requirements on any protocol using it as a long-term comparator.

One additional practical constraint: combining omeprazole with famotidine is generally discouraged in clinical and research settings because H2-blockers can interfere with PPI activation, reducing the PPI's efficacy. This means the two drugs function best as alternative controls, representing different points on the acid-suppression spectrum, rather than as concurrent interventions.

For researchers sourcing research-grade compounds, understanding how control drugs interact with experimental peptides is essential. A foundational overview is available in this peptides 101 guide for research-use buyers, which covers structure, mechanisms, and experimental positioning.


Conclusion

Famotidine versus omeprazole in intestinal peptide models is not a question with a single correct answer, it is a design decision that must align with the specific hypothesis being tested. Famotidine offers rapid onset, partial suppression, a favorable short-term safety profile, and minimal disruption to absorption and microbiome baselines, making it the preferred "partial suppression" comparator. Omeprazole delivers near-complete, sustained acid abolition and superior mucosal protection, making it the standard "maximal suppression" control for chronic-exposure and barrier-integrity protocols.

Actionable next steps for researchers:

  1. Define the suppression depth required by the model before selecting a control drug.
  2. Account for omeprazole's 1-4 day onset lag in any time-sensitive protocol.
  3. Monitor absorption markers (B12, magnesium, fatty acids) in long-term PPI-controlled studies.
  4. Treat famotidine and omeprazole as distinct points on the acid-suppression continuum, not interchangeable agents.
  5. Review how the chosen control drug may interact with the specific intestinal peptide being studied, particularly for GLP-family, nutrient-transport, or inflammation-related peptides.

Researchers seeking to explore what the strongest peptides for weight loss and metabolic research look like in controlled GI environments will find that the acid-suppression baseline established by the control drug is as consequential as the peptide itself.

https://www.puretestedpeptides.com/wp-content/uploads/2026/10/famotidine-versus-omeprazole-in-intestinal-peptide-models-h2-blocker-and-proton.webp 1024 1536 https://www.puretestedpeptides.com/wp-content/uploads/2026/01/buy-peptides-online.jpg 2026-10-13 13:04:362026-10-13 13:04:36Famotidine Versus Omeprazole in Intestinal Peptide Models: H2-Blocker and Proton-Pump Inhibitor Controls
Spironolactone and Peptide Metabolism Studies: Aldosterone, Potassium, Fluid Volume, and Hormonal Readouts

Spironolactone and Peptide Metabolism Studies: Aldosterone, Potassium, Fluid Volume, and Hormonal Readouts

October 13, 2026/0 Comments/in Uncategorized/by

}

Professional () hero image with 'Spironolactone and Peptide Metabolism' in crisp white on a deep navy semi-transparent

Fewer drug mechanisms have remained as consistently relevant to endocrine research as aldosterone antagonism, and yet, as 2026 proteomic studies reveal, the downstream effects of spironolactone extend well beyond simple electrolyte shifts. Researchers designing peptide metabolism studies increasingly encounter spironolactone and peptide metabolism studies: aldosterone, potassium, fluid volume, and hormonal readouts as a methodological framework that demands careful interpretation of multiple, often interdependent biomarkers.

Key Takeaways

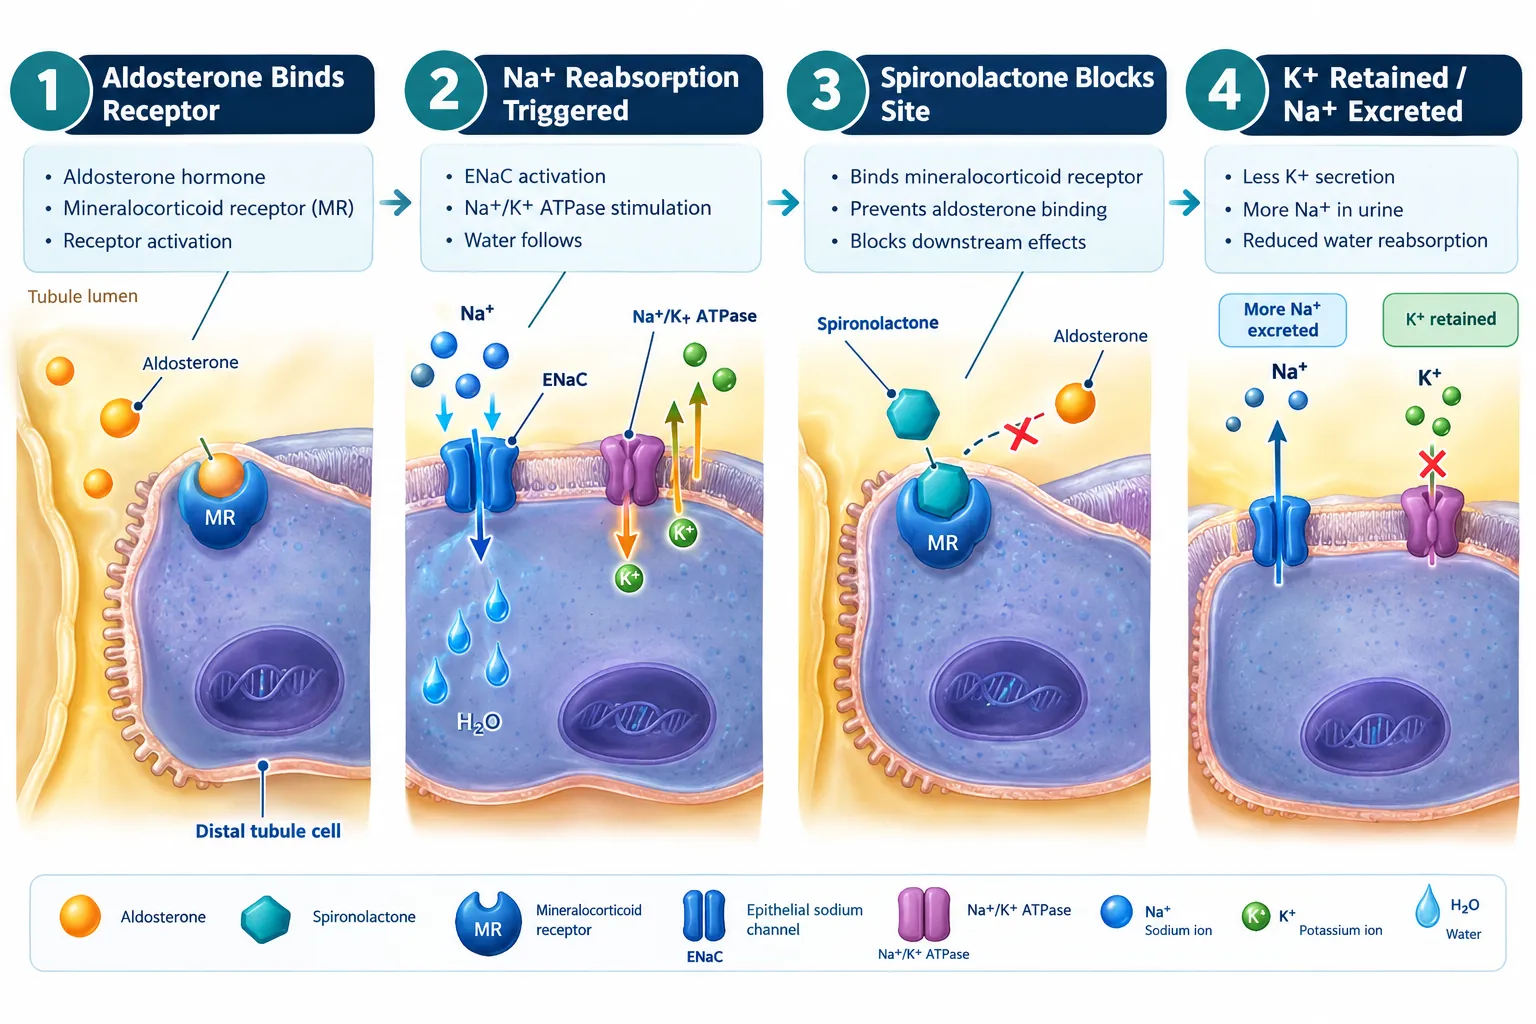
  • Spironolactone blocks aldosterone at the distal renal tubule, driving sodium and water excretion while retaining potassium.
  • Fluid volume reduction is a core, measurable outcome in both clinical and preclinical peptide models.
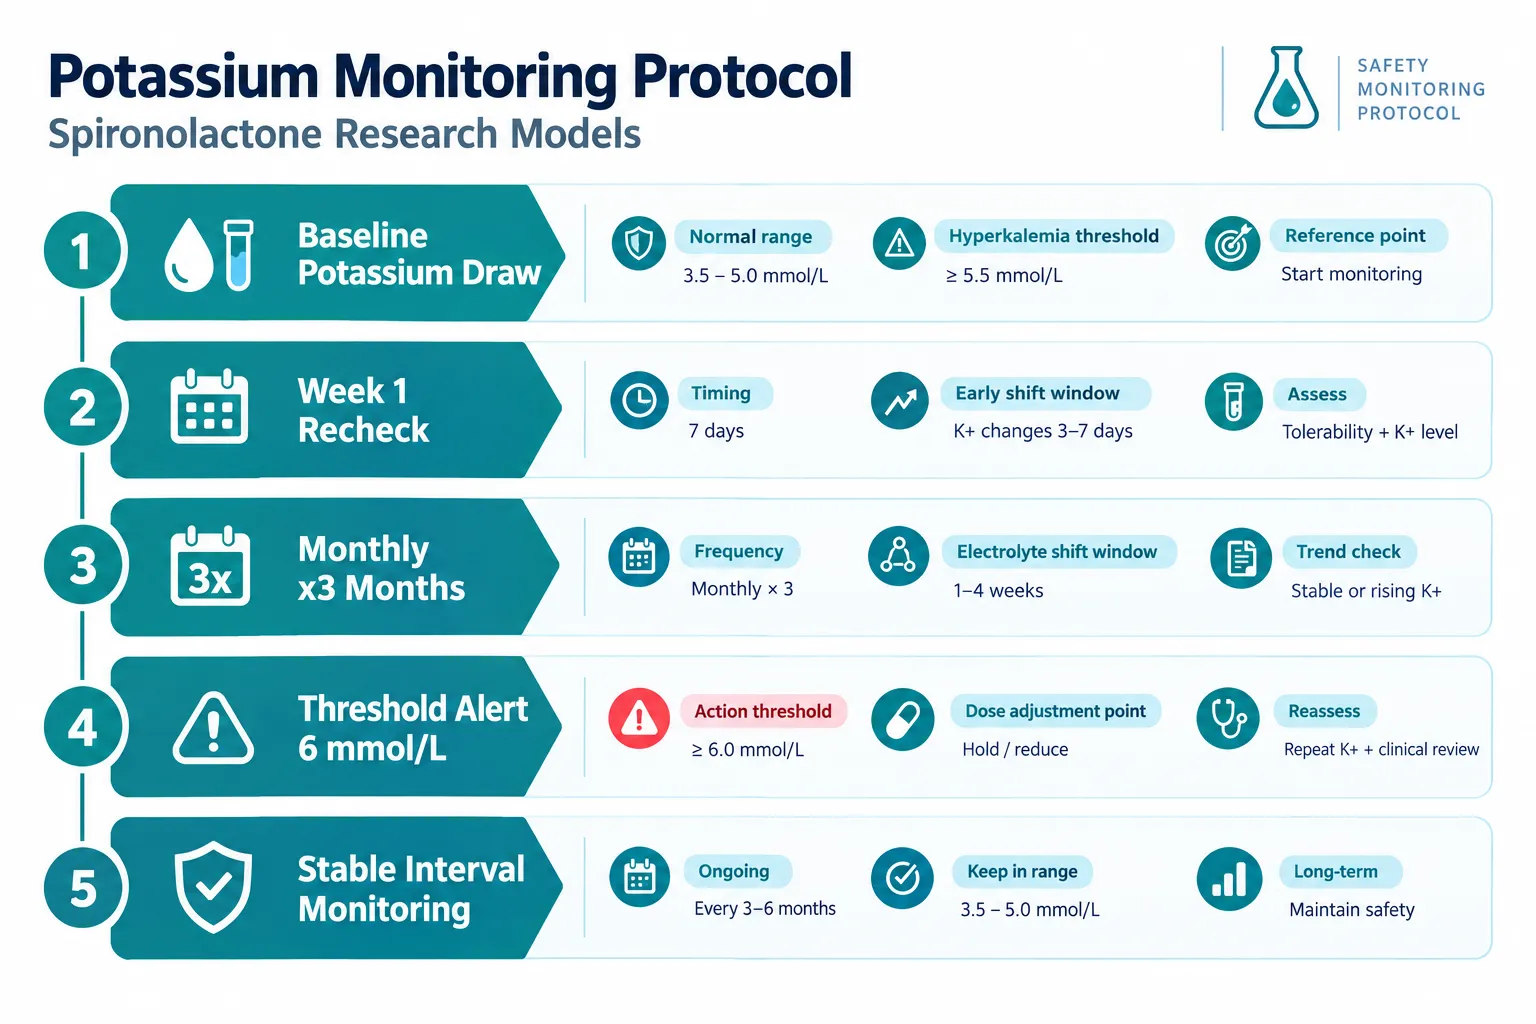
  • Potassium monitoring thresholds (stop/seek advice at greater than 6 mmol/L) remain a critical safety parameter in research protocols.
  • 2026 biomarker studies show spironolactone affects hormonal markers such as PICP, GAL9, THBS2, and REN, independent of classic electrolyte changes.
  • Interpreting hormonal readouts in peptide experiments requires distinguishing direct aldosterone-antagonist effects from broader RAAS-mediated signaling.

Mineralocorticoid Receptor Antagonism: The Mechanistic Foundation

Spironolactone acts as a specific antagonist of aldosterone at the aldosterone-dependent sodium-potassium exchange site in the distal renal tubule. When aldosterone is blocked, the tubule excretes more sodium and water while retaining potassium. This mechanism, unchanged in the most current U.S. product labeling as of August 2026, forms the backbone of every study design that incorporates this compound.

Mineralocorticoid Receptor Antagonism: The Mechanistic Foundation

For researchers working with peptide models, this baseline pharmacology matters for three reasons:

  • Fluid volume decreases predictably, which affects peptide distribution and concentration in biological fluids.
  • Potassium retention alters the electrochemical environment of cells, potentially influencing receptor-ligand interactions.
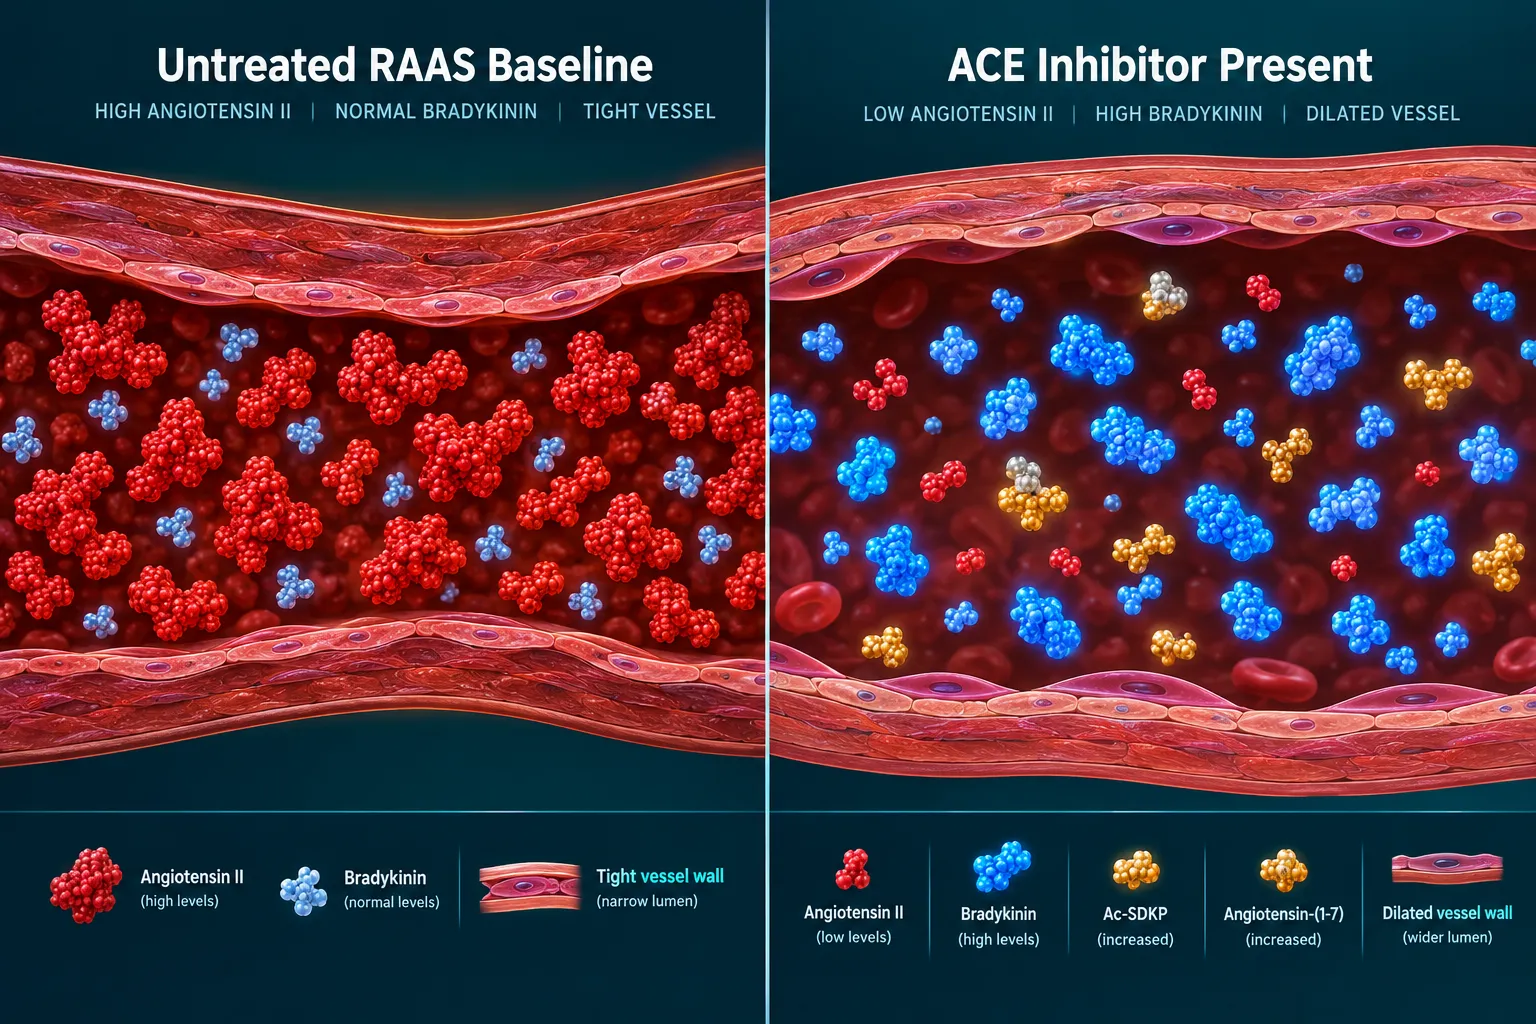
  • Aldosterone suppression disrupts the renin-angiotensin-aldosterone system (RAAS), creating secondary hormonal shifts that can confound peptide readouts.

Hyperaldosteronism, a state of excess aldosterone driving sodium retention and potassium wasting, remains one of the primary endocrine indications for spironolactone. In research models mimicking this condition, baseline aldosterone levels must be documented before interpreting any downstream peptide or hormonal data.

Researchers studying mitochondria-targeted compounds such as SS-31 peptide should note that cellular potassium gradients, altered by spironolactone's mechanism, can influence mitochondrial membrane potential measurements.


Potassium, Fluid Volume, and Electrolyte Readouts in Peptide Experiments

Because spironolactone is classified as a potassium-sparing diuretic, potassium monitoring is non-negotiable in any study protocol. Current NHS Specialist Pharmacy Service guidance updated in 2026 recommends potassium checks after one week of initiation, then monthly for three months, then at reduced frequency once values stabilize. A potassium level exceeding 6 mmol/L triggers a stop/seek-advice threshold, a figure that serves as a practical upper boundary in research safety monitoring as well.

Potassium, Fluid Volume, and Electrolyte Readouts in Peptide Experiments

Fluid volume changes are equally measurable and clinically meaningful. Spironolactone's natriuretic and diuretic effects reduce edema in heart failure, cirrhosis, and kidney disease models. In peptide metabolism studies, this volume reduction has direct consequences:

Parameter Expected Direction Research Implication
Serum sodium Decrease Affects peptide solubility and distribution
Serum potassium Increase Alters membrane electrochemistry
Body weight Decrease Reflects fluid loss, not tissue change
Blood pressure Decrease Confounds cardiovascular peptide endpoints

A 2026 NIH-hosted analysis in heart-failure-risk subjects found that after one month of spironolactone treatment, weight, serum sodium, and blood pressure all decreased, consistent with natriuresis and diuresis. These variables must be controlled or co-reported when interpreting peptide concentration data.

For studies involving GLP-1 peptides or metabolic signaling agents, fluid volume shifts can directly alter the apparent pharmacokinetics of co-administered peptides, making careful baseline fluid assessment essential.


Hormonal Readouts Beyond Electrolytes: What 2026 Studies Reveal

The most significant methodological development in spironolactone and peptide metabolism studies: aldosterone, potassium, fluid volume, and hormonal readouts is the growing recognition that spironolactone's effects extend into proteomic and hormonal territory far beyond simple electrolyte management.

Hormonal Readouts Beyond Electrolytes: What 2026 Studies Reveal

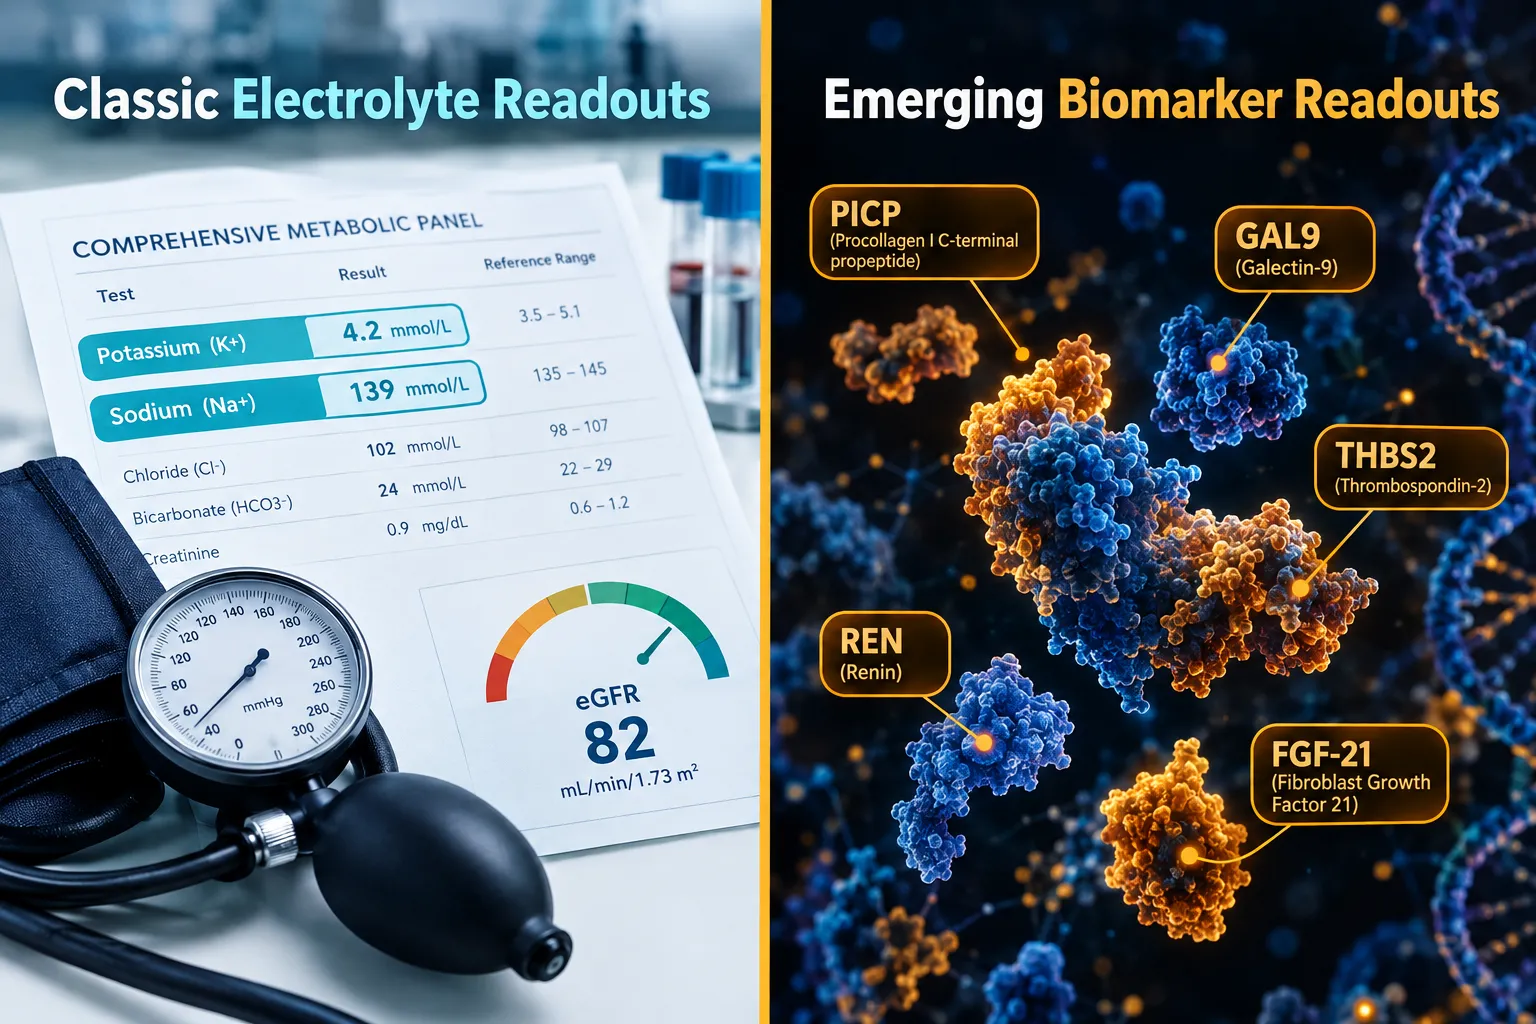
A 2026 NIH-published analysis in heart-failure-risk patients found that spironolactone reduced serum procollagen Type I C-terminal propeptide (PICP), a marker of cardiac fibrosis. Critically, the analysis implicated mediators including GAL9, THBS2, and REN, none of which are classic electrolyte markers. Changes in blood pressure, sodium, potassium, or eGFR were not the strongest variables associated with PICP shifts. This means that some hormonal and biomarker readouts in peptide studies are only partly explained by the drug's diuretic mechanism.

"Hormonal readouts in spironolactone-treated models reflect RAAS modulation at multiple levels, not just the aldosterone-potassium axis."

Separately, a 2026 veterinary proteomic study using combined angiotensin and spironolactone treatment reported changes in FGF-21, a metabolic signaling protein, pointing to downstream metabolic readouts tied to RAAS modulation. Researchers using lab-tested peptides in RAAS-modulated models should account for these off-target hormonal signals when designing assay panels.

For studies incorporating GLP-3 peptide formulations or other metabolic peptides, the FGF-21 signal is particularly relevant because it intersects with energy metabolism pathways that spironolactone indirectly modulates through RAAS suppression.

Researchers should also consider the SS-31 peptide benefits in oxidative stress contexts, since potassium retention and altered mitochondrial membrane potential may interact with mitochondria-targeted peptide activity in co-treatment models.

Three practical rules for interpreting hormonal readouts:

  1. Always separate electrolyte-driven changes from RAAS-mediated proteomic changes in your analysis plan.
  2. Include PICP, GAL9, or REN measurements if cardiac or fibrotic endpoints are relevant to your peptide model.
  3. Report fluid volume and weight changes alongside hormonal data to allow readers to distinguish diuretic from endocrine effects.

Conclusion

Designing rigorous spironolactone and peptide metabolism studies: aldosterone, potassium, fluid volume, and hormonal readouts requires more than tracking potassium levels. The 2026 research landscape makes clear that spironolactone modulates a layered hormonal environment, one where PICP, GAL9, THBS2, REN, and FGF-21 can shift independently of classic electrolyte markers.

Actionable next steps for researchers:

  • Establish potassium and sodium baselines before any spironolactone co-treatment protocol.
  • Apply the 6 mmol/L potassium threshold as a safety ceiling in preclinical models where applicable.
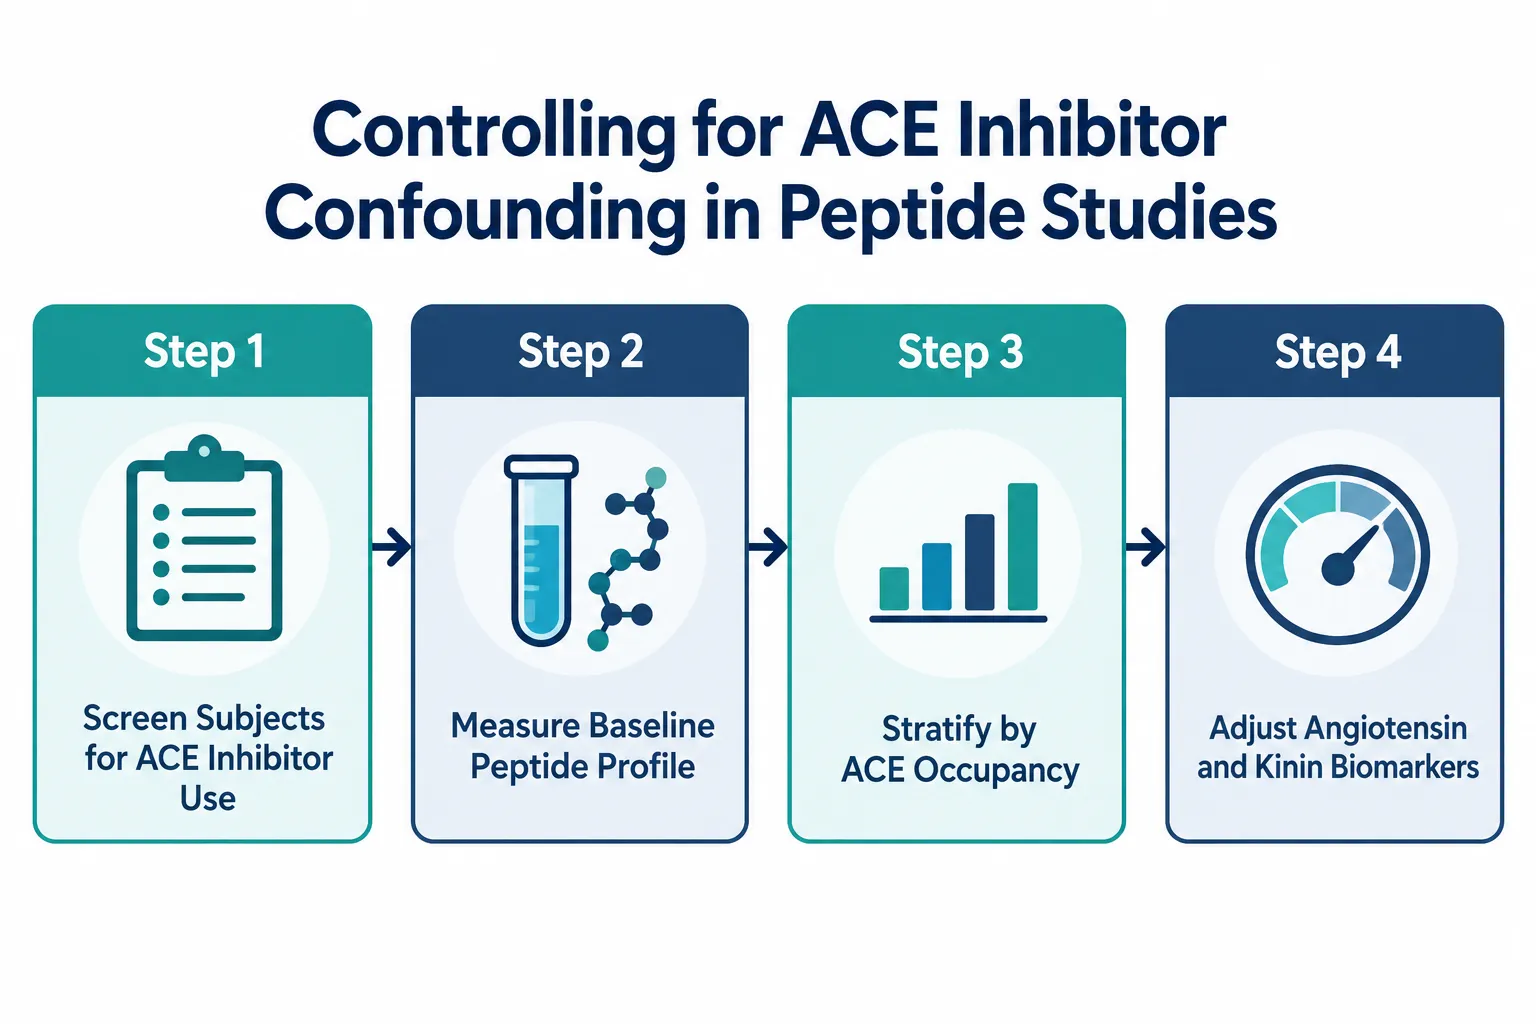
  • Expand hormonal assay panels beyond electrolytes to include RAAS-related biomarkers.
  • Control for fluid volume and weight changes when reporting peptide pharmacokinetic data.
  • Review the latest SS-31 10mg research peptide considerations when designing mitochondria-targeted co-treatment studies with mineralocorticoid antagonists.

Understanding the full scope of spironolactone's hormonal footprint is no longer optional for peptide researchers, it is a prerequisite for producing interpretable, reproducible results.

https://www.puretestedpeptides.com/wp-content/uploads/2026/10/spironolactone-and-peptide-metabolism-studies-aldosterone-potassium-fluid-volume.webp 1024 1536 https://www.puretestedpeptides.com/wp-content/uploads/2026/01/buy-peptides-online.jpg 2026-10-13 13:03:522026-10-13 13:03:52Spironolactone and Peptide Metabolism Studies: Aldosterone, Potassium, Fluid Volume, and Hormonal Readouts
Retatrutide Phase 3 Diabetes Results: How Researchers Should Interpret Dose, A1C, Weight, and Discontinuation Data

Retatrutide Phase 3 Diabetes Results: How Researchers Should Interpret Dose, A1C, Weight, and Discontinuation Data

October 12, 2026/0 Comments/in Uncategorized/by

Fewer than 1 in 10 glucose-lowering drugs tested in Phase 2 trials ever produce weight loss exceeding 15% of body weight in people with type 2 diabetes. Retatrutide, a triple GIP/GLP-1/glucagon receptor agonist, has now done exactly that across two large Phase 3 programs, making the Retatrutide Phase 3 Diabetes Results: How Researchers Should Interpret Dose, A1C, Weight, and Discontinuation Data question one of the most important analytical tasks in metabolic research in 2026.

This guide is written for researchers, clinicians, and evidence reviewers who need a structured framework for reading the trial data accurately, not as a clinical recommendation or treatment guide.


Key Takeaways

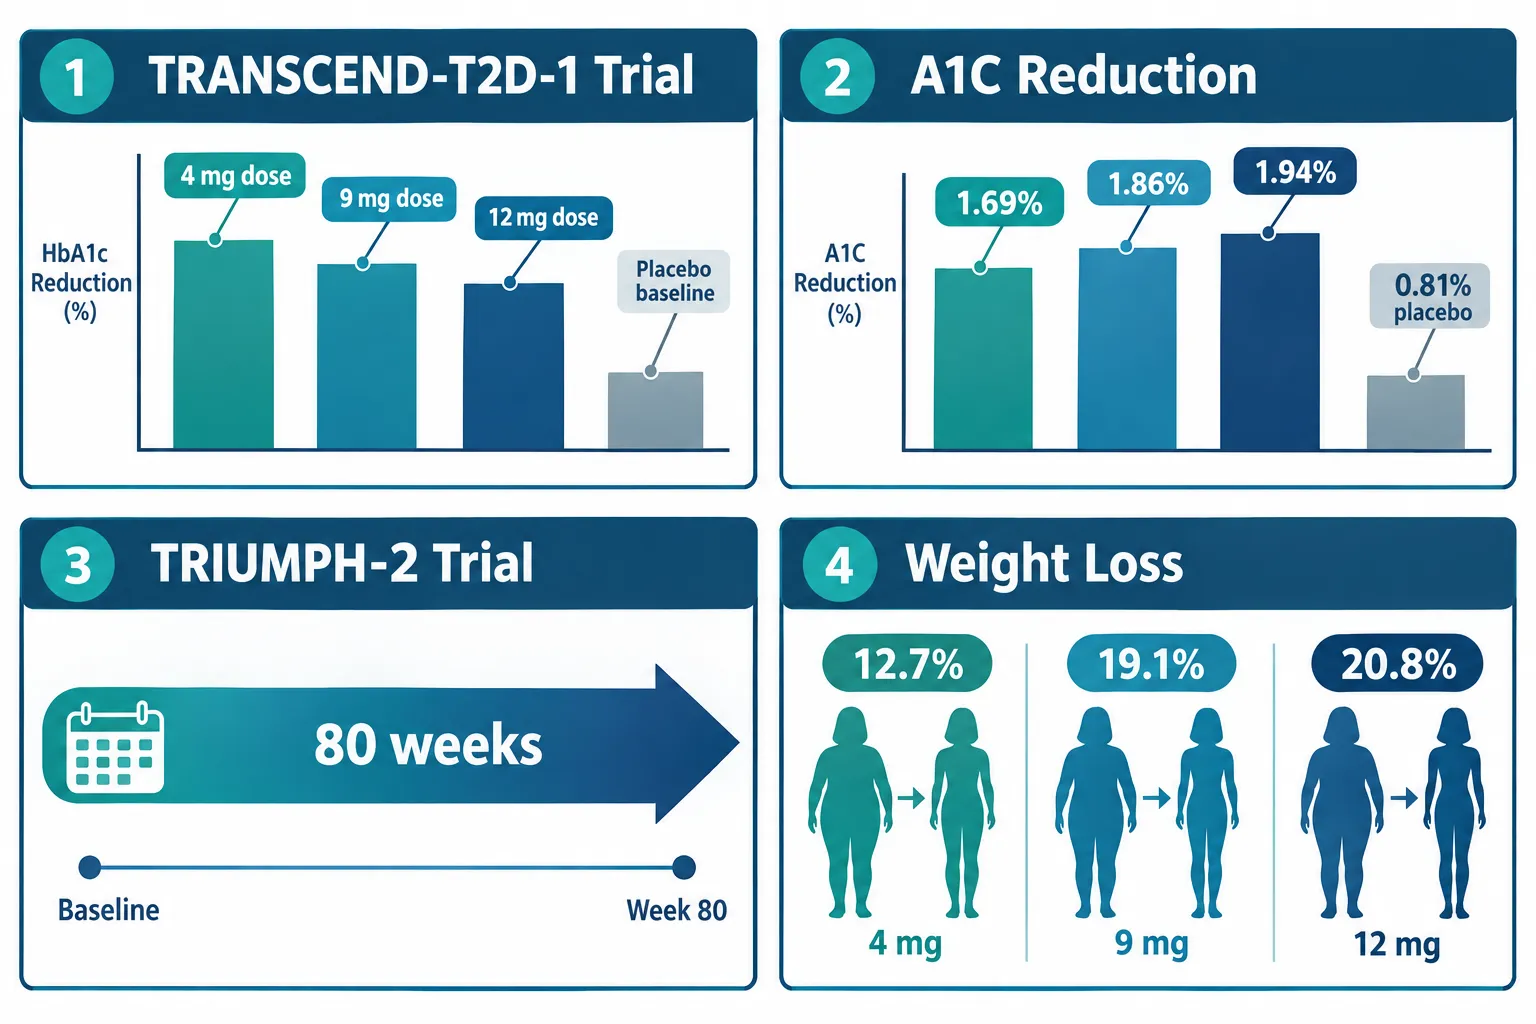
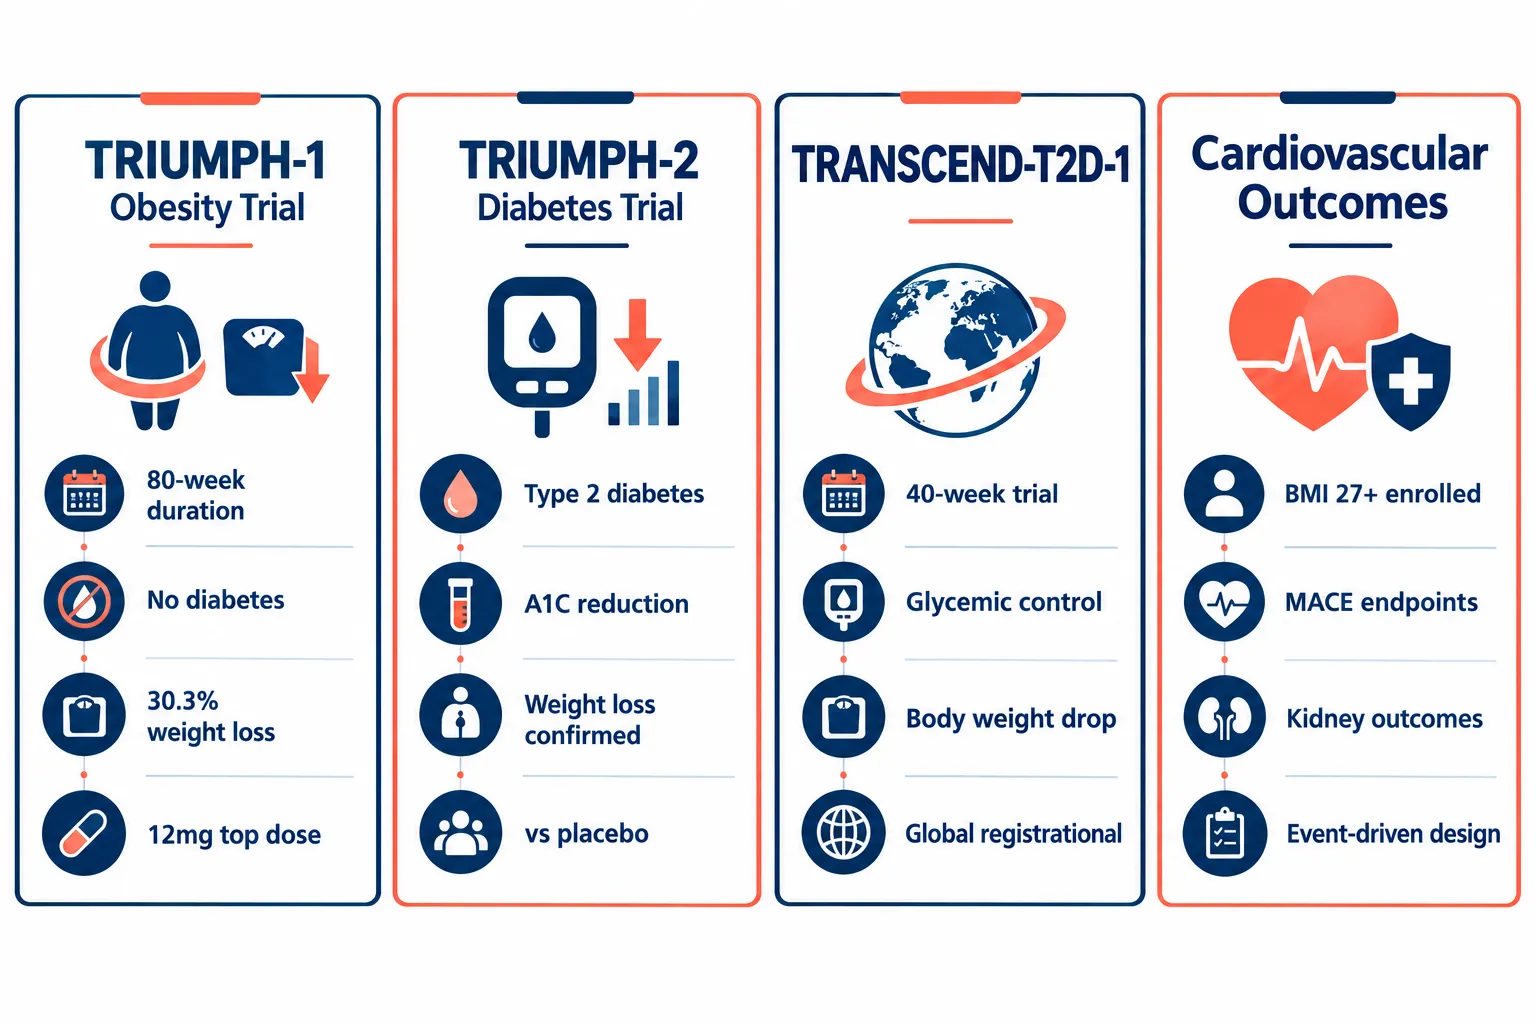
  • Two Phase 3 trials, TRANSCEND-T2D-1 and TRIUMPH-2, provide the core evidence base for retatrutide in type 2 diabetes.
  • A1C reductions showed a clear dose-response pattern, roughly doubling the effect of placebo at the highest dose.
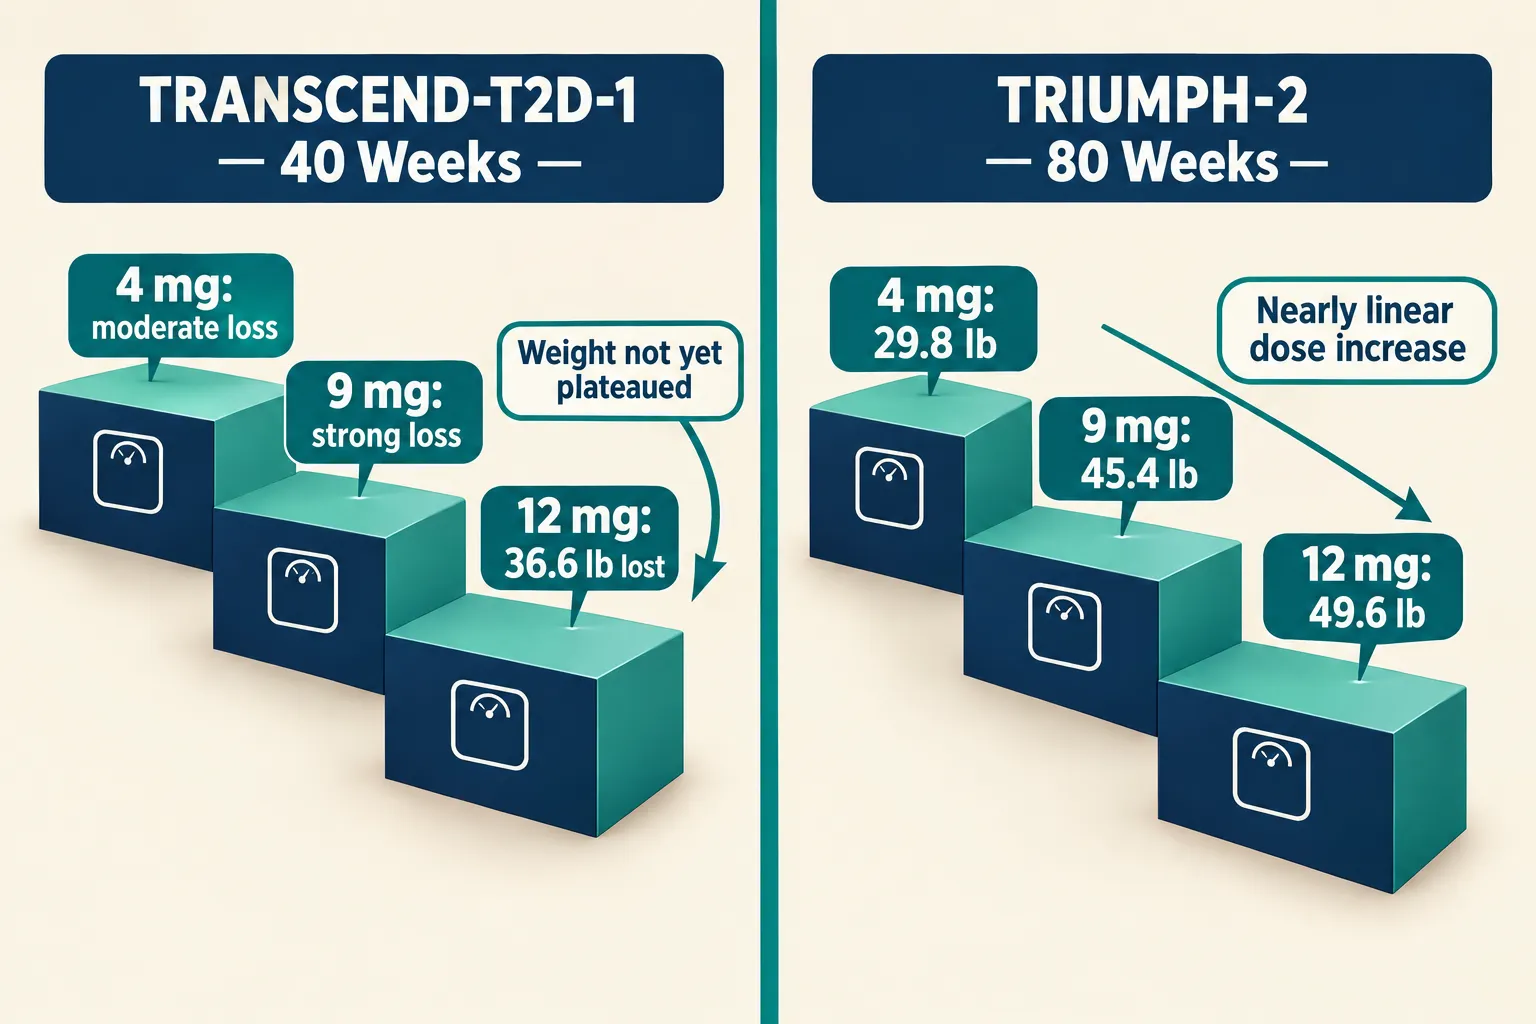
  • Weight loss was substantial and, in the 40-week trial, had not yet plateaued at study end.
  • Discontinuation due to adverse events was dose-dependent and driven primarily by gastrointestinal symptoms.
  • Tolerability, not efficacy, is likely to determine real-world dose selection and patient retention.

Understanding the Two Core Phase 3 Trials

Before analyzing any endpoint, researchers must distinguish between the two trials, because they enrolled different populations and ran for different durations.

TRANSCEND-T2D-1 enrolled 537 adults with recent-onset type 2 diabetes, A1C between 7.0% and 9.5%, and BMI of 23 or higher. Participants received retatrutide monotherapy at 4, 9, or 12 mg once weekly for 40 weeks, with no background glucose-lowering medications. This design isolates the drug's intrinsic glycemic effect.

TRIUMPH-2 enrolled adults with established type 2 diabetes plus obesity or overweight and ran for 80 weeks. This longer trial captures durability and applies to a more complex metabolic phenotype seen frequently in clinical practice.

Conflating results from these two trials is one of the most common analytical errors. Baseline disease severity, background therapy status, and trial duration all affect the magnitude of observed A1C and weight outcomes.

Understanding the Two Core Phase 3 Trials

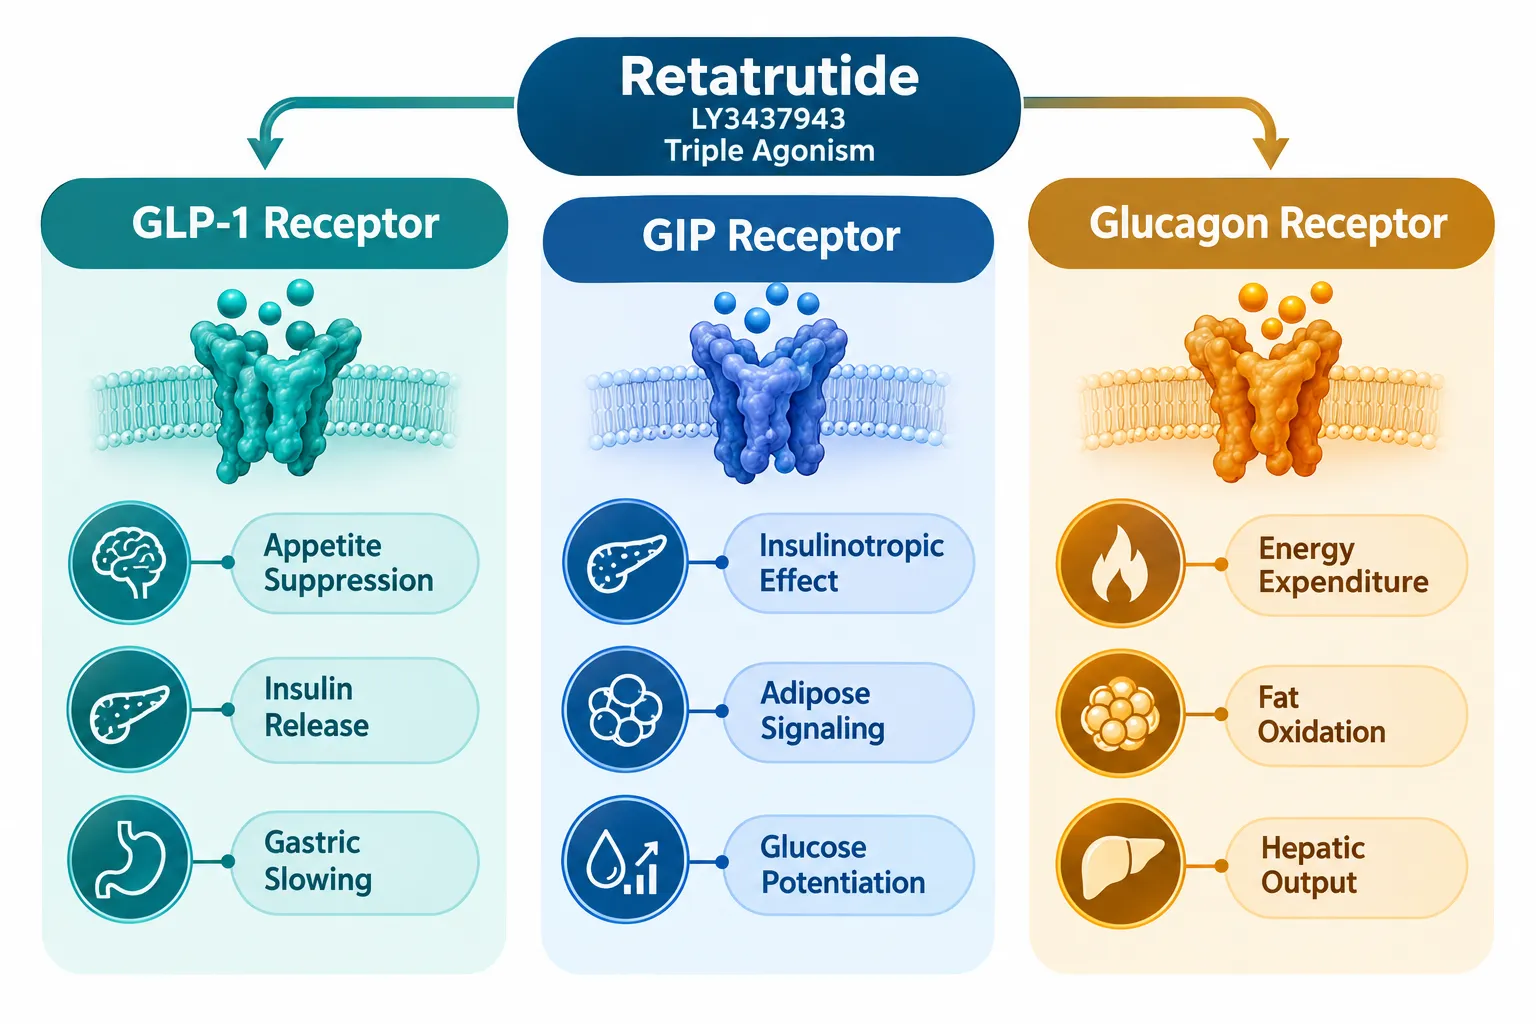
Researchers reviewing GLP-3 receptor agonist peptide research should note that retatrutide's triple-agonist mechanism distinguishes it from dual or single-target agents, which affects how dose-response curves should be modeled.


Interpreting A1C and Weight Data From Retatrutide Phase 3 Diabetes Results

A1C Reduction: Reading the Dose-Response Signal

In TRANSCEND-T2D-1, mean A1C reductions from a baseline of approximately 7.9% were:

Dose Mean A1C Reduction vs. Placebo
4 mg ~1.69% ~2x placebo
9 mg ~1.86% ~2.3x placebo
12 mg ~1.94% ~2.4x placebo
Placebo ~0.81% Reference

The incremental gain between 9 mg and 12 mg is small (roughly 0.08 percentage points), which researchers should weigh carefully against the larger jump in discontinuation risk at the highest dose.

In TRIUMPH-2, A1C reductions were somewhat smaller (approximately 1.4% to 1.6%), consistent with the more established disease state and likely background medication use in that population. Notably, up to 79.2% of participants achieved A1C at or below 6.5% on retatrutide versus roughly 26.3% on placebo, a clinically meaningful responder-rate difference.

Key analytical point: Absolute A1C reduction and responder rates (percentage reaching target) are different estimands. Both should be reported to avoid misleading summaries.

Weight Loss: A Metabolic Signal That Deserves Separate Analysis

Weight loss in these trials is not merely a secondary benefit. It is a primary metabolic outcome that may independently drive glycemic improvement.

In TRANSCEND-T2D-1 at 40 weeks:

  • 12 mg: approximately 36.6 lb (16.8% of body weight)
  • Weight loss curves had not plateaued, meaning the 40-week figure likely underestimates the drug's full effect.

In TRIUMPH-2 at 80 weeks:

  • 4 mg: approximately 29.8 lb (12.7%)
  • 9 mg: approximately 45.4 lb (19.1%)
  • 12 mg: approximately 49.6 lb (20.8%)

This near-linear dose-weight relationship positions retatrutide among the most potent pharmacologic weight-loss agents tested in diabetic populations. Researchers studying visceral fat reduction mechanisms will find the 80-week TRIUMPH-2 data particularly relevant for modeling adipose tissue dynamics.

For those sourcing research-grade material, GLP-3 Reta 30mg and GLP-3 Reta 20mg represent formulation options used in preclinical and translational research contexts.

Weight Loss: A Metabolic Signal That Deserves Separate Analysis


Discontinuation Data: The Critical Safety Estimand in Retatrutide Phase 3 Diabetes Results

Discontinuation due to adverse events is often under-analyzed in metabolic drug trials. For retatrutide, it is arguably the most important variable for predicting real-world uptake.

TRANSCEND-T2D-1 Discontinuation Rates

  • 4 mg: ~4.1%
  • 9 mg: ~6.9%
  • 12 mg: ~11.3%
  • Placebo: ~4.9%

The 12 mg arm saw discontinuation more than double the placebo rate. Gastrointestinal symptoms, primarily nausea, vomiting, and diarrhea, were the dominant drivers, consistent with other incretin-based agents.

TRIUMPH-2 Discontinuation Pattern

  • 4 mg: ~3.8%
  • 9 mg: ~11.6%
  • 12 mg: ~7.7%
  • Placebo: ~4.9%

A critical observation: In TRIUMPH-2, the 9 mg dose showed higher discontinuation than the 12 mg dose. This non-monotonic pattern suggests that intermediate doses may carry the greatest early tolerability burden, possibly because titration schedules at 9 mg produced faster GI exposure than at 12 mg. Researchers should not assume a simple linear relationship between dose and dropout risk.

Researchers examining peptide tolerability profiles, including those reviewing Reta peptide research formulations, should factor titration speed into any safety analysis. The Glp3 Reta 10mg formulation is relevant for lower-dose preclinical work where tolerability thresholds are being established.


A Framework for Benefit-Risk Modeling

When synthesizing Retatrutide Phase 3 Diabetes Results: How Researchers Should Interpret Dose, A1C, Weight, and Discontinuation Data into a coherent benefit-risk model, the following structure is recommended:

  1. Separate efficacy estimands – Distinguish A1C reduction, responder rates, and weight loss as distinct outcomes.
  2. Account for trial duration – 40-week data underestimates long-term weight outcomes.
  3. Model incremental gains vs. incremental risk – The 9-to-12 mg A1C gain is small; the discontinuation increase is not.
  4. Examine non-monotonic safety signals – TRIUMPH-2 discontinuation data requires dose-specific, not dose-linear, interpretation.
  5. Apply population context – Early monotherapy results do not transfer directly to established diabetes with obesity.

Expert commentary has characterized retatrutide as a breakthrough triple-hormone therapy whose tolerability profile, rather than its efficacy ceiling, will determine preferred clinical doses. Future research priorities include optimized titration schedules, head-to-head comparisons with tirzepatide and semaglutide, and structured evaluation in populations with chronic kidney disease and obstructive sleep apnea.


Conclusion

The Retatrutide Phase 3 Diabetes Results: How Researchers Should Interpret Dose, A1C, Weight, and Discontinuation Data evidence base is both robust and nuanced. The TRANSCEND-T2D-1 and TRIUMPH-2 trials confirm a strong, consistent efficacy signal, but accurate interpretation demands attention to trial design differences, the gap between absolute and responder-rate endpoints, the non-linear discontinuation pattern across doses, and the fact that weight loss curves had not plateaued at 40 weeks.

Actionable next steps for researchers:

  • Apply separate analytical frameworks to each trial rather than pooling results.
  • Report both mean A1C reduction and the percentage of participants reaching glycemic targets.
  • Treat the TRIUMPH-2 discontinuation pattern as a titration-schedule hypothesis, not a dose-safety anomaly.
  • Prioritize long-term follow-up data as it becomes available, particularly for weight plateau and cardiovascular outcomes.
  • When sourcing research-grade retatrutide formulations, consult verified suppliers such as those offering GLP-3 Reta 20mg Ga1 for structured preclinical protocols.

The data is strong. The interpretation requires precision.

https://www.puretestedpeptides.com/wp-content/uploads/2026/10/retatrutide-phase-3-diabetes-results-how-researchers-should-interpret-dose-a1c-w.webp 1024 1536 https://www.puretestedpeptides.com/wp-content/uploads/2026/01/buy-peptides-online.jpg 2026-10-12 13:13:532026-10-12 13:13:53Retatrutide Phase 3 Diabetes Results: How Researchers Should Interpret Dose, A1C, Weight, and Discontinuation Data
What Is a Diuretic? HCTZ, Furosemide, and Fluid-Balance Controls in GLP and Growth-Hormone Peptide Research

What Is a Diuretic? HCTZ, Furosemide, and Fluid-Balance Controls in GLP and Growth-Hormone Peptide Research

October 12, 2026/0 Comments/in Uncategorized/by

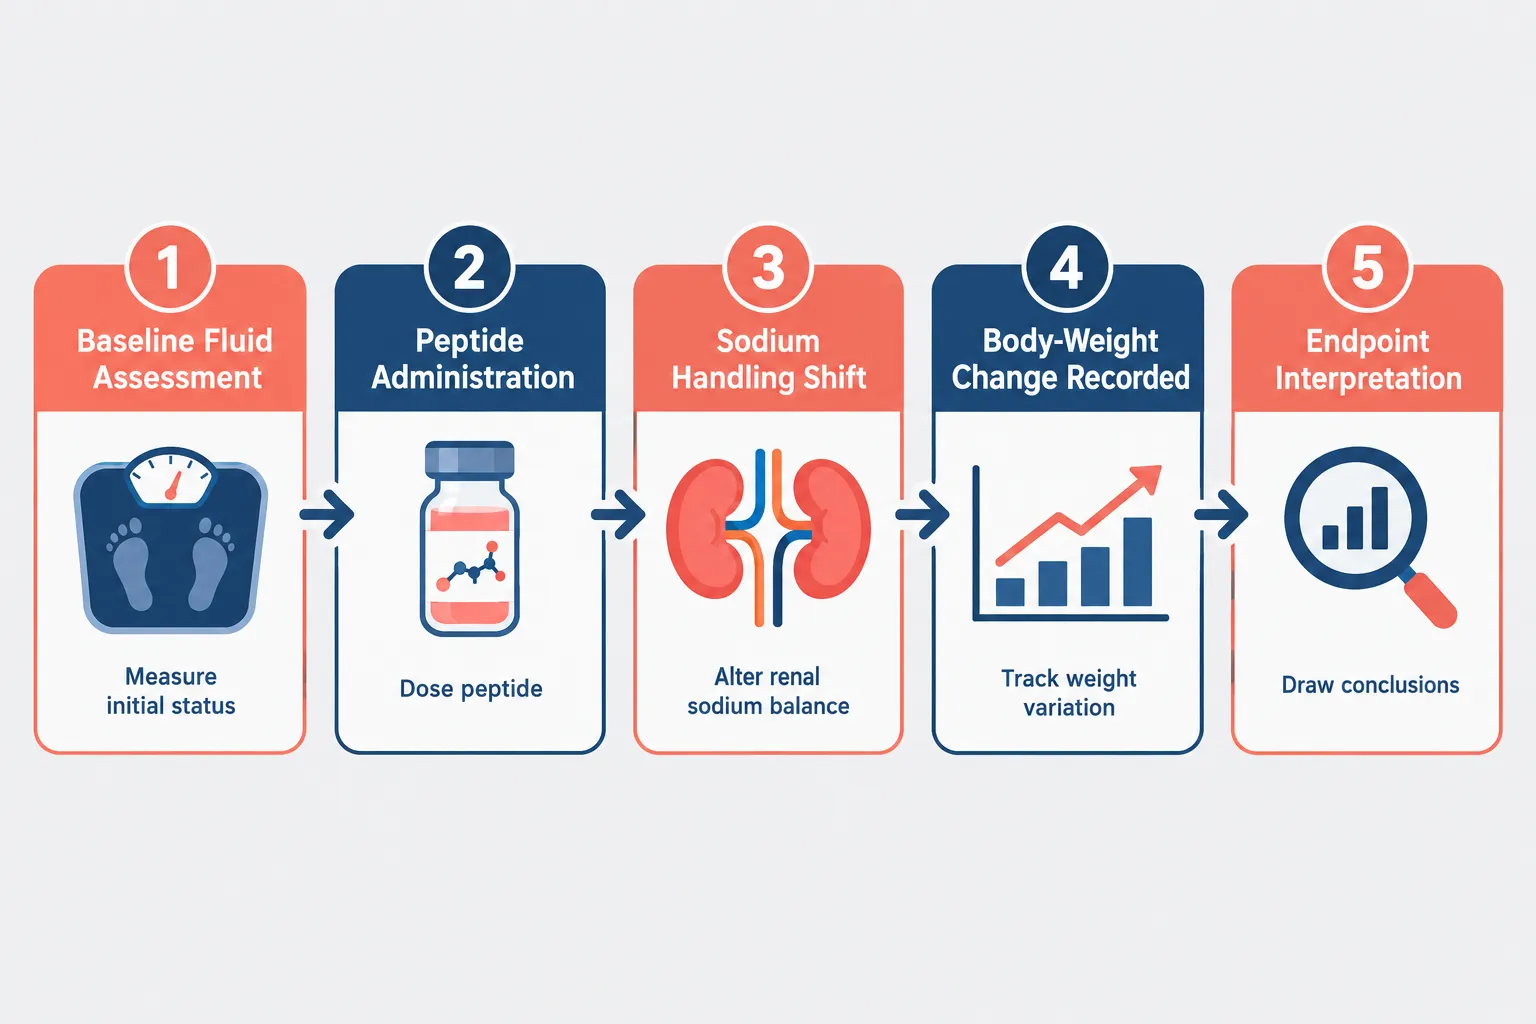
Fluid retention of just two liters can add more than four pounds to a subject's recorded body weight overnight, a shift large enough to mask or mimic a meaningful peptide-study endpoint. Understanding what a diuretic is, how agents like HCTZ and furosemide operate at the nephron level, and how GLP and growth-hormone peptides alter renal sodium handling is not a pharmacology footnote. It is a prerequisite for interpreting fluid-sensitive research data accurately.

Key Takeaways

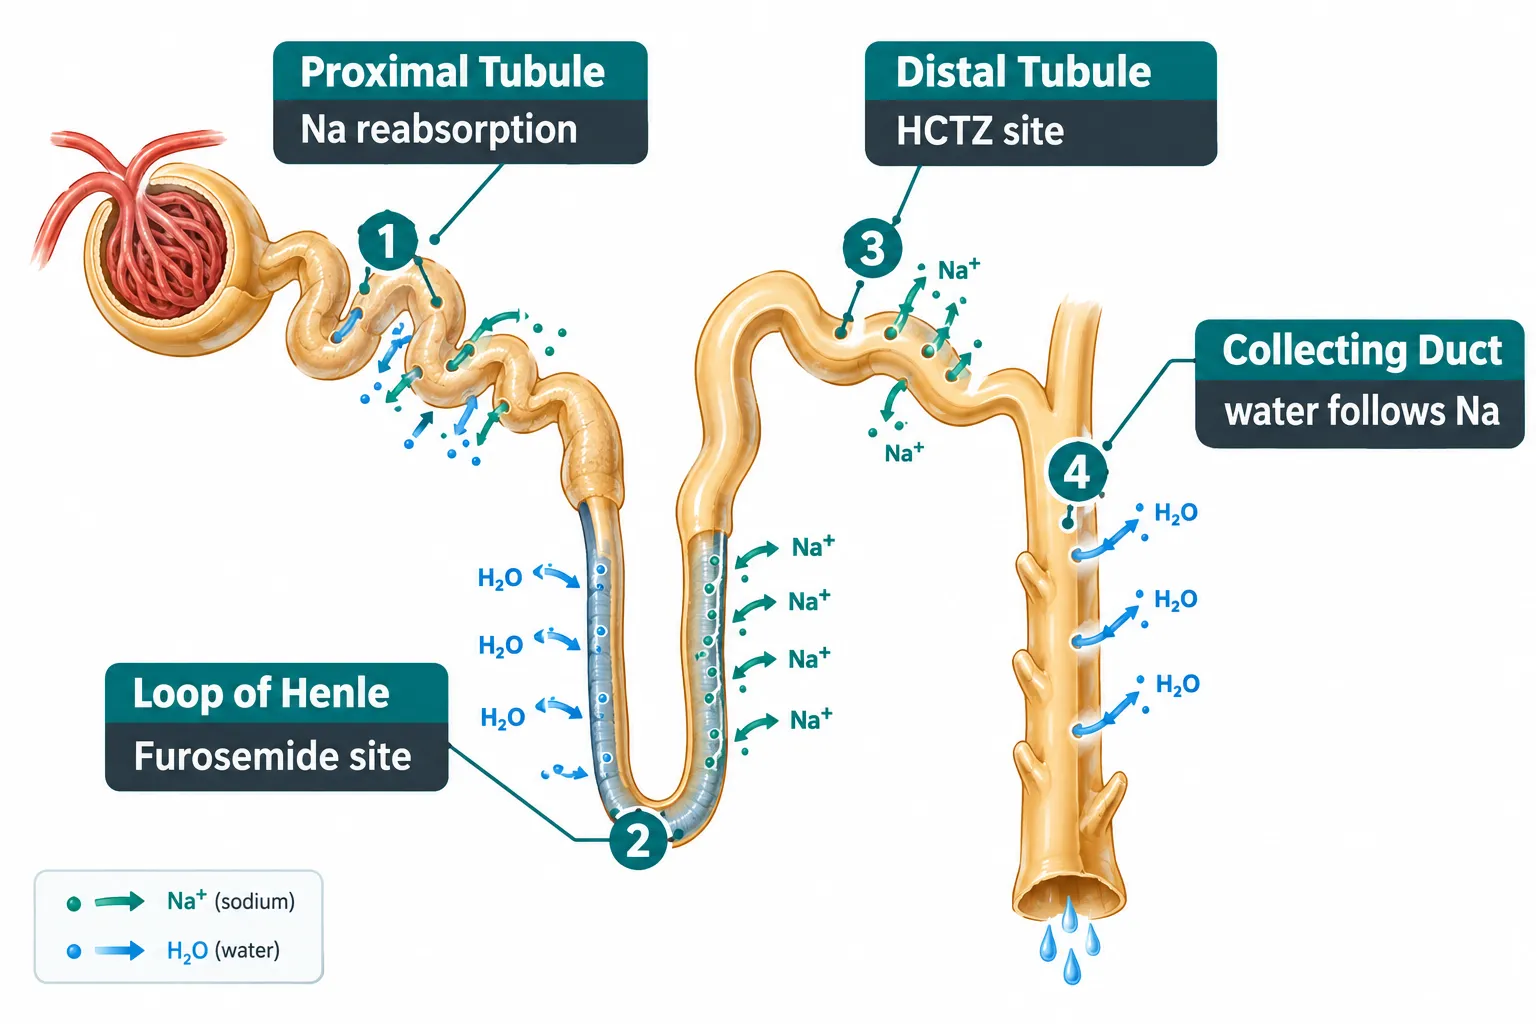
  • Diuretics increase urinary output by blocking sodium reabsorption at specific nephron sites; HCTZ acts on the distal tubule, furosemide on the loop of Henle.
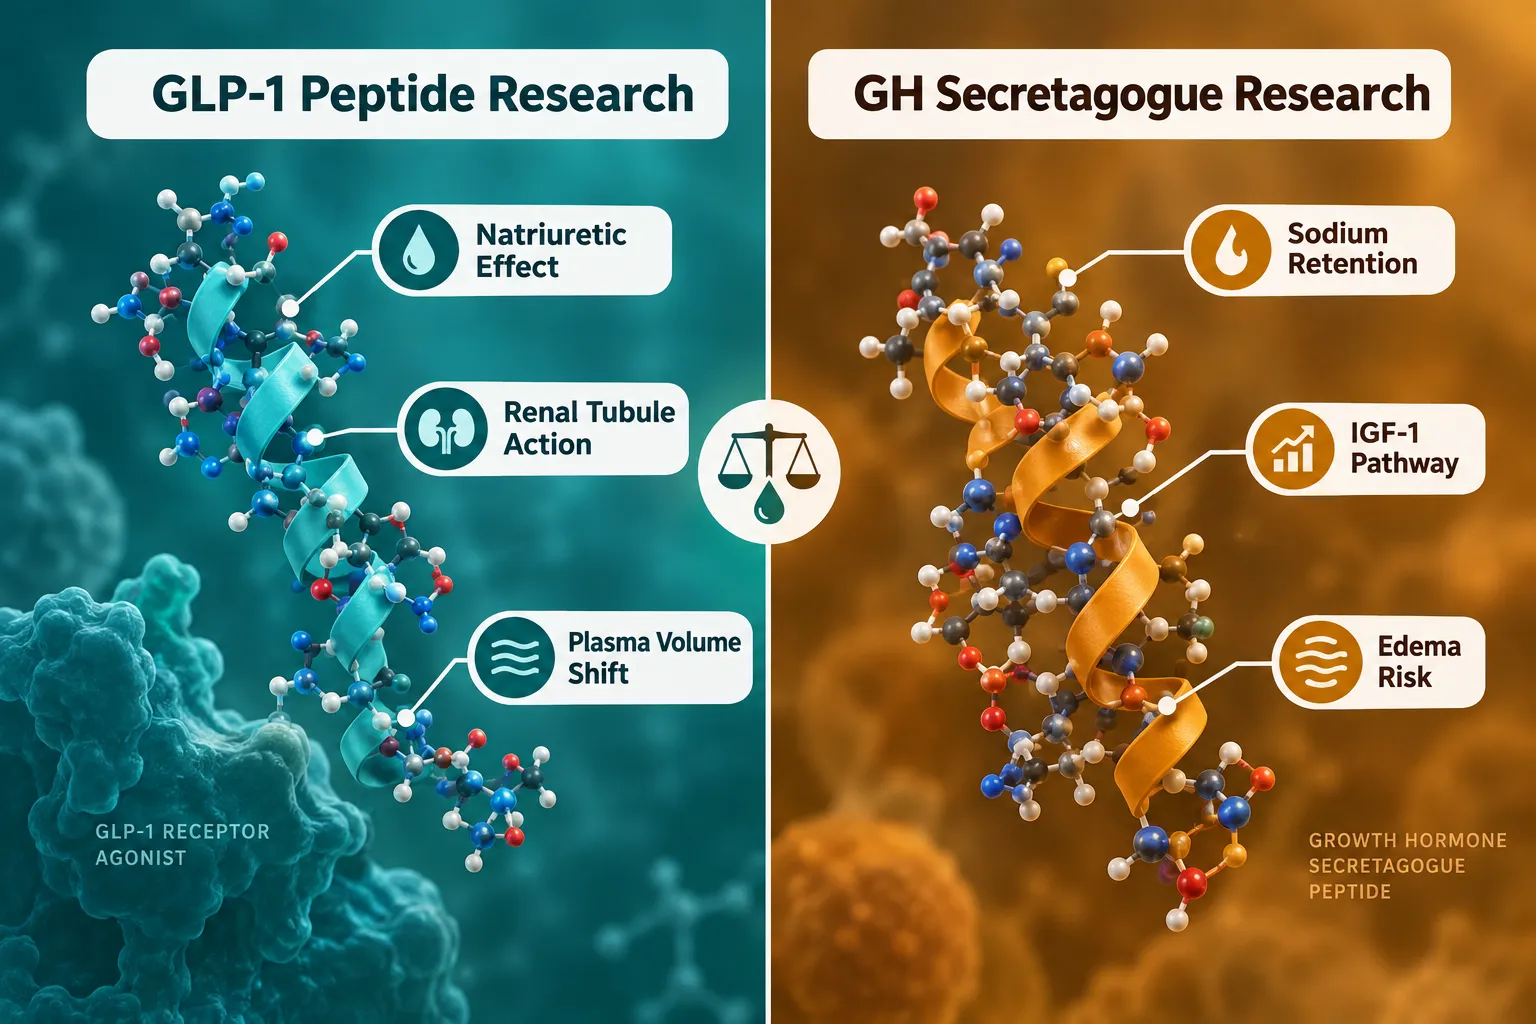
  • GLP-1 receptor agonists carry intrinsic natriuretic properties that can reduce or offset diuretic requirements in research models.
  • Growth-hormone-related peptides reliably promote sodium and water retention, which can inflate body-weight readings and confound lean-mass endpoints.
  • Renal tubular sodium handling is the central "control knob" linking peptide pharmacology to plasma-volume and body-weight outcomes.
  • Researchers must account for diuretic use, hydration status, and peptide-driven fluid shifts when designing protocols and interpreting results.

Diuretics Defined: Mechanism, Classes, and the HCTZ vs. Furosemide Distinction

A diuretic is any agent that increases the rate of urine production by reducing renal tubular reabsorption of sodium and, consequently, water. Because water follows sodium osmotically, blocking sodium transport at any nephron segment pulls fluid into the tubular lumen and out of the body.

Diuretics Defined: Mechanism, Classes, and the HCTZ vs. Furosemide Distinction

The two agents most relevant to peptide research contexts are hydrochlorothiazide (HCTZ) and furosemide.

Feature HCTZ (Thiazide) Furosemide (Loop)
Site of action Distal convoluted tubule Thick ascending loop of Henle
Relative potency Moderate High ("high-ceiling")
Onset 1-2 hours 30-60 minutes (oral)
Primary use Hypertension, mild edema Acute heart failure, resistant edema
Electrolyte concern Hypokalemia, hyponatremia Hypokalemia, hypomagnesemia

HCTZ inhibits the Na-Cl cotransporter (NCC), producing a moderate, sustained diuresis well-suited to chronic fluid management. Furosemide inhibits the Na-K-2Cl cotransporter (NKCC2), delivering a rapid, powerful diuresis used when fluid overload is urgent or HCTZ-resistant.

A third class, potassium-sparing diuretics such as spironolactone, blocks aldosterone receptors in the collecting duct. These are less potent but preserve potassium, making them relevant when peptide protocols already stress electrolyte balance.


GLP-1 Peptides and Fluid Balance: Built-In Natriuretic Activity

GLP-1 receptor agonists (GLP-1 RAs) are among the most studied peptide classes in 2026 metabolic research. What is a diuretic effect in this context? Interestingly, GLP-1 RAs appear to generate one intrinsically.

Activation of GLP-1 receptors on renal proximal tubule cells inhibits the sodium-hydrogen exchanger (NHE3), reducing sodium reabsorption and promoting a mild but measurable natriuresis. This mechanism is distinct from classic diuretic pharmacology yet produces overlapping outcomes: lower plasma volume, reduced interstitial fluid, and modest decreases in body weight that are independent of fat loss.

"In some clinical observations, GLP-1 RA therapy has resolved diuretic-resistant fluid retention, a finding that underscores the direct renal activity of this peptide class."

For researchers studying GLP-1 peptides or the GLP-3R peptide, this intrinsic fluid-lowering activity creates a significant confound. A recorded drop in body weight during a GLP-1 RA protocol may reflect:

  • Reduced caloric intake (the intended endpoint)
  • Natriuresis-driven plasma-volume contraction
  • A combination of both

Separating these contributions requires baseline fluid-status assessment and, ideally, bioelectrical impedance or DEXA to distinguish fat mass from lean and water compartments.

Long-term data also suggest that GLP-1 RAs reduce heart-failure hospitalization rates, an outcome partly attributable to sustained natriuretic activity reducing cardiac preload. This means concurrent standard diuretic doses may need downward adjustment in research subjects already on GLP-1 RA protocols.


Growth-Hormone Peptides, Sodium Retention, and the Diuretic Counterbalance

Growth-Hormone Peptides, Sodium Retention, and the Diuretic Counterbalance

Where GLP-1 peptides tend to reduce fluid load, growth-hormone-related peptides reliably do the opposite. GH stimulates IGF-1 production, which in turn activates renal sodium reabsorption through multiple tubular pathways. The result is a well-documented pattern of sodium retention, plasma-volume expansion, and peripheral edema, particularly prominent in the first weeks of GH or GH-secretagogue administration.

Research involving sermorelin peptide or GHRP-2 vs. sermorelin comparisons must account for this fluid-retention phase. Early body-weight increases in GH-secretagogue protocols are frequently misread as lean-mass accrual when they largely represent water and sodium accumulation.

Updated 2026 analyses frame this fluid retention as a physiological "normalization" of extracellular volume in subjects who were previously GH-deficient, but the effect remains clinically significant and endpoint-distorting regardless of its origin.

Key fluid-related variables to track in GH-peptide protocols:

  • Morning body weight (fasted, post-void) at consistent intervals
  • Ankle circumference or pitting-edema assessment
  • Serum sodium and potassium at baseline and follow-up
  • Urine specific gravity as a hydration proxy

MK-677 (ibutamoren), an oral GH secretagogue, produces particularly notable fluid retention due to sustained GH and IGF-1 elevation. Researchers using this compound alongside AOD-9604, a GH fragment with a different receptor profile, should note that AOD-9604's fluid impact appears considerably lower, offering a useful within-protocol comparison point.

When edema is significant enough to require intervention, furosemide is typically preferred over HCTZ because of its faster onset and higher ceiling. However, aggressive loop diuresis in a GH-peptide protocol risks hypokalemia, which can itself alter cellular hydration and confound intracellular water measurements.


Fluid-Balance Controls as a Research Design Requirement

Fluid-Balance Controls as a Research Design Requirement

Treating diuresis as a passive background variable rather than an active experimental control is a common source of irreproducible peptide data. The convergence of GLP-1 natriuresis, GH-driven sodium retention, and standard diuretic pharmacology at the same renal tubular sites means that small differences in hydration protocol, diuretic timing, or sodium intake can shift body-weight readings by two to five pounds without any change in the variable of interest.

Practical controls for fluid-sensitive peptide research:

  1. Standardize sodium intake across the protocol period.
  2. Record diuretic use (type, dose, timing) as a tracked covariate, not an exclusion criterion.
  3. Use morning fasted body weight as the primary weight endpoint, not ad-hoc measurements.
  4. Separate body-composition assessment (lean mass, fat mass, total body water) from scale weight.
  5. Monitor serum electrolytes when combining GH-related peptides with any diuretic class.

For researchers exploring compounds such as cagrilinitide peptide, which combines GLP-1 and amylin receptor activity, the fluid picture becomes even more layered. Dual-agonist peptides may amplify natriuretic effects beyond those seen with single-receptor agents, making pre-protocol fluid-status documentation essential.

Similarly, mitochondria-targeted peptides like SS-31 are being studied in contexts involving oxidative stress and cellular energy, where systemic fluid shifts could alter tissue perfusion and confound outcome markers unrelated to the peptide's primary mechanism.

Looking forward, the expectation, speculative but plausible, is that researchers will increasingly co-administer low-dose potassium-sparing diuretics as a standardized fluid-control arm in GH-peptide trials, and that GLP-1 RA protocols will move toward explicit natriuresis measurement as a secondary endpoint rather than an uncontrolled variable.


Conclusion

Understanding what a diuretic is, and how HCTZ, furosemide, and renal sodium handling interact with GLP and growth-hormone peptide pharmacology, is foundational to producing reliable research data in 2026. The actionable steps are clear: document fluid status at baseline, track diuretic use as a covariate, separate scale weight from body composition, and select diuretic class based on the specific fluid-retention mechanism in play. Researchers who treat fluid balance as a controlled variable rather than background noise will produce endpoints that hold up to scrutiny and replication.

https://www.puretestedpeptides.com/wp-content/uploads/2026/10/what-is-a-diuretic-hctz-furosemide-and-fluid-balance-controls-in-glp-and-growth.webp 1024 1536 https://www.puretestedpeptides.com/wp-content/uploads/2026/01/buy-peptides-online.jpg 2026-10-12 13:06:342026-10-12 13:06:34What Is a Diuretic? HCTZ, Furosemide, and Fluid-Balance Controls in GLP and Growth-Hormone Peptide Research
Retatrutide Phase 3 Cardiometabolic Monitoring: Designing Research Panels for Triglycerides, Blood Pressure, hsCRP, and A1C

Retatrutide Phase 3 Cardiometabolic Monitoring: Designing Research Panels for Triglycerides, Blood Pressure, hsCRP, and A1C

October 12, 2026/0 Comments/in Uncategorized/by

By mid-2026, five pivotal Phase 3 readouts from Eli Lilly's TRIUMPH program had confirmed that retatrutide produces weight loss exceeding 28% of body weight, a figure that surpasses every previously reported pharmacological result in humans. Yet the most consequential design challenge for researchers is not tracking weight. It is building a cardiometabolic panel rigorous enough to separate the independent effects of retatrutide on lipids, blood pressure, inflammation, and glycemic control from the cascade of changes that weight loss alone would produce. Retatrutide Phase 3 cardiometabolic monitoring: designing research panels for triglycerides, blood pressure, hsCRP, and A1C demands a structured, multi-domain approach grounded in the latest TRIUMPH data.

Key Takeaways

  • TRIUMPH Phase 3 trials prespecify fasting triglycerides, non-HDL cholesterol, systolic blood pressure, hsCRP, A1C, and waist circumference as core cardiometabolic endpoints alongside weight loss.
  • Triglyceride reductions of up to 39.5%, hsCRP reductions of up to 58.3%, and systolic blood pressure drops of up to 10.8 mmHg were recorded at 80 weeks in TRIUMPH-2.
  • Baseline stratification by diabetes status, cardiovascular disease history, and baseline triglyceride level is essential for interpreting correlated outcomes.
  • A1C is a primary endpoint in diabetes-focused arms (TRIUMPH-2, TRANSCEND-T2D-1) and must be paired with lipid and inflammatory markers to capture the full cardiometabolic picture.
  • The ongoing TRIUMPH-Outcomes CV/renal trial signals that future panels will expand to include kidney function markers such as eGFR and albuminuria.

Why the TRIUMPH Data Demand a Multi-Domain Panel

Why the TRIUMPH Data Demand a Multi-Domain Panel

The TRIUMPH program is not a single study. It is a coordinated set of 80-week, randomized, double-blind, placebo-controlled trials targeting distinct populations: TRIUMPH-1 in adults with obesity or overweight, TRIUMPH-2 in adults with obesity or overweight plus type 2 diabetes, and TRIUMPH-3 in 1,949 adults with BMI of 35 or higher and established cardiovascular disease. Each trial prespecifies cardiometabolic endpoints beyond weight, and the consistency of those endpoints across trials is itself a design signal.

In TRIUMPH-3, participants on retatrutide 12 mg achieved a 22.6% reduction in body weight versus 3.2% on placebo. Alongside that, triglycerides fell 37.0%, non-HDL cholesterol dropped 16.5%, systolic blood pressure decreased 9.3 mmHg, waist circumference shrank 19.0 cm, and hsCRP fell 51.2%. The MACE-5 hazard ratio of 0.82 did not reach statistical significance, which is a critical interpretive point: robust improvements in surrogate biomarkers did not automatically translate into a proven reduction in hard cardiovascular events. This finding directly shapes panel philosophy, these markers must be tracked as risk-factor indicators, not as proxies for confirmed outcome benefit.

Researchers sourcing the compound for preclinical or translational work can explore GLP-1 Reta and Reta peptide for sale options to understand the molecular context before designing monitoring frameworks.

Core panel elements supported by TRIUMPH data:

Biomarker TRIUMPH-2 Change (12 mg) TRIUMPH-3 Change (12 mg)
Triglycerides -39.5% -37.0%
Non-HDL Cholesterol -19.6% -16.5%
Systolic Blood Pressure -10.8 mmHg -9.3 mmHg
hsCRP -58.3% -51.2%
Waist Circumference Significant -19.0 cm
A1C -1.6% absolute Not primary

Baseline Stratification and Sampling Schedules

Baseline Stratification and Sampling Schedules

Effective retatrutide Phase 3 cardiometabolic monitoring, designing research panels for triglycerides, blood pressure, hsCRP, and A1C, begins before the first dose. Baseline stratification is the mechanism that allows researchers to disentangle weight-mediated effects from direct receptor-driven changes.

Stratification variables to define at enrollment:

  • Diabetes status: TRIUMPH-2 and TRANSCEND-T2D-1 demonstrate that A1C trajectories in diabetes populations diverge meaningfully from non-diabetes arms. Separate strata prevent dilution of glycemic signals.
  • Baseline triglyceride level: Participants with hypertriglyceridemia at baseline show proportionally larger reductions. Stratifying by fasting triglycerides above or below 200 mg/dL allows dose-response analysis that is not confounded by regression to the mean.
  • Cardiovascular disease history: TRIUMPH-3's CVD-enriched cohort produced the largest absolute hsCRP reductions. Mixing CVD and non-CVD participants without stratification obscures inflammation response patterns.
  • Baseline BMI tier: Weight loss magnitude correlates with baseline BMI, and since triglycerides and blood pressure both respond to weight loss, BMI strata help isolate pharmacological signal.

"The consistent use of fasting triglycerides, non-HDL cholesterol, systolic blood pressure, hsCRP, A1C, and waist circumference over 40-to-80-week windows across five Phase 3 trials represents an emerging standard for retatrutide cardiometabolic panel design."

Recommended sampling schedule for an 80-week protocol:

  • Baseline (Week 0): Full fasting lipid panel, hsCRP, A1C, blood pressure (triplicate), waist circumference, eGFR, albuminuria
  • Week 12: Fasting triglycerides, blood pressure, body weight
  • Week 24: Full panel repeat
  • Week 40: Full panel repeat (aligns with TRANSCEND-T2D-1 primary endpoint)
  • Week 52: Fasting triglycerides, hsCRP, blood pressure, A1C
  • Week 80: Full panel repeat, primary endpoint analysis

Fasting status for lipid draws must be standardized at 10-12 hours. Blood pressure should follow a three-reading protocol with the participant seated for five minutes, using the average of readings two and three. hsCRP should use the high-sensitivity assay (hs-CRP) to detect low-grade inflammation changes relevant to cardiovascular risk.

For researchers exploring related metabolic pathways, visceral fat research resources provide useful context on adipose-driven inflammation that intersects with hsCRP monitoring. Those studying growth hormone secretagogue stacks may also find the IPA Sermorelin stack research reference helpful for understanding parallel metabolic endpoints.


Interpreting Correlated Outcomes Without Overclaiming

Interpreting Correlated Outcomes Without Overclaiming

The central interpretive challenge in retatrutide Phase 3 cardiometabolic monitoring, designing research panels for triglycerides, blood pressure, hsCRP, and A1C, is that all four major endpoints are correlated with each other and with weight loss. A 28% reduction in body weight alone would be expected to lower triglycerides, reduce systolic blood pressure, decrease hsCRP, and improve insulin sensitivity. Attributing the observed changes solely to receptor agonism requires deliberate analytical design.

Three analytical strategies to separate effects:

  1. Mediation analysis: Model weight loss as a mediator between retatrutide dose and each cardiometabolic endpoint. The residual direct effect after accounting for weight change estimates the weight-independent pharmacological contribution.
  2. Matched-weight comparator: Identify placebo participants who achieved similar weight loss through caloric restriction and compare their lipid and inflammatory trajectories to retatrutide-treated participants at the same weight-loss magnitude.
  3. Time-course divergence: Triglyceride and hsCRP reductions in TRIUMPH trials appear early and disproportionately large relative to the weight-loss timeline, suggesting direct receptor-mediated effects. Plotting biomarker change against cumulative weight loss at each time point can reveal non-linear relationships that indicate independent mechanisms.

A1C interpretation in mixed populations requires particular care. In TRIUMPH-2, the 1.6% absolute A1C reduction at the highest dose reflects both weight-mediated insulin sensitization and potential direct GLP-1 receptor-driven beta-cell effects. Panels that include fasting insulin and HOMA-IR alongside A1C allow researchers to partition these contributions.

Researchers interested in mitochondrial and cellular stress pathways that intersect with cardiometabolic function may find the SS-31 mitochondrial research tag and the detailed SS-31 mechanism and research guide useful for understanding complementary biomarker frameworks.

The TRIUMPH-Outcomes CV/renal trial (active as of October 2026) extends this logic further by enrolling adults with atherosclerotic cardiovascular disease and/or chronic kidney disease. Its design implies that future standard panels will add eGFR and albuminuria as kidney-function domains, creating a true multi-system cardiometabolic bundle rather than a lipid-and-pressure-only framework.

Avoid these common panel design errors:

  • Using non-fasting lipid draws at inconsistent time points
  • Measuring blood pressure immediately after physical activity or within 30 minutes of caffeine intake
  • Reporting A1C without concurrent fasting glucose, which limits mechanistic interpretation
  • Treating hsCRP as a hard outcome rather than a risk-factor surrogate

For those examining how to source research-grade retatrutide for preclinical panel validation studies, the how to buy Reta and Reta 10mg product tag pages provide relevant procurement context.


Conclusion

The TRIUMPH program has produced a clear, reproducible cardiometabolic signal: fasting triglycerides, non-HDL cholesterol, systolic blood pressure, hsCRP, A1C, and waist circumference all improve substantially with retatrutide across obesity, diabetes, and high-CVD-risk populations. The actionable next steps for researchers designing monitoring panels are straightforward.

Act on these priorities:

  • Standardize baseline stratification by diabetes status, CVD history, and baseline triglyceride level before randomization.
  • Implement a minimum six-timepoint sampling schedule across 80 weeks, with full fasting panels at baseline, week 24, week 40, and week 80.
  • Build mediation analysis into the statistical analysis plan from the outset to separate weight-mediated from direct pharmacological effects.
  • Add eGFR and albuminuria to panels that enroll participants with chronic kidney disease, anticipating the TRIUMPH-Outcomes readout framework.
  • Treat all biomarker improvements as risk-factor endpoints, not as evidence of hard cardiovascular event reduction, until outcomes trial data are available.

Rigorous panel design is what will allow the field to move from observing that retatrutide changes biomarkers to understanding precisely how, in whom, and through which mechanisms those changes occur.

https://www.puretestedpeptides.com/wp-content/uploads/2026/10/retatrutide-phase-3-cardiometabolic-monitoring-designing-research-panels-for-tri.webp 1024 1536 https://www.puretestedpeptides.com/wp-content/uploads/2026/01/buy-peptides-online.jpg 2026-10-12 13:05:412026-10-12 13:05:41Retatrutide Phase 3 Cardiometabolic Monitoring: Designing Research Panels for Triglycerides, Blood Pressure, hsCRP, and A1C
Retatrutide Triple-Agonist Research After Phase 3: Separating GLP-1, GIP, and Glucagon Effects in Combination Models

Retatrutide Triple-Agonist Research After Phase 3: Separating GLP-1, GIP, and Glucagon Effects in Combination Models

October 12, 2026/0 Comments/in Uncategorized/by

Thirty percent average body weight loss from a single weekly injection, that figure, reported from the TRIUMPH-1 Phase 3 trial in 2026, is not a rounding error. It represents a threshold that no approved obesity drug had previously crossed, and it forces a fundamental scientific question: which of retatrutide's three receptor targets is doing what, and how do they interact?

Understanding retatrutide triple-agonist research after Phase 3: separating GLP-1, GIP, and glucagon effects in combination models is no longer an academic exercise. With multiple Phase 3 programs now reporting data and regulatory submissions on the horizon, the field urgently needs receptor-deconvolution frameworks that can explain the drug's outsized efficacy and guide next-generation design.

For a broader foundation on how multi-target peptides are classified and studied, the Peptides 101 for research-use only buyers guide provides useful context on structure and mechanism.

Key Takeaways

  • Retatrutide (LY3437943) simultaneously activates GLP-1, GIP, and glucagon receptors, producing weight loss and metabolic effects that exceed those of single- or dual-agonist drugs.
  • Phase 3 TRIUMPH-1 data show up to 30.3% mean weight loss at the 12 mg dose in adults with obesity but without diabetes.
  • Current receptor-deconvolution relies on preclinical selectivity studies, PK/PD modeling, and comparisons against matched single- and dual-agonist controls rather than human "component dissection" trials.
  • GLP-1 and GIP receptor activation primarily drives appetite suppression and insulin release; glucagon receptor activation primarily enhances energy expenditure and fat oxidation.
  • Gastrointestinal side effects and cholelithiasis are the most common adverse events, and no adjudicated cardiovascular outcome data exist yet as of October 2026.

The Three-Receptor Architecture: Why Deconvolution Matters

The Three-Receptor Architecture: Why Deconvolution Matters

Retatrutide is a once-weekly injectable peptide that binds with meaningful potency to all three incretin and counter-regulatory hormone receptors: GLP-1R, GIPR, and GCGR. Each receptor sits in different tissues and drives different downstream signals. When a single molecule activates all three simultaneously, interpreting clinical outcomes becomes genuinely complex.

Why this matters for research design:

  • A drug that lowers body weight by 30% could be doing so through reduced caloric intake, increased energy expenditure, altered fat metabolism, or some combination of all three.
  • Attributing adverse events, particularly nausea, vomiting, or liver enzyme changes, to the correct receptor pathway is essential for dose optimization.
  • Future drug design depends on knowing whether the glucagon component adds meaningfully to the GLP-1/GIP base or introduces unnecessary risk.

The standard approach to receptor deconvolution in combination models involves four elements: receptor-selective comparator arms, matched-dose controls, indirect food-intake measurements, and multi-dimensional metabolic readouts including energy expenditure calorimetry, lipid panels, and hepatic fat quantification.


Phase 3 Readouts: What the Data Reveal About Combined Signaling

Phase 3 Readouts: What the Data Reveal About Combined Signaling

The TRIUMPH-1 and TRIUMPH-2 trials are the most informative Phase 3 datasets available as of 2026. Both were 80-week, randomized, double-blind, placebo-controlled studies. TRIUMPH-1 enrolled adults with obesity or overweight without diabetes; TRIUMPH-2 enrolled adults with type 2 diabetes plus obesity or overweight.

Trial Population Key Outcome Highest Dose Result
TRIUMPH-1 Obesity, no diabetes Mean weight loss ~30.3% at 12 mg
TRIUMPH-2 T2D + obesity Weight loss + A1C Significant vs placebo
TRANSCEND-T2D-1 Type 2 diabetes A1C + body weight Significant vs placebo
NCT06383390 BMI 27+ with CVD/CKD MACE + MAKE events Ongoing

The TRANSCEND-T2D program adds three global registrational trials specifically in type 2 diabetes, with TRANSCEND-T2D-1 already reporting significant reductions in both A1C and body weight versus placebo within 40 weeks.

A critical observation from these trials: the weight-loss magnitude consistently exceeds what GLP-1 receptor agonists alone or GLP-1/GIP dual agonists have produced in comparable populations. This "excess efficacy" is the primary empirical signal pointing to a meaningful glucagon receptor contribution.

Researchers studying related GLP-3 Reta peptide products will recognize that incretin-family receptor pharmacology is highly sensitive to relative binding affinities and dosing schedules.


Separating GLP-1, GIP, and Glucagon Effects in Combination Models

Separating GLP-1, GIP, and Glucagon Effects in Combination Models

The core challenge in retatrutide triple-agonist research after Phase 3: separating GLP-1, GIP, and glucagon effects in combination models is that no human Phase 3 trial has been designed with a "component subtraction" arm. Instead, mechanistic understanding is built from three converging lines of evidence.

Receptor-Selective Comparator Strategy

The most informative preclinical and early-phase approach compares retatrutide against:

  1. A GLP-1R-only agonist (e.g., semaglutide) at an equi-efficacious dose
  2. A GLP-1R/GIPR dual agonist (e.g., tirzepatide) at a matched dose
  3. A selective GCGR agonist used as a mechanistic probe

Any metabolic outcome that exceeds the dual-agonist benchmark, particularly in energy expenditure, fat oxidation rate, or hepatic lipid clearance, is provisionally attributed to the glucagon receptor component.

What Each Receptor Contributes

Current models, built from pharmacokinetic/pharmacodynamic (PK/PD) analyses and preclinical receptor-knockout studies, assign the following roles:

  • GLP-1 receptor: Appetite suppression via hypothalamic signaling, slowed gastric emptying, glucose-dependent insulin secretion, reduced glucagon secretion from pancreatic alpha cells.
  • GIP receptor: Potentiation of insulin release, adipose tissue signaling that may improve insulin sensitivity, possible central appetite effects that complement GLP-1R activation.
  • Glucagon receptor: Increased hepatic glucose output (a concern at high doses), but also markedly increased energy expenditure, enhanced fat oxidation in adipose and muscle tissue, and accelerated hepatic lipid clearance relevant to MASLD.

"The glucagon component is the most pharmacologically interesting and the most clinically demanding, it adds thermogenic benefit but requires careful titration to avoid glycemic overshoot."

This is why retatrutide's clinical program includes dedicated MASLD and cardiovascular/renal outcomes trials. The glucagon receptor's hepatic effects make it a candidate for steatotic liver disease, while its energy-expenditure effects may translate to cardiovascular risk reduction beyond simple weight loss.

Indirect Food-Intake and Energy Expenditure Readouts

In combination models, separating appetite suppression from increased caloric burn requires:

  • Doubly labeled water studies to measure total energy expenditure in free-living conditions
  • Respiratory quotient measurements to assess fuel substrate shifts (fat vs. carbohydrate oxidation)
  • Resting metabolic rate testing at multiple time points to detect glucagon-driven thermogenesis
  • Ad libitum food-intake diaries cross-referenced with gastric emptying scintigraphy

Phase 2 data suggest that retatrutide produces a larger shift toward fat oxidation than GLP-1-only agents, consistent with glucagon receptor engagement. Confirming this in Phase 3 populations with dedicated sub-studies remains an open research priority.

For researchers tracking related peptide mechanisms, the IPA Sermorelin stack research page illustrates how combination peptide models are analyzed in growth-hormone-axis contexts, a methodologically parallel challenge.


Safety Profile and Receptor-Specific Adverse Events

Across Phase 3 data reported through October 2026, the most frequent adverse events are gastrointestinal: nausea, diarrhea, and vomiting. These are broadly consistent with GLP-1 receptor activation and are similar in character, though sometimes more pronounced, than those seen with GLP-1-only agents.

Treatment-emergent cholelithiasis (gallstone formation) appears at rates that merit monitoring, a known risk class effect of rapid weight loss combined with GLP-1R activity.

The glucagon receptor component introduces two specific safety considerations:

  1. Glycemic risk: Glucagon receptor activation raises hepatic glucose output. In non-diabetic populations this is offset by GLP-1/GIP-driven insulin release, but in patients with impaired beta-cell function, the balance requires careful dose titration.
  2. Hepatic enzyme changes: GCGR agonism can transiently elevate liver enzymes; ongoing MASLD trials are monitoring this closely.

No completed, adjudicated cardiovascular outcomes data exist as of October 2026. The large event-driven outcomes trial (NCT06383390) enrolling adults with established atherosclerotic cardiovascular disease and/or chronic kidney disease will be the definitive test of whether triple agonism translates to hard cardiovascular and renal event reduction.

Researchers interested in renal-protective peptide mechanisms may find the SS-31 kidney health research page relevant as a parallel model of organ-protective peptide pharmacology.


Future Directions: Fine-Tuning the Triple-Agonist Balance

Industry analysts and academic commentators broadly expect Eli Lilly to pursue initial regulatory submissions for obesity/overweight with comorbidities and type 2 diabetes, followed by label expansions for obstructive sleep apnea, knee osteoarthritis, and MASLD pending positive trial outcomes.

The TRIUMPH-4 trial specifically tests retatrutide in adults with obesity and knee osteoarthritis, a paradigm-setting design that positions obesity drugs as disease-modifying therapies for mechanical and pain outcomes, not just metabolic ones.

Longer term, the receptor-deconvolution work now underway will likely inform a new generation of "tunable" triple agonists where the relative GLP-1, GIP, and glucagon potency ratios are deliberately engineered for specific patient phenotypes:

  • High glucagon ratio: Optimized for MASLD and energy expenditure in metabolically active patients
  • High GIP ratio: Optimized for glycemic control with minimized GI side effects
  • Balanced triple agonism: Retatrutide's current profile, optimized for maximum weight loss

For those researching available Reta 20mg peptide options for preclinical study purposes, purity and third-party testing remain essential quality benchmarks in this research context. Similarly, the GLP-3 Reta 10mg third-party tested peptide represents the kind of verified research-grade material required for meaningful receptor-selectivity experiments.


Conclusion

Retatrutide triple-agonist research after Phase 3: separating GLP-1, GIP, and glucagon effects in combination models is one of the most consequential mechanistic challenges in metabolic pharmacology in 2026. The Phase 3 data are compelling, 30.3% mean weight loss, robust A1C reductions, and early signals of benefit in OSA and knee osteoarthritis, but the field cannot yet fully explain how each receptor contributes to these outcomes in human subjects.

Actionable next steps for researchers and clinicians:

  • Prioritize sub-studies within ongoing Phase 3 trials that include energy expenditure calorimetry and fuel oxidation measurements.
  • Design receptor-selective comparator arms in any new combination-model research using matched doses of GLP-1-only and dual GLP-1/GIP agonists as benchmarks.
  • Monitor GCGR-specific safety signals, particularly glycemic and hepatic, as separate endpoints from GLP-1R-class effects.
  • Watch for readouts from the cardiovascular and renal outcomes trial, which will determine whether triple agonism's metabolic benefits translate to hard clinical event reduction.
  • Engage with the MASLD and OSA trial data as they mature; these will provide the clearest real-world test of glucagon receptor contribution to organ-level outcomes.

The receptor-deconvolution work being done now will define not just retatrutide's label, but the entire architecture of next-generation incretin therapy.

https://www.puretestedpeptides.com/wp-content/uploads/2026/10/retatrutide-triple-agonist-research-after-phase-3-separating-glp-1-gip-and-gluca.webp 1024 1536 https://www.puretestedpeptides.com/wp-content/uploads/2026/01/buy-peptides-online.jpg 2026-10-12 13:05:402026-10-12 13:05:40Retatrutide Triple-Agonist Research After Phase 3: Separating GLP-1, GIP, and Glucagon Effects in Combination Models
ACE Inhibitors Explained: How Lisinopril and Angiotensin-Converting Enzyme Signaling Can Confound Peptide Vascular Studies

ACE Inhibitors Explained: How Lisinopril and Angiotensin-Converting Enzyme Signaling Can Confound Peptide Vascular Studies

October 12, 2026/0 Comments/in Uncategorized/by

Nearly one in three adults worldwide takes a medication that directly reshapes the body's peptide signaling landscape — yet most vascular peptide studies fail to account for it. Angiotensin-converting enzyme (ACE) inhibitors, led by the widely prescribed lisinopril, do far more than lower blood pressure. They fundamentally alter the concentrations of angiotensin II, bradykinin, and a cascade of downstream peptides that researchers use as biomarkers and endpoints. Understanding ACE inhibitors explained through the lens of vascular peptide research is not just useful — it is essential for producing reproducible, interpretable data.

Key Takeaways

  • ACE inhibitors like lisinopril block the conversion of angiotensin I to angiotensin II, but also elevate bradykinin, Ac-SDKP, and angiotensin-(1-7), altering the entire vascular peptide environment.
  • Background ACE inhibitor use in study subjects creates a shifted peptide "baseline" that can make experimental results misleading if not controlled for.
  • Dietary and research-use peptides can independently inhibit ACE, adding another layer of confounding in vascular studies.
  • ACE inhibition measurably reduces collagen-related peptide biomarkers, affecting tissue-remodeling endpoints.
  • Rigorous study design requires screening, stratification, and biomarker adjustment for ACE inhibitor exposure.

How ACE Biology Drives Vascular Peptide Signaling

How ACE Biology Drives Vascular Peptide Signaling

The renin-angiotensin-aldosterone system (RAAS) is one of the most studied hormonal axes in cardiovascular medicine. At its center sits angiotensin-converting enzyme — a peptidyl dipeptidase anchored to vascular endothelium. ACE cleaves two amino acids from angiotensin I to generate angiotensin II, a potent vasoconstrictor that raises blood pressure, stimulates aldosterone release, and promotes vascular smooth-muscle contraction.

Lisinopril binds competitively to the ACE active site, blocking this conversion. The result is a drop in circulating angiotensin II and a parallel reduction in aldosterone and vasopressor activity. Blood pressure falls. But the enzymatic blockade does not stop there.

ACE also degrades bradykinin, a vasodepressor peptide that promotes vasodilation and natriuresis. When ACE is inhibited, bradykinin accumulates. Current regulatory labeling for lisinopril acknowledges that elevated bradykinin may contribute to the drug's therapeutic effects, though its precise role remains under investigation. Beyond bradykinin, ACE inhibition raises levels of:

Peptide Species Direction of Change Vascular Effect
Angiotensin II Decreases Less vasoconstriction
Bradykinin Increases Vasodilation
Ac-SDKP Increases Anti-fibrotic, vasodilatory
Angiotensin-(1-7) Increases Vasodilation, anti-proliferative

This multi-peptide shift is not a side effect — it is a core feature of ACE inhibitor pharmacology. For researchers studying vascular peptide biology, it represents a significant source of confounding.

"Any background ACE inhibition — whether from a drug or a dietary source — can substantially skew vascular peptide profiles in experimental studies."


ACE Inhibitors Explained: Why Lisinopril Confounds Peptide Vascular Studies

ACE Inhibitors Explained: Why Lisinopril Confounds Peptide Vascular Studies

The confounding problem becomes clearest when examining what happens to the peptide environment inside study subjects already taking lisinopril. Their "baseline" is not a neutral RAAS state. It is a pharmacologically shifted landscape with suppressed angiotensin II, elevated kinins, and altered angiotensin peptide degradation kinetics.

Research published in 2026 confirms that ACE-inhibiting agents significantly alter the degradation kinetics and half-life of upstream angiotensin peptides, including angiotensin-(1-12). This means that not just angiotensin II, but the entire spectrum of RAAS peptides, is affected. Studies that enroll subjects on lisinopril without stratification will pool two biologically distinct peptide environments.

Three specific confounding mechanisms stand out:

  1. Shifted angiotensin II levels — The primary endpoint in many vascular studies, angiotensin II, is directly suppressed. Effect sizes will be compressed or reversed.
  2. Elevated bradykinin and Ac-SDKP — These vasodilatory peptides oppose the actions of test compounds, masking or amplifying observed vascular responses.
  3. Altered collagen-related peptide biomarkers — ACE inhibitor therapy produces mean reductions of roughly 20% in serum procollagen III peptide (PIIIP) and significant decreases in other collagen markers. Studies using these peptides to assess tissue remodeling will find systematically lower values in ACE-inhibitor-exposed subjects.

This last point matters for cardiometabolic research. Peptide-based biomarkers of myocardial fibrosis and vascular remodeling are widely used in heart failure and hypertension trials. If ACE inhibitor status is not documented and controlled, the signal is corrupted.

For researchers exploring peptide compounds with vascular or mitochondrial protective properties — such as those described in resources on SS31 peptide benefits or the synergy of LL-37 and SS31 — understanding the pharmacological background of study subjects is critical to interpreting results accurately.


Dietary and Research Peptides as Hidden ACE Inhibitors

A less-recognized confounding source is the peptides themselves. Food-derived and synthetic peptides can independently inhibit ACE at pharmacologically relevant concentrations.

Broccoli-derived peptides — including HLVNK, LTEVR, and LLDGR — have been shown to reduce intracellular angiotensin II and inhibit ERK and p38 MAPK phosphorylation in vascular smooth-muscle cells. Marine muscle protein hydrolysate yields peptides such as APFLAG with measurable ACE IC50 values near 69.5 µM, acting through SRC and STAT3 signaling. These are the same pathways affected by lisinopril.

This creates a layered confounding problem in peptide vascular studies:

  • Pharmaceutical ACE inhibitors shift the subject's baseline peptide environment.
  • Dietary ACE-inhibitory peptides from food sources can mimic or augment drug effects.
  • Research-use peptides under investigation may themselves carry ACE-inhibitory activity that interacts with background drug therapy.

Researchers reviewing foundational peptide mechanisms will find the Peptides 101 for research-use only buyers guide a useful reference for understanding how peptide structure drives receptor selectivity. Similarly, building robust peptide benchmarks with Bachem reference standards is directly relevant to establishing clean experimental controls.

For studies involving metabolic peptides, understanding how GLP-related compounds interact with vascular tone — as explored in resources on GLP peptides for sale — adds another dimension to study design. Likewise, researchers examining cardiometabolic endpoints should consult data on tesa peptide benefits for context on growth-hormone-releasing peptides and vascular outcomes.


Practical Controls for ACE Inhibitor Confounding in Vascular Research

Practical Controls for ACE Inhibitor Confounding in Vascular Research

Addressing ACE inhibitor confounding requires deliberate study design. The following protocol elements are now considered best practice in rigorous vascular peptide research as of 2026:

Screening and Enrollment

  • Document all ACE inhibitor and ARB use at enrollment.
  • Exclude or separately stratify subjects on lisinopril or equivalent agents.
  • Screen for dietary patterns high in ACE-inhibitory peptide sources.

Biomarker Adjustment

  • Measure baseline bradykinin, Ac-SDKP, and angiotensin-(1-7) alongside angiotensin II.
  • Use angiotensin-(1-12) degradation kinetics as a proxy for ACE occupancy.
  • Adjust collagen-related peptide endpoints (PIIIP, PIP, PICP) for ACE inhibitor status.

Imaging and Occupancy Measurement

  • Nuclear imaging tools using lisinopril radioconjugates can now quantify tissue ACE occupancy directly, allowing researchers to correct for pre-existing ACE inhibitor binding in concurrent peptide pharmacodynamic measurements.

These controls are not optional refinements — they are the difference between interpretable data and noise. Lisinopril remains antihypertensive even in low-renin states, meaning its vascular effects span a broad clinical spectrum that cannot be predicted from renin status alone.


Conclusion

ACE inhibitors explained in full reveal a pharmacological footprint that extends far beyond blood pressure control. Lisinopril and its class alter angiotensin II, bradykinin, Ac-SDKP, angiotensin-(1-7), and collagen-related peptide biomarkers simultaneously. For vascular and cardiometabolic peptide researchers, this creates a multi-layered confounding problem that corrupts endpoints, compresses effect sizes, and undermines reproducibility.

Actionable next steps for researchers in 2026:

  • Implement mandatory ACE inhibitor screening in all vascular peptide study enrollment protocols.
  • Add kinin and angiotensin-(1-7) panels to standard biomarker batteries.
  • Treat dietary ACE-inhibitory peptide exposure as a covariate, not background noise.
  • Consult updated reference standards and benchmark documentation before finalizing study designs.
  • Anticipate that regulatory and journal reviewers will increasingly require ACE inhibitor status disclosure in vascular peptide trial reports.

The field is moving toward whole-RAAS and kinin-system peptidome profiling as standard practice. Researchers who build these controls into their protocols now will produce data that stands up to scrutiny — and advances the science of peptide vascular biology rather than obscuring it.

https://www.puretestedpeptides.com/wp-content/uploads/2026/10/ace-inhibitors-explained-how-lisinopril-and-angiotensin-converting-enzyme-signal.webp 1024 1536 https://www.puretestedpeptides.com/wp-content/uploads/2026/01/buy-peptides-online.jpg 2026-10-12 13:05:272026-10-12 13:05:27ACE Inhibitors Explained: How Lisinopril and Angiotensin-Converting Enzyme Signaling Can Confound Peptide Vascular Studies
Page 2 of 80‹1234›»
×

Helpful Links

  • My account
  • Cart
  • Checkout
  • Refund and Returns Policy
  • Privacy Policy
  • SMS Privacy Policy
  • Login
  • My Account
  • Logout

USA Made Lab Tested Peptides

All products are sold for research, laboratory, or analytical purposes only, and are not for human consumption


Pure Tested Peptides is a chemical supplier. Pure Tested Peptides is not a compounding / chemical compounding facility as defined under 503A of the Federal Food, Drug, and Cosmetic act. Pure Tested Peptides is not an outsourcing facility as defined under 503B of the Federal Food, Drug, and Cosmetic act.

The statements made within this website have not been evaluated by the US Food and Drug Administration. The products we offer are not intended to diagnose, treat, cure or prevent any disease.

Human/Animal Consumption Prohibited. Laboratory/In-Vitro Experimental Use Only

Scroll to top Scroll to top Scroll to top