Call or Text 727-513-9780
  • Shopping Cart Shopping Cart
    0Shopping Cart
Pure Tested Peptides | America's most trusted Peptides for sale online
  • Peptides for sale
    • Oral Peptides for sale
      • Peptide Capsules for sale
      • BPC 157 Capsules 1000mcg
      • SLU-PP-332 Capsules | 1000 mcg
      • 5-Amino-1MQ 50mg Capsules
      • Tesofensine 500mcg
    • All Peptides for sale
    • Peptide Sprays
      • BPC 157 Nasal Spray Kit
      • BPC-157 TB500 Nasal Spray Kit
      • Semax Nasal Spray 10mg
      • Selank – Nasal Spray Kit – 10mg
      • Epithalon 50MG Nasal Spray Kit
      • Ipamorelin 10mg Nasal Spray
      • Klow Nasal Spray (BPC-157 + TB-500 + GHK-Cu + KPV) | 80mg
      • Hulk Nasal Spray Tesa / Ipa Blend 6/3 MG
      • Klow Nasal Spray
      • NAD + 500 mg Nasal Spray
      • PT-141 Nasal Spray Kit
    • GHRH Peptides
      • Ipa Peptides
      • CJC-1295 Peptides
        • CJC-1295 with DAC 5 mg
        • CJC-1295 without DAC 5 mg
        • CJC-1295 Ipa 10mg
      • Tesa Peptides
        • Tesa Peptide
        • Tesa 20 mg
    • GHK-Cu Peptides
      • All GHK-Cu Peptides
      • GHK-Cu 100mg
      • KLOW Peptide Blend – Buy KLOW blend online
    • BPC Peptides
      • All BPC Peptides
      • BPC-157
      • BPC-157 TB-500
      • BPC 157 capsules 1000mcg
    • SLU-PP-332 Peptides
      • All SLU-PP-332 Peptides
      • SLU-PP-332 5mg
    • GLP3 Peptides
    • PT-141 Peptides
      • PT-141 Peptides for sale
      • PT-141 10mg
      • PT-141 Nasal Spray
    • CAG Peptides
      • Lipo-C Peptide Blend
      • CAG 5mg
      • CAG 10mg
    • MOTS-C Peptides
      • MOTS-C Peptides for sale
      • MOTS-c peptide
      • MOTS-c 10mg *6 pack*
    • 5 Amino 1MQ Peptides
      • 5 Amino 1MQ Peptides for sale
      • 5-Amino-1MQ 50mg Capsules
      • 5-Amino-1MQ 5mg
    • Epithalon Peptides
      • Epithalon Peptides for sale
      • Epithalon 10mg
      • Epithalon 50mg
  • Shop
    • GLPs
      • 5-Amino-1MQ 50mg Capsules
      • 5-Amino-1MQ 5mg
      • L-Carnitine 500mg/ml
      • Tesofensine 500mcg
      • SLU-PP-332 5mg
      • MOTS-c 10mg *6 pack*
    • Epithalon & BPC Peptides
      • Epithalon 10mg
      • Epithalon 50mg
      • BPC-157
      • BPC 157 capsules 1000mcg
      • BPC-157 TB-500
      • BPC-157 TB500 Nasal Spray Kit
      • BPC 157 Nasal Spray Kit
    • BPC TB-500 & NAD+ Peptides
      • NAD+ 500 mg
      • KLOW Peptide Blend – Buy KLOW blend online
      • GLOW Peptide Blend
      • TB 500 5mg
      • BPC 157 capsules 1000mcg – Supplement
      • BPC 157 Nasal Spray Kit
      • BPC-157
      • BPC-157 TB500 Nasal Spray Kit
      • BPC-157 TB-500
      • BPC 157 capsules 1000mcg
    • LL-37 Peptide
      • LL-37 10 mg
    • MOTS-C & Selank
      • MOTS-c peptide
      • Selank 10mg
    • GHK Peptides
      • GHK-Cu 100mg
      • GLOW Peptide Blend
      • KLOW Peptide Blend – Buy KLOW blend online
  • COAs
  • Wholesale
    • Wholesale Peptides for sale
  • PTP FAQ
  • Affiliates
    • Selank Peptide: Advanced Pharmacological Mechanisms Underlying Its Anxiolytic and Nootropic Effects in Research
      • 5-Amino-1MQ Peptide: Detailed Mechanisms of NNMT Inhibition and Its Impact on Cellular Metabolism Research
        • MOTS-C Peptide: Unraveling Its Role in Mitochondrial Dynamics and Energy Metabolism Research
          • Epithalon Peptide and Telomerase Regulation: Investigating Its Impact on Cellular Senescence and Lifespan Research Models
            • GLP2-T vs GLP2 Tirz Peptide: Understanding the Naming, Mechanistic Nuances, and Research Implications for Gut Health
      • Peptides and Polypeptides in Modern Pharmacology: What Research on Metoprolol, Prednisone, and Amlodipine Reveals
        • Polypeptide Peptides vs NSAIDs: What Naproxen and Diclofenac Teach Tissue-Repair Researchers About BPC‑157 and TB‑500
          • Peptides and Polypeptides in Endocrine Pharmacology: How GLP-1, GLP-2, and GLP-3 Retatrutide Differ From Classic Drugs Like Prednisone and Amlodipine
          • 5‑Amino‑1MQ Peptide and NNMT Inhibition: How It Compares With Statins Like Atorvastatin in Adipose and Lipid Metabolism Research
      • Enclomiphene, Estrogen Receptor Signaling, and Luteinizing Phase Biology: What Hormone Researchers Should Measure
        • Mesenchymal Stem Cells, BPC‑157, and GHK‑Cu: How Tissue Repair Peptides Compare With Classic NSAIDs Like Naproxen in Injury Models
          • Peptide Calculator Use Cases Beyond Growth Hormone: Working Through GLP‑3 Retatrutide, MOTS‑c, and BPC‑157 Research Dosing
        • Polypeptide Peptides in Endocrine and Metabolic Pharmacology: Lessons From Amlodipine, Prednisone, and Metoprolol
        • Peptides Calculator for Advanced Blends: Worked Examples for Tesamorelin, CJC‑1295, and Ipamorelin Stacks
          • Peptides and Polypeptides in Human Physiology: How Molecular Size Shapes Research Applications
            • Selank Peptide: Advanced Pharmacological Mechanisms Underlying Its Anxiolytic and Nootropic Effects in Research
          • 5-Amino-1MQ Peptide: Detailed Mechanisms of NNMT Inhibition and Its Impact on Cellular Metabolism Research
            • MOTS-C Peptide: Unraveling Its Role in Mitochondrial Dynamics and Energy Metabolism Research
              • Epithalon Peptide and Telomerase Regulation: Investigating Its Impact on Cellular Senescence and Lifespan Research Models
                • GLP2-T vs GLP2 Tirz Peptide: Understanding the Naming, Mechanistic Nuances, and Research Implications for Gut Health
                  • Peptides and Polypeptides in Endocrine Pharmacology: How GLP-1, GLP-2, and GLP-3 Retatrutide Differ From Classic Drugs Like Prednisone and Amlodipine
                    • Polypeptide Peptides vs NSAIDs: What Naproxen and Diclofenac Teach Tissue-Repair Researchers About BPC‑157 and TB‑500
                      • Peptides and Polypeptides in Modern Pharmacology: What Research on Metoprolol, Prednisone, and Amlodipine Reveals
                        • 5‑Amino‑1MQ Peptide and NNMT Inhibition: How It Compares With Statins Like Atorvastatin in Adipose and Lipid Metabolism Research
                        • Enclomiphene, Estrogen Receptor Signaling, and Luteinizing Phase Biology: What Hormone Researchers Should Measure
                        • Mesenchymal Stem Cells, BPC‑157, and GHK‑Cu: How Tissue Repair Peptides Compare With Classic NSAIDs Like Naproxen in Injury Models
                        • Peptide Calculator Use Cases Beyond Growth Hormone: Working Through GLP‑3 Retatrutide, MOTS‑c, and BPC‑157 Research Dosing
                        • Polypeptide Peptides in Endocrine and Metabolic Pharmacology: Lessons From Amlodipine, Prednisone, and Metoprolol
                        • Peptides Calculator for Advanced Blends: Worked Examples for Tesamorelin, CJC‑1295, and Ipamorelin Stacks
                        • Peptides and Polypeptides in Human Physiology: How Molecular Size Shapes Research Applications
                        • Selank Peptide: Advanced Pharmacological Mechanisms Underlying Its Anxiolytic and Nootropic Effects in Research
                        • MOTS-C Peptide: Unraveling Its Role in Mitochondrial Dynamics and Energy Metabolism Research
                        • Peptides and Polypeptides in Modern Pharmacology: What Research on Metoprolol, Prednisone, and Amlodipine Reveals
                        • Peptides and Polypeptides in Endocrine Pharmacology: How GLP-1, GLP-2, and GLP-3 Retatrutide Differ From Classic Drugs Like Prednisone and Amlodipine
                        • 5-Amino-1MQ Peptide: Detailed Mechanisms of NNMT Inhibition and Its Impact on Cellular Metabolism Research
                        • Mesenchymal Stem Cells, BPC‑157, and GHK‑Cu: How Tissue Repair Peptides Compare With Classic NSAIDs Like Naproxen in Injury Models
                        • Peptide Calculator Use Cases Beyond Growth Hormone: Working Through GLP‑3 Retatrutide, MOTS‑c, and BPC‑157 Research Dosing
                        • GLP2-T vs GLP2 Tirz Peptide: Understanding the Naming, Mechanistic Nuances, and Research Implications for Gut Health
                        • Polypeptide Peptides in Endocrine and Metabolic Pharmacology: Lessons From Amlodipine, Prednisone, and Metoprolol
                        • Polypeptide Peptides vs NSAIDs: What Naproxen and Diclofenac Teach Tissue-Repair Researchers About BPC‑157 and TB‑500
                        • Peptides and Polypeptides in Human Physiology: How Molecular Size Shapes Research Applications
                        • Peptides Calculator for Advanced Blends: Worked Examples for Tesamorelin, CJC‑1295, and Ipamorelin Stacks
                        • 5‑Amino‑1MQ Peptide and NNMT Inhibition: How It Compares With Statins Like Atorvastatin in Adipose and Lipid Metabolism Research
                        • Enclomiphene, Estrogen Receptor Signaling, and Luteinizing Phase Biology: What Hormone Researchers Should Measure
                        • Epithalon Peptide and Telomerase Regulation: Investigating Its Impact on Cellular Senescence and Lifespan Research Models
                        • Best research protocol Klow blend
                        • best time to take BPC-157
                        • best time to take DSIP (Delta Sleep Inducing Peptide)
                        • best time to take CJC-1295
                        • best time to take AOD-9604
                        • best time to take Follistatin 344
                        • best time to take Ipamorelin
                        • best time to take MK-677 (Ibutamoren)
                        • best time to take Ligandrol (LGD-4033) — research compound
                        • best time to take Ostarine (MK-2866) — research compound
                        • best time to take GHK-CU
                        • best time to take TB-500
                        • best time to take MOTS-c
                        • best time to take Semax
                        • best time to take RAD-140 (Testolone) — research compound
                        • best time to take Thymosin Alpha-1
                        • best time to take PEG-MGF
                        • Biolife Plasma, Octapharma Plasma, and Research Peptides: How Plasma Donation Labs Differ From Peptide Suppliers
                        • best time to take YK-11 — research compound
                        • best time to take PT-141 (Bremelanotide)
                        • Best research protocol Klow blend
                        • 5-Amino-1MQ and MOTS-C Synergy: Metabolic Signaling, Mitochondria, and Research Design
                        • BPC-157 and TB-500: Investigating Their Combined Effects on Angiogenesis and Cellular Migration in Tissue Repair Models
                        • BPC-157 Peptide: Gut Barrier Function, Inflammation, and Tissue-Recovery Research
                        • 5‑Amino‑1MQ and MOTS‑c Synergy in Metabolic Research: Designing NNMT and Mitochondrial Biogenesis Stacks
                        • CJC-1295 with DAC vs. Without DAC: Half-Life, Release Kinetics, and Research Implications
                        • CJC‑1295 with DAC vs. Without DAC: Expanding on Half‑Life Differences Using Tesamorelin and Ipamorelin Blend Case Studies
                        • Collagen Biology and Copper‑Binding Peptides: How GHK‑Cu, Glow Blend, and Klow Blend Interact with Skin and Connective Tissue
                        • Collagen Biology and Regenerative Peptides: How GHK‑Cu, Glow Blend, and Klow Blend Affect Extracellular Matrix Research
                    • DNA, Telomeres, and Longevity Peptides: Positioning Epithalon and MOTS‑c in Genetic Aging Research
                      • Enclomiphene Citrate: serm Mechanism, Testosterone Research, and Stack Compatibility
                        • Enclomiphene vs Enclomiphene Citrate: Formulation, Bioavailability, and Research Distinctions
                        • Epithalon Peptide Research: Telomerase Activation, Aging, and Pineal Gland Function
                        • Estrogen Receptor Signaling and Enclomiphene: How Selective Modulators Compare with Classic Polypeptide Hormones
                        • GHK-Cu Peptide: Advanced Mechanisms in Extracellular Matrix Remodeling and Wound Healing Research
                        • GHK-Cu Peptide: Collagen Synthesis, Wound Repair, and Skin-Barrier Research Models
                        • GLP-1 vs GLP-3 vs GLP-2: Peptide Classification and Research Applications
                        • GLP-2 Peptide Research Guide: Gut Barrier Function, Nutrient Absorption, and Intestinal Recovery Models
                        • GLP-3 Retatrutide vs. GLP-1 Drugs: What Triple-Agonist Biology Changes in Research Models
                        • Ipamorelin and Tesamorelin Combination: Synergistic GH Secretagogue Research and Dosing Protocols
                        • GLP2 Tirz Peptide: What It Is, Why the Name Exists, and How Researchers Should Interpret It
                        • Klow Blend Peptide Nasal Spray: What the Formulation Is Trying to Do in Cognitive Research
                        • Mitochondria, NNMT Inhibition, and Peptide Modulators: Where MOTS‑c and 5‑Amino‑1MQ Fit in Cellular Energy Research
                        • MOTS-c Peptide: Mitochondrial Function, Energy Metabolism, and What Researchers Measure
                        • MOTS-c vs. 5-Amino-1MQ: Which Metabolic Research Questions Each Compound Actually Answers
                        • Nasal Spray Peptides: Bioavailability, Administration, and Semax/Selank Research Applications
                        • PT-141 Peptide Research: Mechanism of Action and Melanocortin Receptor Signaling
                        • Retatrutide for Research: Mechanism, Structure, and GLP-1/GLP-3 Dual Action
                        • Retatrutide for Obesity and Type 2 Diabetes: What the Latest Trial Data Suggest
                        • Tesofensine Peptide Research: Mechanism, Appetite Suppression, and Neuropeptide Y Pathways
  • Contact
    • Contact Customer Service
    • Text Customer Support
  • About US
  • Shop all peptides
  • Affiliate Program
    • Affiliate Signup
  • Login / Register Login / Register Page Link Login / Register Page Link
  • Click to open the search input field Click to open the search input field Search
  • Menu Menu
Retatrutide Research Alternatives: Comparing Incretin Peptides, Tesofensine, and Metabolic Small Molecules by Endpoint Fit

Retatrutide Research Alternatives: Comparing Incretin Peptides, Tesofensine, and Metabolic Small Molecules by Endpoint Fit

October 9, 2026/0 Comments/in Uncategorized/by

Selecting the wrong compound for a metabolic research model does not just waste resources, it produces uninterpretable data. That problem is the core reason why retatrutide research alternatives: comparing incretin peptides, tesofensine, and metabolic small molecules by endpoint fit has become one of the most practical questions in preclinical and translational obesity science as of 2026. With retatrutide's TRIUMPH phase 3 program delivering landmark results, including a 23.7% mean body-weight reduction at 68 weeks in the TRIUMPH-4 trial, researchers now need a rigorous framework for matching comparator compounds to specific endpoint targets, not to marketing claims.

Key Takeaways

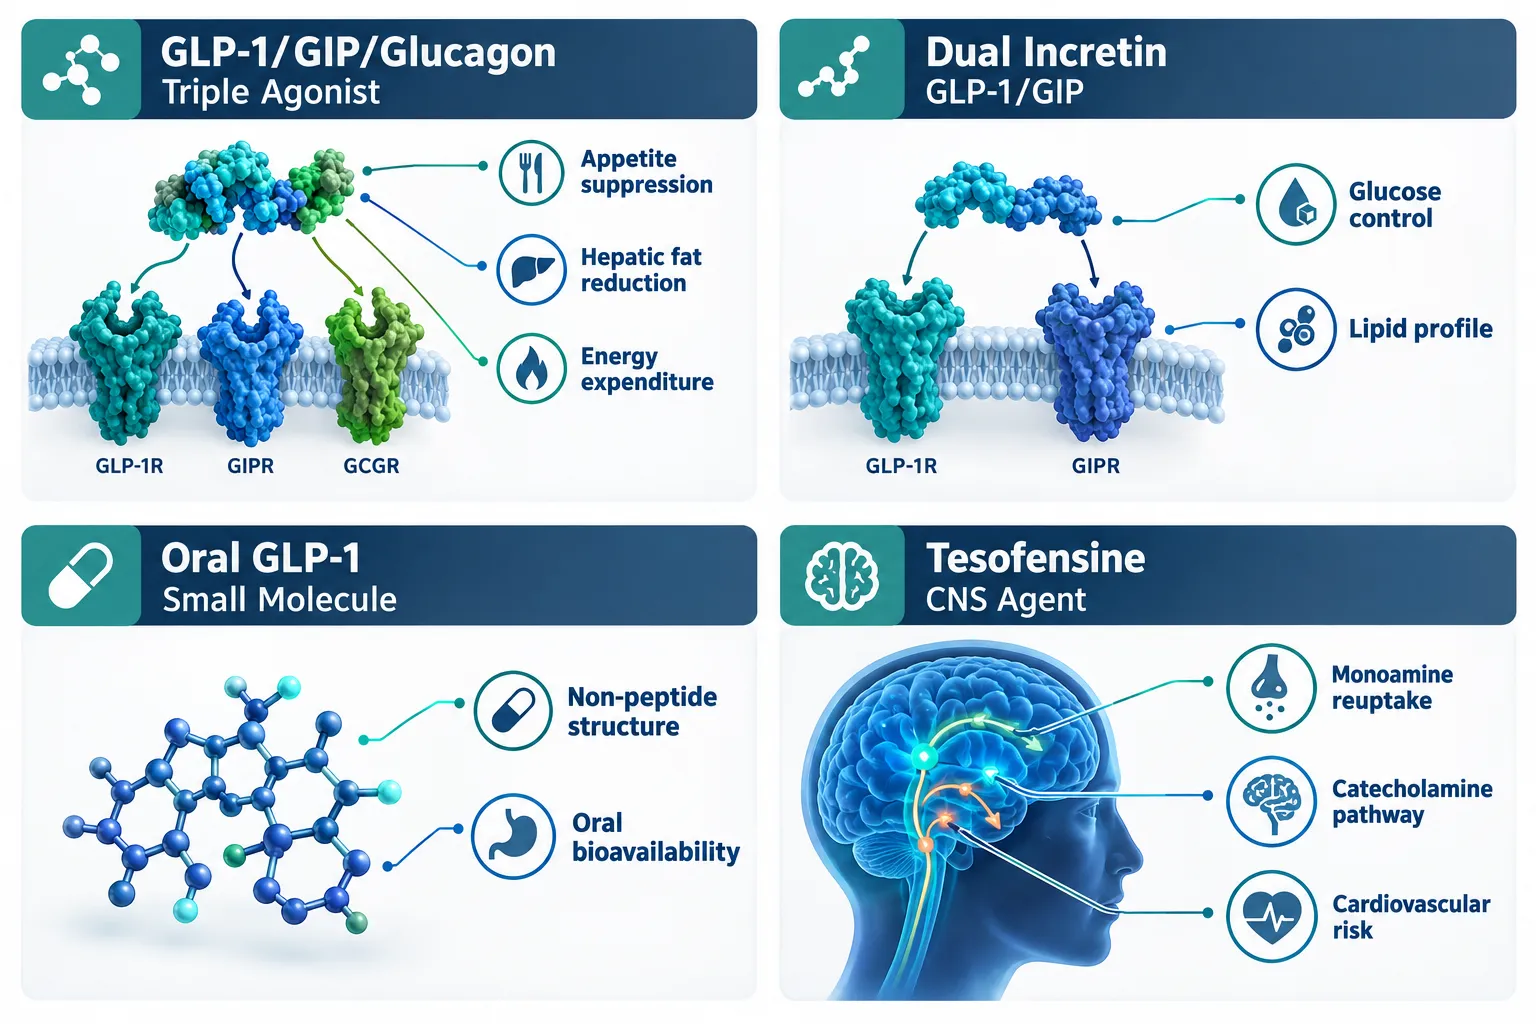
  • Retatrutide's triple agonist mechanism (GLP-1, GIP, glucagon receptors) produces the broadest endpoint coverage of any current incretin peptide, making it a high-bar comparator.
  • Dual incretin peptides like tirzepatide suit glucose and lipid endpoints but offer narrower energy-expenditure signaling than triple agonists.
  • Oral GLP-1 small molecules such as orforglipron expand access research but carry less mature phase 3 data than injectable incretin peptides.
  • Tesofensine addresses catecholamine and central appetite pathways but carries cardiovascular safety concerns that limit endpoint compatibility.
  • Model selection should begin with the primary endpoint, appetite, glucose, lipid, energy expenditure, catecholamine, or receptor signaling, before choosing a compound.

Why Endpoint Fit Matters More Than Compound Popularity

The metabolic research field in 2026 is crowded with potent compounds, and popularity is a poor proxy for scientific fit. Retatrutide simultaneously activates GLP-1, GIP, and glucagon receptors, generating overlapping signals across appetite suppression, hepatic fat clearance, insulin secretion, and thermogenesis. Phase 2 data showed approximately 82% relative reduction in liver fat alongside a 24.2% mean weight loss at 48 weeks with the 12 mg dose. That breadth is valuable, but it also means retatrutide is a noisy tool when a study only needs to isolate one pathway.
Why Endpoint Fit Matters More Than Compound Popularity

A decision matrix built around the primary research endpoint cuts through this complexity. The six endpoint categories most relevant to metabolic compound selection are:

  • Appetite / satiety signaling, hypothalamic and vagal pathways
  • Glucose homeostasis, insulin secretion, HbA1c, fasting plasma glucose
  • Lipid metabolism, hepatic fat, triglycerides, LDL/HDL profiles
  • Energy expenditure, thermogenesis, resting metabolic rate, glucagon-driven brown adipose activation
  • Catecholamine / monoamine signaling, dopamine, norepinephrine, serotonin reuptake
  • Receptor-level signaling fidelity, clean agonism at a single receptor vs. multi-receptor crosstalk

Mapping each compound to these categories before designing a protocol prevents the most common error in metabolic research: choosing a compound because it produces the largest weight-loss number rather than because it isolates the pathway under investigation.


Incretin Peptides: Where Retatrutide and Its Closest Alternatives Sit

Among injectable incretin peptides, the comparison landscape in 2026 centers on three tiers of receptor engagement.

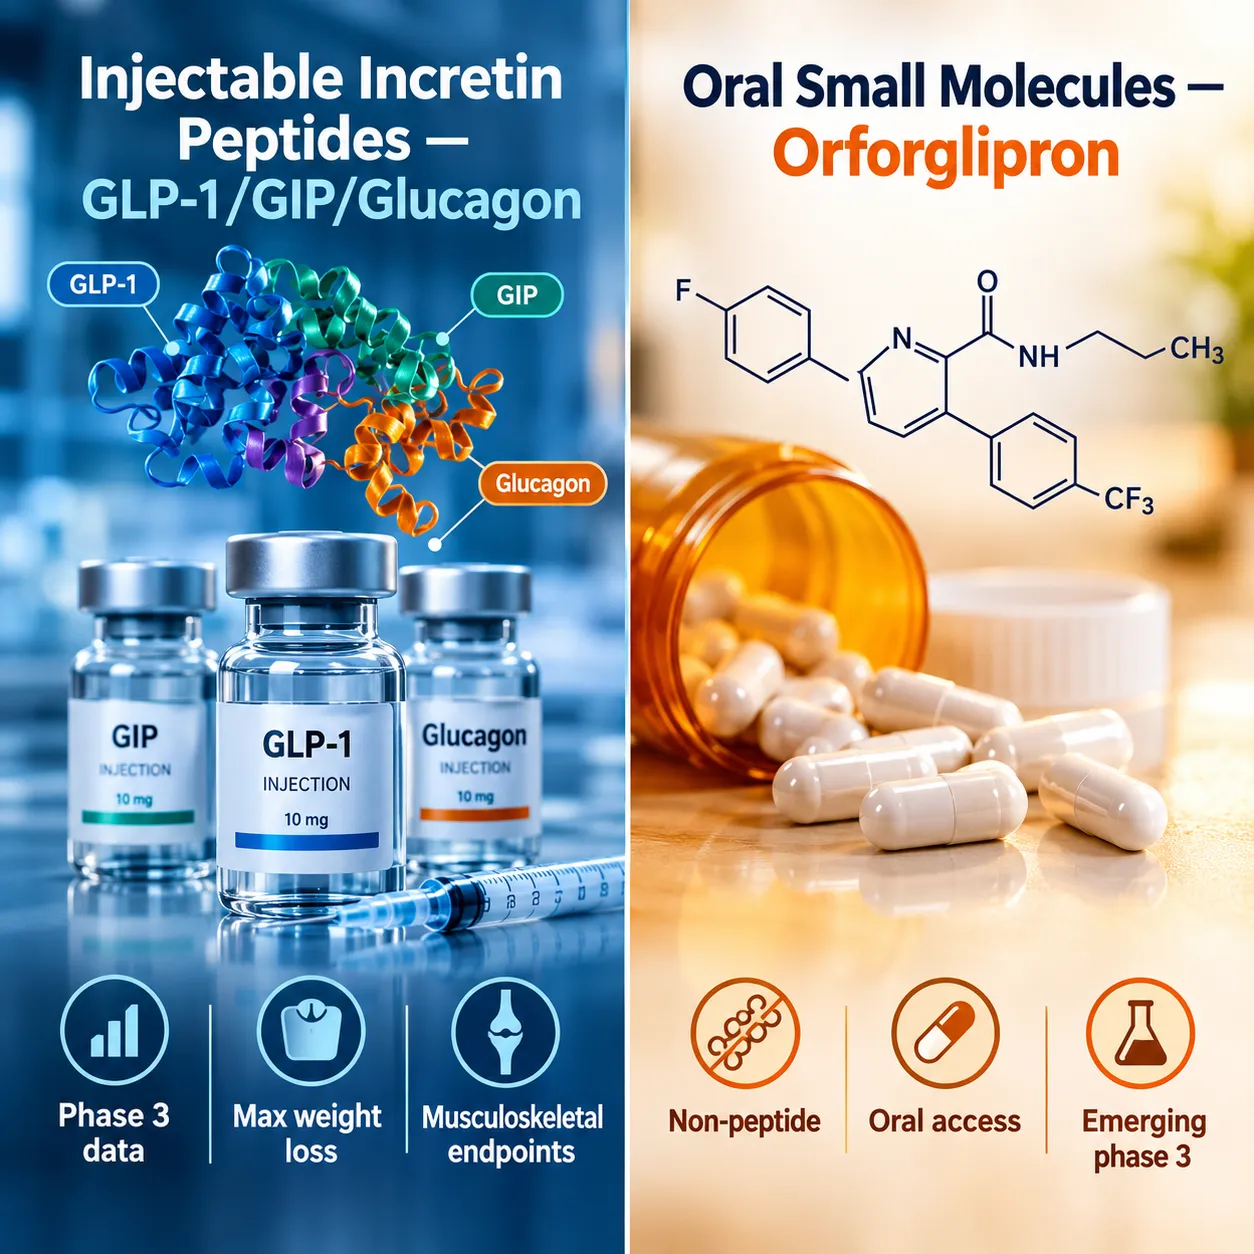
Retatrutide (GLP-1 / GIP / Glucagon triple agonist) is the highest-coverage option. The meta-analytic evidence across three randomized controlled trials confirms mean weight reduction of approximately 14.33%, BMI reduction of 5.38 units, and meaningful improvements in fasting plasma glucose, HbA1c, and blood pressure, all at very low statistical significance thresholds. For researchers studying retatrutide endpoints that span weight, metabolic, and musculoskeletal outcomes simultaneously, this breadth is the primary advantage. The TRIUMPH program's pairing of weight loss with pain endpoints in TRIUMPH-4 (knee osteoarthritis) and TRIUMPH-7 (chronic low back pain) illustrates this endpoint-fit strategy explicitly.

Tirzepatide (GLP-1 / GIP dual agonist) is the closest comparator for glucose and lipid endpoints without glucagon-driven thermogenesis. TRIUMPH-5 will provide direct head-to-head data against retatrutide in obesity, which will clarify how much the glucagon arm contributes to incremental weight loss and energy expenditure. Until those data arrive, tirzepatide remains the preferred compound when glucagon receptor crosstalk would confound interpretation.

Single GLP-1 receptor agonists (semaglutide class) offer the cleanest receptor-signaling fidelity for studies where isolating GLP-1R biology is the goal. For a broader overview of how these peptide classes are structured mechanistically, the Peptides 101 for Research-Use Only Buyers resource provides a useful structural and mechanistic foundation.

Researchers sourcing GLP-3/retatrutide analogs for preclinical work can review GLP-3 peptides for research use or explore lab tested peptides verified by third-party analysis to ensure compound integrity before endpoint data collection begins.


Tesofensine and Oral Small Molecules: Endpoint Fit for Catecholamine and Access Research
Tesofensine and Oral Small Molecules: Endpoint Fit for Catecholamine and Access Research

Tesofensine: A Legacy CNS Tool With a Narrow Endpoint Window

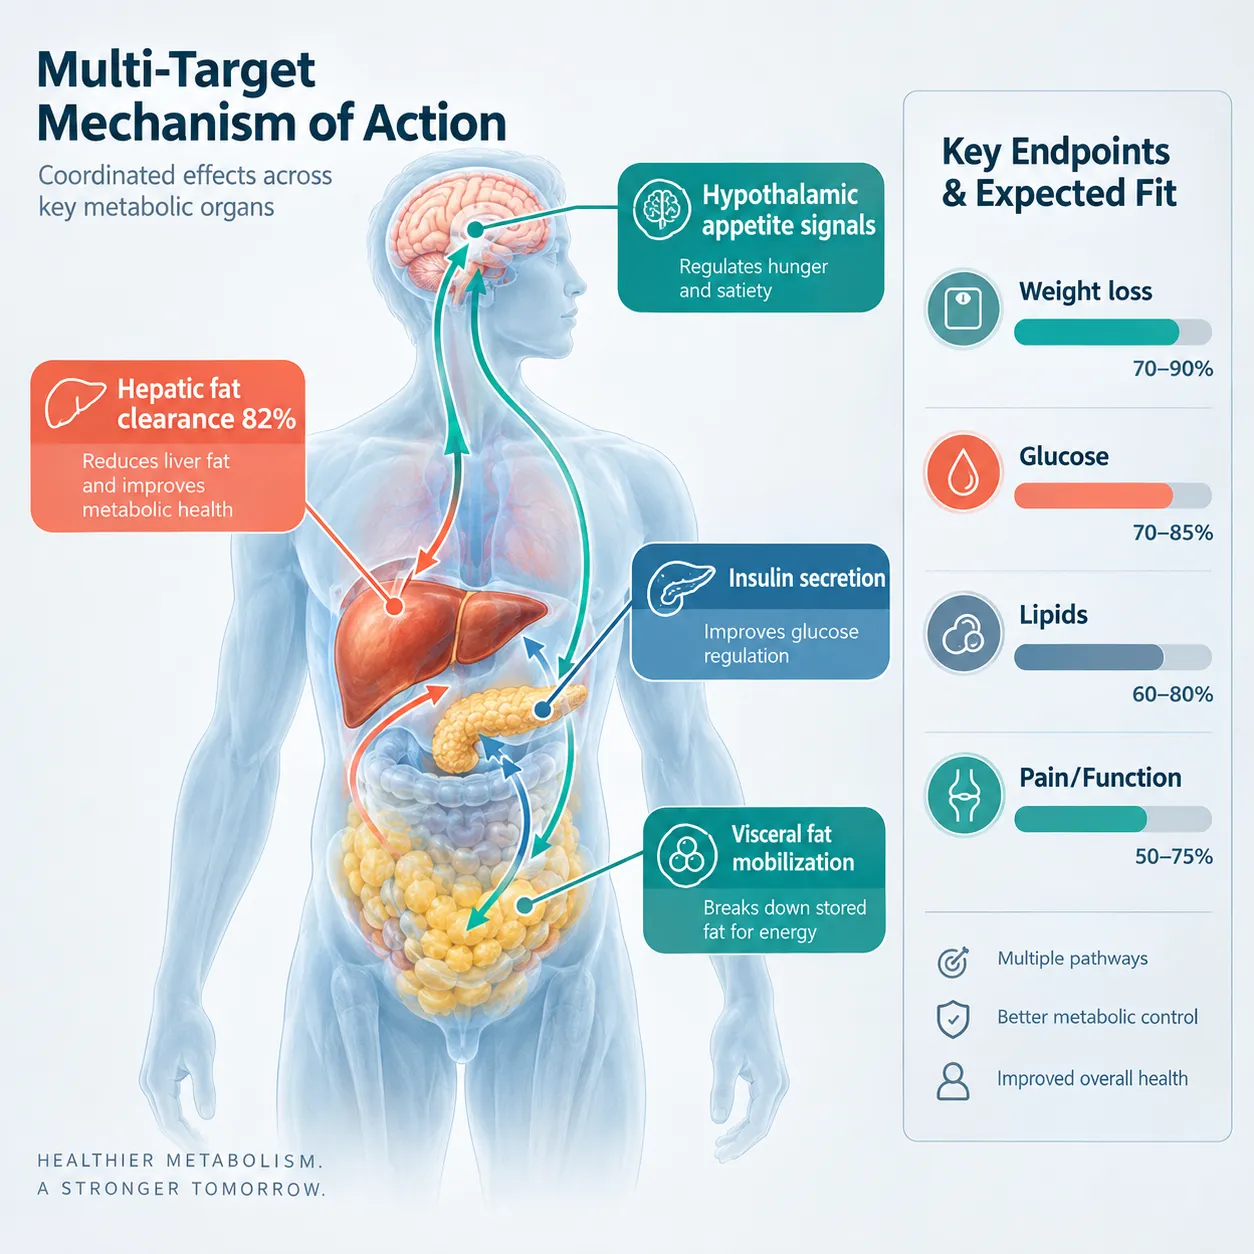
Tesofensine is a centrally acting triple monoamine reuptake inhibitor, blocking dopamine, norepinephrine, and serotonin reuptake, originally developed for neurodegenerative conditions. In mid-2000s obesity trials, it produced roughly 10-12% weight loss over approximately 24 weeks. That figure is meaningful in absolute terms but is substantially below the 20-24% range seen with retatrutide at higher doses.

More importantly, tesofensine's endpoint fit is narrow and specific:

Endpoint Category Tesofensine Fit Retatrutide Fit
Appetite / CNS satiety Strong (catecholamine) Strong (incretin)
Glucose homeostasis Weak Strong
Hepatic lipid reduction Weak Strong (~82% relative)
Energy expenditure Moderate (sympathomimetic) Strong (glucagon arm)
Cardiovascular safety margin Narrow (HR/BP elevation) Broader (phase 3 data)
Musculoskeletal pain endpoints Not established Active (TRIUMPH-4, 7)

Tesofensine is a legitimate research tool when the study question specifically involves catecholamine-mediated appetite suppression or monoamine pathway modulation. It is not a frontline alternative for glucose, lipid, or energy-expenditure endpoints, and its cardiovascular signal, increased heart rate and blood pressure, introduces confounders in cardiometabolic models. As of 2026, no new phase 3 obesity program for tesofensine has been widely reported, confirming its position as a legacy pharmacologic comparator rather than a contemporary competitor.

Oral GLP-1 Small Molecules: Orforglipron and the Access Endpoint

Orforglipron represents a structurally distinct category: a non-peptide, oral GLP-1 receptor agonist evaluated in the ATTAIN-1 trial for obesity. Its primary research value is not maximum weight-loss magnitude but oral bioavailability and adherence modeling. For studies where the endpoint involves treatment access, patient adherence behavior, or oral-route pharmacokinetics, orforglipron and related oral GLP-1 receptor agonists are the appropriate comparators.

The tradeoff is data maturity. As of early 2026, oral GLP-1 small molecules carry less complete phase 3 obesity data than injectable incretin peptides. Researchers designing studies that will need to reference a robust efficacy benchmark should note this gap when selecting comparators.


Building the Decision Matrix: Matching Compound to Research Question

The practical output of this analysis is a compound-selection protocol driven by the primary endpoint, not by compound prestige. The framework below summarizes the match:

Use retatrutide or a GLP-3 analog when:

  • The primary endpoint spans weight, metabolic markers, and functional outcomes simultaneously
  • Visceral fat research is a core outcome
  • Energy expenditure and glucagon-receptor biology are within scope

Use a dual incretin (tirzepatide class) when:

  • Glucose and lipid endpoints are primary, and glucagon-arm crosstalk would confound
  • Head-to-head incretin comparison is the study design

Use a single GLP-1 agonist when:

  • Receptor-signaling fidelity at GLP-1R alone is required
  • The study needs the cleanest possible GLP-1 pathway attribution

Use tesofensine when:

  • The research question is explicitly about monoamine reuptake inhibition or catecholamine-mediated satiety
  • Cardiovascular confounders are controlled for or are themselves the endpoint

Use oral GLP-1 small molecules when:

  • The endpoint involves oral-route pharmacology, adherence, or access modeling
  • Injectable peptide format is a study constraint
Building the Decision Matrix: Matching Compound to Research Question

Researchers reviewing the full retatrutide clinical trials landscape, including TRIUMPH-1 through TRIUMPH-8, will find that Eli Lilly's own endpoint-fit strategy mirrors this matrix: each TRIUMPH sub-study pairs retatrutide's weight-loss mechanism with a distinct comorbidity endpoint, from knee osteoarthritis pain to chronic low back pain to long-term weight maintenance. That design logic is directly transferable to preclinical model selection.

For researchers sourcing compounds, the TESA IPA blend peptide page offers a relevant example of how multi-mechanism blends are positioned for specific research applications, reinforcing the endpoint-fit principle at the product level.


Conclusion

The most consequential decision in metabolic peptide research is not which compound produces the largest effect size, it is which compound isolates the pathway the study is actually designed to interrogate. Retatrutide research alternatives: comparing incretin peptides, tesofensine, and metabolic small molecules by endpoint fit is not an academic exercise; it is a protocol-design requirement.

Actionable next steps for research teams in 2026:

  1. Define the primary endpoint category first, appetite, glucose, lipid, energy expenditure, catecholamine, or receptor signaling, before shortlisting compounds.
  2. Use retatrutide or GLP-3 analogs for broad metabolic and functional endpoint studies; use single-receptor agonists when signaling fidelity is paramount.
  3. Reserve tesofensine for CNS monoamine pathway studies with appropriate cardiovascular controls.
  4. Monitor TRIUMPH phase 3 readouts through 2026 to update the efficacy benchmarks used in comparator selection.
  5. Verify compound purity through third-party testing before any endpoint data collection begins, using lab tested peptides from verified suppliers.

Endpoint fit, not headline weight-loss numbers, is the standard that produces reproducible, interpretable metabolic research.

https://www.puretestedpeptides.com/wp-content/uploads/2026/10/retatrutide-research-alternatives-comparing-incretin-peptides-tesofensine-and-me.webp 672 1008 https://www.puretestedpeptides.com/wp-content/uploads/2026/01/buy-peptides-online.jpg 2026-10-09 13:10:262026-10-09 13:10:26Retatrutide Research Alternatives: Comparing Incretin Peptides, Tesofensine, and Metabolic Small Molecules by Endpoint Fit
LDL Cholesterol and Peptide Research: How to Interpret Lipid Changes When Weight Loss and Food Intake Also Shift

LDL Cholesterol and Peptide Research: How to Interpret Lipid Changes When Weight Loss and Food Intake Also Shift

October 9, 2026/0 Comments/in Uncategorized/by

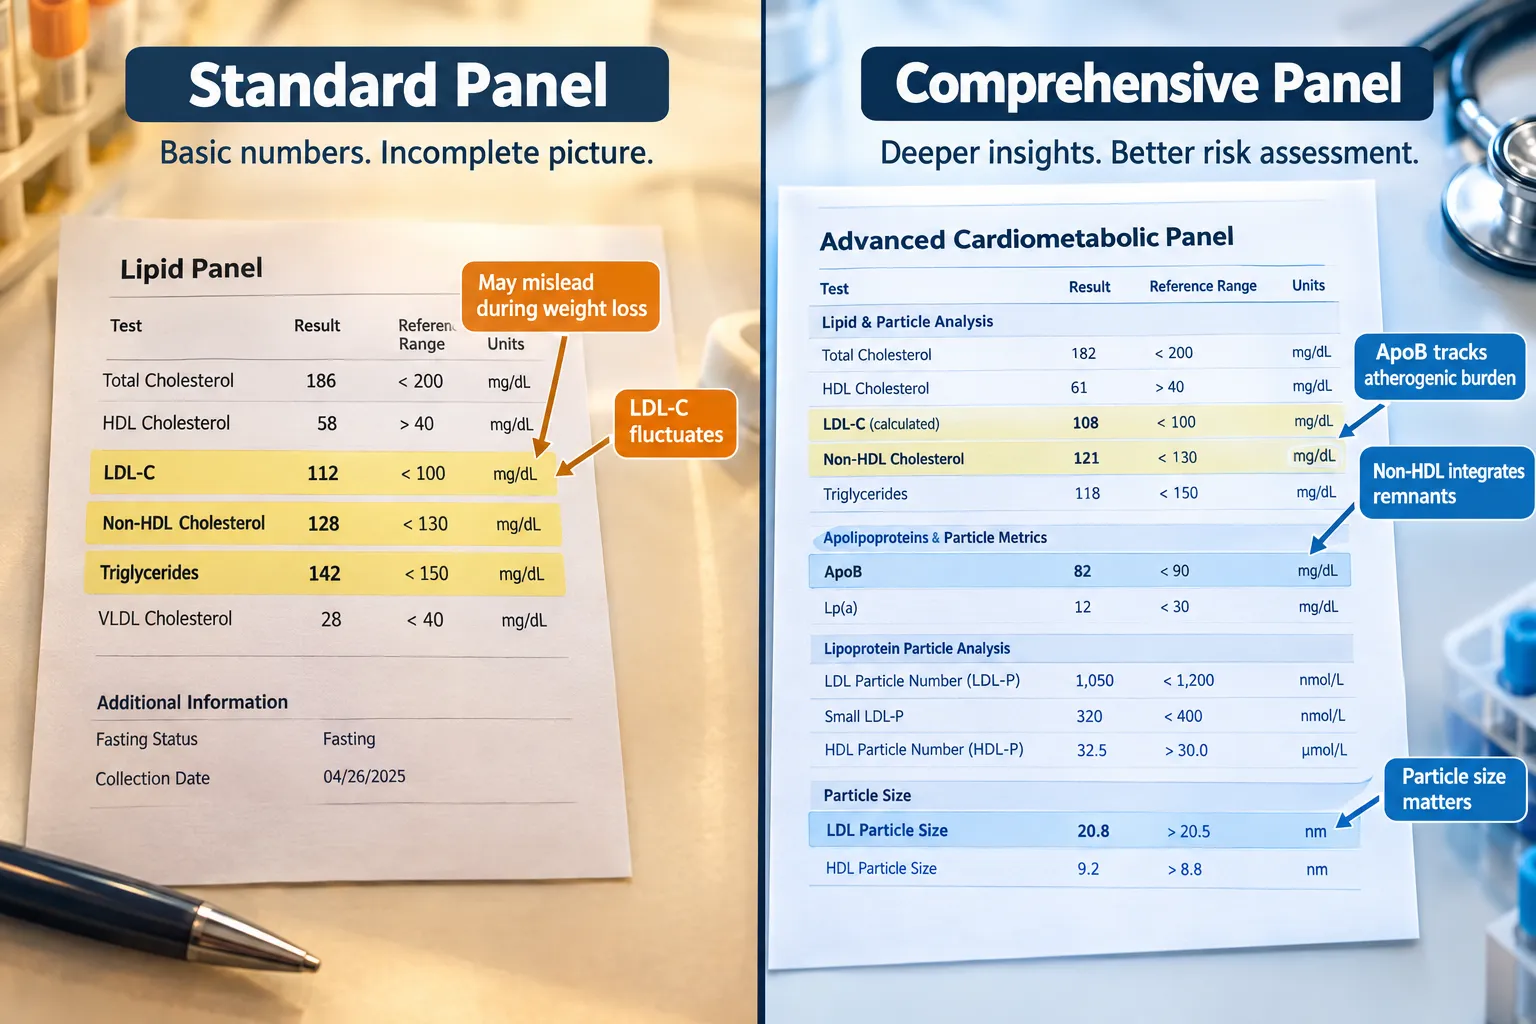
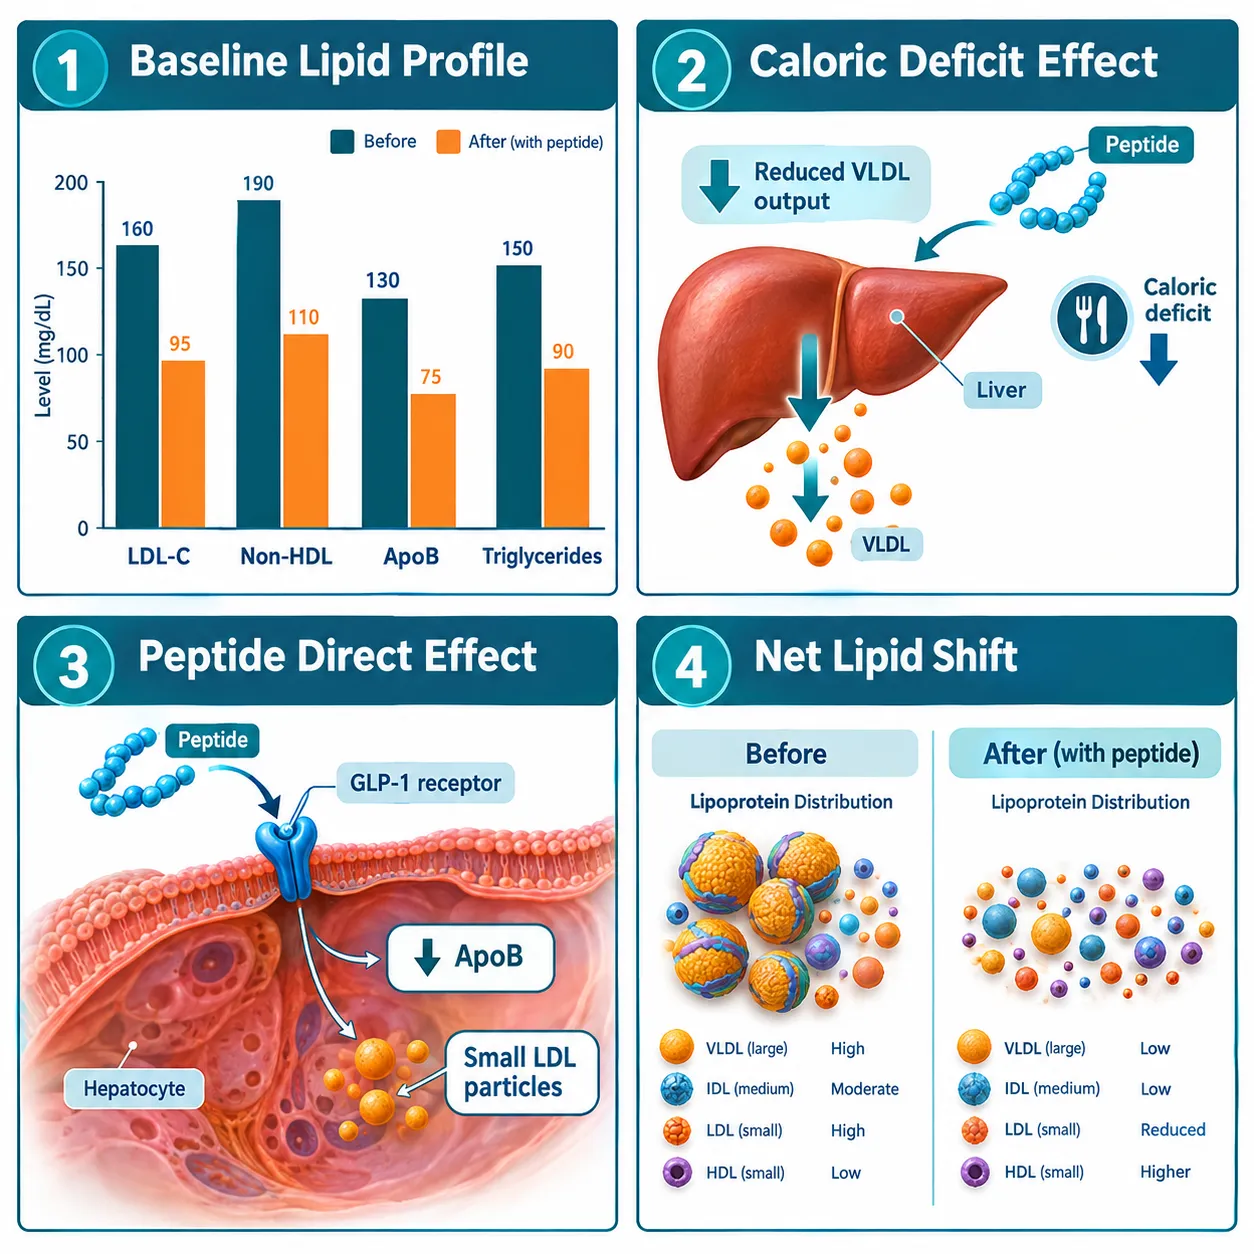
Across tirzepatide trials, LDL cholesterol falls by roughly 10 to 20 percent at therapeutic doses, yet in at least one large obesity trial, LDL-C actually rose slightly while every other atherogenic marker improved. That apparent contradiction is not a flaw in the data. It is a signal that standard LDL-C readings during active weight loss and dietary change are notoriously difficult to interpret without a causal framework. For anyone working in LDL cholesterol and peptide research, understanding how to interpret lipid changes when weight loss and food intake also shift is the difference between drawing the right conclusion and acting on noise.

Key Takeaways

  • LDL-C alone is an unreliable endpoint during active weight loss; ApoB and non-HDL cholesterol are more informative markers of atherogenic risk.
  • Peptide-driven lipid improvements are mediated partly by direct receptor signaling and partly by caloric restriction and body-fat reduction, separating these effects requires baseline stratification.
  • Triglycerides and HDL-C tend to respond most strongly to weight loss, while LDL-C changes are smaller and more variable.
  • Diet quality independently shapes the lipid response to peptides; Mediterranean-style eating amplifies favorable shifts.
  • Re-evaluating statin intensity after weight stabilizes, not during active loss, produces more accurate clinical decisions.

Why LDL-C Behaves Differently During Peptide-Driven Weight Loss

When a research subject or patient loses significant body weight through a peptide protocol, several metabolic processes change at once. Hepatic VLDL secretion decreases as visceral fat mass shrinks. Postprandial triglyceride clearance improves. Insulin sensitivity rises, reducing the liver's drive to overproduce atherogenic lipoproteins. All of these shifts affect the lipoprotein pool in ways that do not always move LDL-C in a straight line.

Why LDL-C Behaves Differently During Peptide-Driven Weight Loss

The cholesterol-ester transfer protein (CETP) pathway partly explains the paradox. As triglycerides fall sharply, a consistent finding across GLP-1 and dual GIP/GLP-1 agonist studies, CETP-mediated exchange between VLDL and LDL particles slows. This can temporarily raise LDL-C on a standard panel even as the actual number of atherogenic particles, measured by ApoB, falls. The SURMOUNT-2 obesity trial observed a small LDL-C increase of roughly 2 to 3 percent at certain doses, yet post-hoc particle analysis showed reduced ApoB, fewer small dense LDL particles, and lower remnant cholesterol, a genuinely less atherogenic profile hidden behind a misleading headline number.

This is why researchers exploring what is the strongest peptide for weight loss must pair efficacy data with a full lipoprotein panel rather than relying on LDL-C alone.

Key principle: A rising LDL-C during rapid weight loss does not automatically indicate increased cardiovascular risk. Context is everything.


A Causal-Analysis Framework for LDL Cholesterol and Peptide Research

Interpreting lipid changes when weight loss and food intake also shift requires treating the lipid panel as an outcome with multiple upstream causes, not a single drug effect. The following framework applies mediation-analysis thinking to practical research settings.

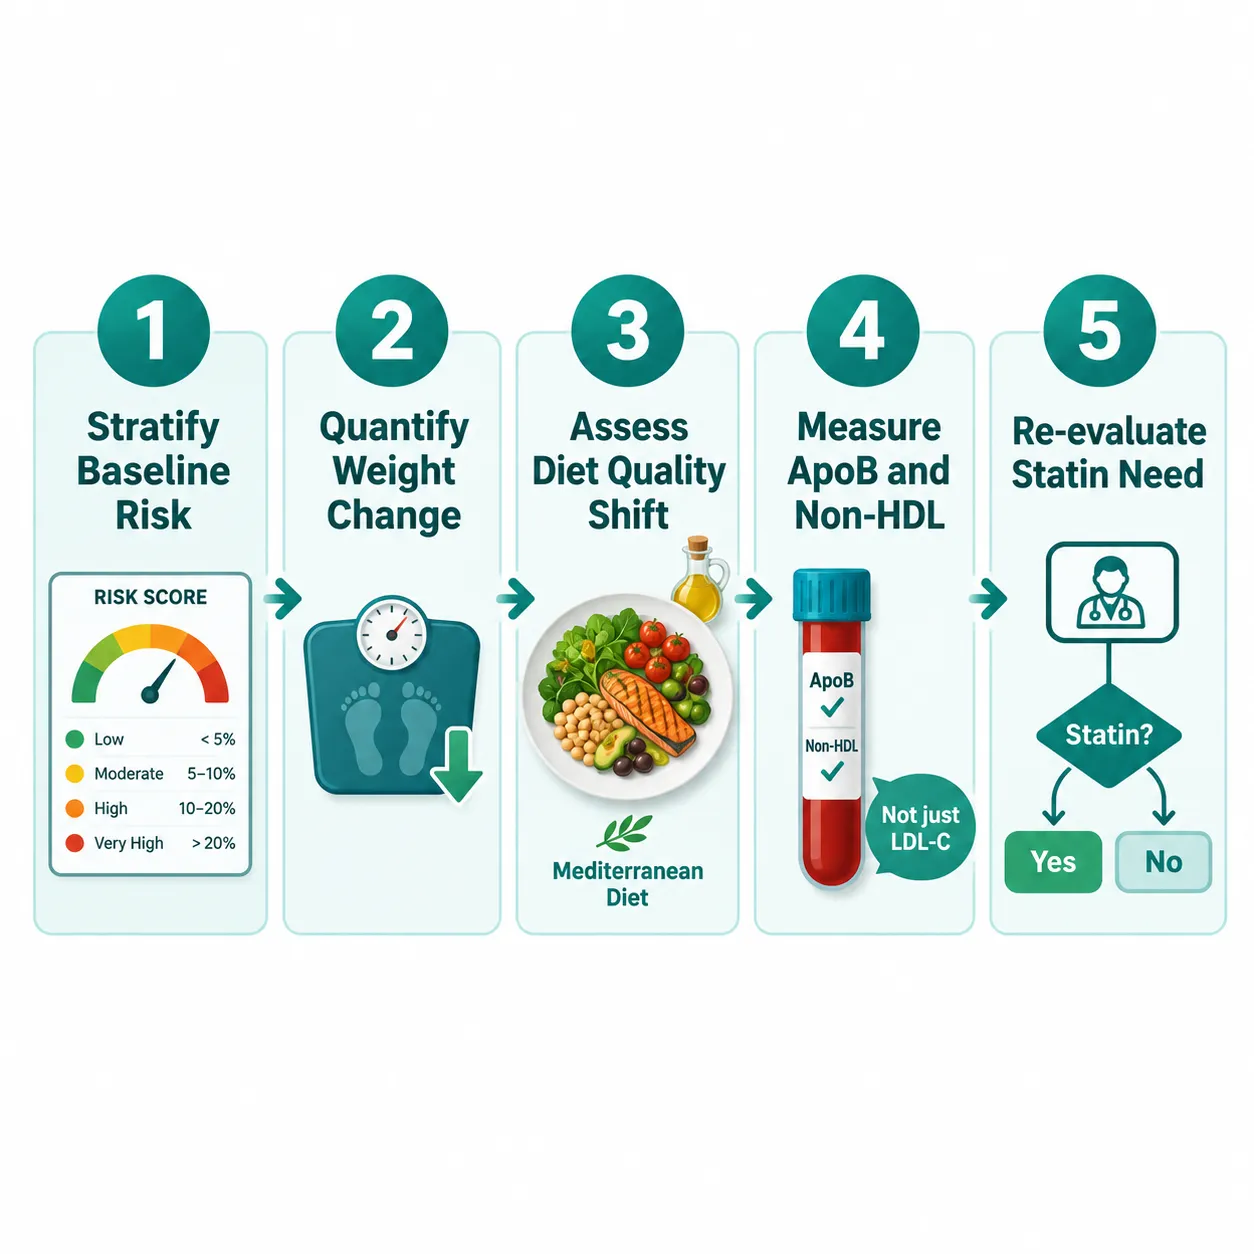
Step 1: Stratify Baseline Risk Before Intervention

Lipid responses to peptides are not uniform. Participants with elevated baseline triglycerides (above 150 mg/dL) and low HDL-C show the largest improvements, while those with near-normal baseline values show modest or negligible shifts. This is consistent with regression to the mean, but it also reflects the metabolic phenotype driving the abnormality in the first place.

Baseline stratification categories:

Baseline Profile Expected LDL-C Response Priority Marker
High TG, low HDL-C Moderate LDL-C fall TG and ApoB
Isolated high LDL-C Small or variable change ApoB and non-HDL
Mixed dyslipidemia Broad improvement Non-HDL cholesterol
Near-normal lipids Minimal change Particle size

Step 2: Separate Weight-Loss Mediation from Direct Peptide Effects

Real-world data show that combining Mediterranean diet adherence with a GLP-1/GIP agonist produces total cholesterol reductions from roughly 194 to 184 mg/dL and LDL-C drops from about 116 to 109 mg/dL, modest numbers that reflect the additive contribution of diet quality. Without controlling for dietary change, attributing the entire LDL shift to the peptide overstates the pharmacological effect.

Researchers using compounds such as GLP-3R peptide formulations or studying GLP-3 peptide signaling pathways should record dietary intake changes alongside lipid panels to allow proper mediation analysis.

Step 3: Prioritize ApoB and Non-HDL Cholesterol Over LDL-C

"Non-HDL cholesterol functions as a practical integrator of all atherogenic lipoprotein fractions, it captures remnant particles that LDL-C misses entirely."

Post-hoc analysis of the three-year SURMOUNT-1 trial found that tirzepatide significantly increased the proportion of participants achieving more than 10 percent non-HDL cholesterol reduction alongside meaningful weight loss and blood pressure improvements. Non-HDL cholesterol captures VLDL remnants, IDL, and Lp(a) contributions that a standard LDL-C calculation ignores, making it far more reliable when the lipoprotein pool is actively reshaping during weight loss.

ApoB is even more precise. A dose-dependent reduction in ApoB, large triglyceride-rich lipoproteins, and small LDL particles has been documented across tirzepatide dose ranges from 5 to 15 mg, confirming a genuinely less atherogenic profile even when LDL-C moves inconsistently.

For foundational context on how peptide classes interact with metabolic pathways, see Peptides 101 for research-use-only buyers.


Applying the Framework: Practical Interpretation of Lipid Panels

Applying the Framework: Practical Interpretation of Lipid Panels

When LDL-C and peptide research intersect with active weight loss, a structured interpretation protocol prevents misclassification of results.

Interpreting common scenarios:

  • LDL-C falls, ApoB falls: Genuine atherogenic improvement. Weight loss and peptide effects are aligned.
  • LDL-C rises slightly, ApoB falls: Likely CETP-mediated redistribution. Risk has not increased; do not escalate lipid therapy.
  • LDL-C unchanged, TG falls sharply: Weight-loss-driven improvement dominant. Recheck after weight stabilizes.
  • LDL-C unchanged, ApoB unchanged: Consider underlying familial hypercholesterolemia or poor dietary adherence. Peptide effect on LDL is modest by design.

Oral peptide formulations such as orforglipron at higher doses produce cardiometabolic improvements on composite indices including LDL-C, HDL-C, and triglycerides that are comparable to injectable semaglutide, but these improvements are driven predominantly by changes in energy intake and body weight rather than direct potent LDL-lowering. This distinction matters for setting realistic expectations in research protocols.

For researchers studying metabolic peptides with overlapping mechanisms, MOTS-C peptide and 5-amino-1MQ combinations offer additional context on energy metabolism pathways that intersect with lipid regulation.

Triple agonists such as retatrutide, which targets GIP, GLP-1, and glucagon receptors simultaneously, have produced mean weight losses exceeding 25 percent in recent trials. At that magnitude of fat loss, LDL-C, triglycerides, and blood pressure all improve, but re-evaluating statin intensity should wait until weight stabilizes, since ongoing lipoprotein remodeling during active loss creates a moving target.

Important note on statin therapy: French consensus guidance and NIH-linked reviews both emphasize that statins remain first-line therapy for LDL-C and ApoB targets. Peptide-induced lipid improvements complement statin therapy; they do not replace it for high-risk individuals.


Timing, Dosing, and Re-Evaluation Checkpoints

Timing, Dosing, and Re-Evaluation Checkpoints

The timing of lipid measurements relative to weight-loss trajectory matters considerably. Early measurements at 12 weeks reflect initial metabolic disruption and may not represent steady-state lipoprotein levels. A 2026 real-world study found that lipid improvements at low doses of 2.5 to 5 mg weekly tracked closely with the rate of weight change rather than cumulative weight lost, meaning that a plateau in lipid improvement does not indicate loss of drug effect, but rather stabilization of the weight-loss-mediated pathway.

Recommended measurement checkpoints:

  1. Baseline (fasting, before peptide initiation)
  2. 12 weeks (early metabolic response, note active weight-loss phase)
  3. 6 months (partial weight stabilization)
  4. 12 months (near steady-state for most protocols)
  5. Post-stabilization (definitive lipid re-evaluation for statin decisions)

For researchers interested in peptide dosing protocols and their relationship to metabolic outcomes, aligning lipid measurement timing with dosing escalation schedules improves interpretive accuracy.

A meta-analysis pooling six randomized controlled trials of tirzepatide in type 2 diabetes confirmed consistent reductions in total cholesterol, triglycerides, LDL-C, and VLDL-C versus baseline or comparators, confirming that observed LDL changes reflect a real class effect rather than measurement noise, provided the analysis accounts for concurrent weight and dietary shifts.


Conclusion

LDL cholesterol and peptide research presents a genuine interpretive challenge when weight loss and food intake are simultaneously changing. The core takeaway for 2026 research practice is straightforward: treat LDL-C as one data point in a broader causal picture, not the primary endpoint. Prioritize ApoB and non-HDL cholesterol as the anchoring markers of atherogenic burden. Stratify participants by baseline lipid phenotype before drawing conclusions about drug effect size. Account for dietary quality as an independent variable. And time definitive lipid re-evaluations to coincide with weight stabilization, not active loss.

Actionable next steps for researchers and clinicians:

  • Add ApoB and non-HDL cholesterol to every lipid panel in peptide weight-loss protocols.
  • Document dietary pattern changes alongside pharmacological interventions.
  • Apply baseline stratification to set realistic expectations for LDL-C response magnitude.
  • Defer statin intensity adjustments until body weight has plateaued for at least 8 to 12 weeks.
  • Use non-HDL cholesterol reduction of more than 10 percent as a composite success marker rather than LDL-C alone.
https://www.puretestedpeptides.com/wp-content/uploads/2026/10/ldl-cholesterol-and-peptide-research-how-to-interpret-lipid-changes-when-weight.webp 1024 1536 https://www.puretestedpeptides.com/wp-content/uploads/2026/01/buy-peptides-online.jpg 2026-10-09 13:07:342026-10-09 13:07:34LDL Cholesterol and Peptide Research: How to Interpret Lipid Changes When Weight Loss and Food Intake Also Shift
GLP-3 Retatrutide and Oral GLP-1 Concepts: How Researchers Should Compare Exposure, Gastric Emptying, and Bioavailability

GLP-3 Retatrutide and Oral GLP-1 Concepts: How Researchers Should Compare Exposure, Gastric Emptying, and Bioavailability

October 9, 2026/0 Comments/in Uncategorized/by

}

Professional () hero image with 'GLP-3 Retatrutide and Oral GLP-1 Concepts' in crisp white modern centered on a deep teal

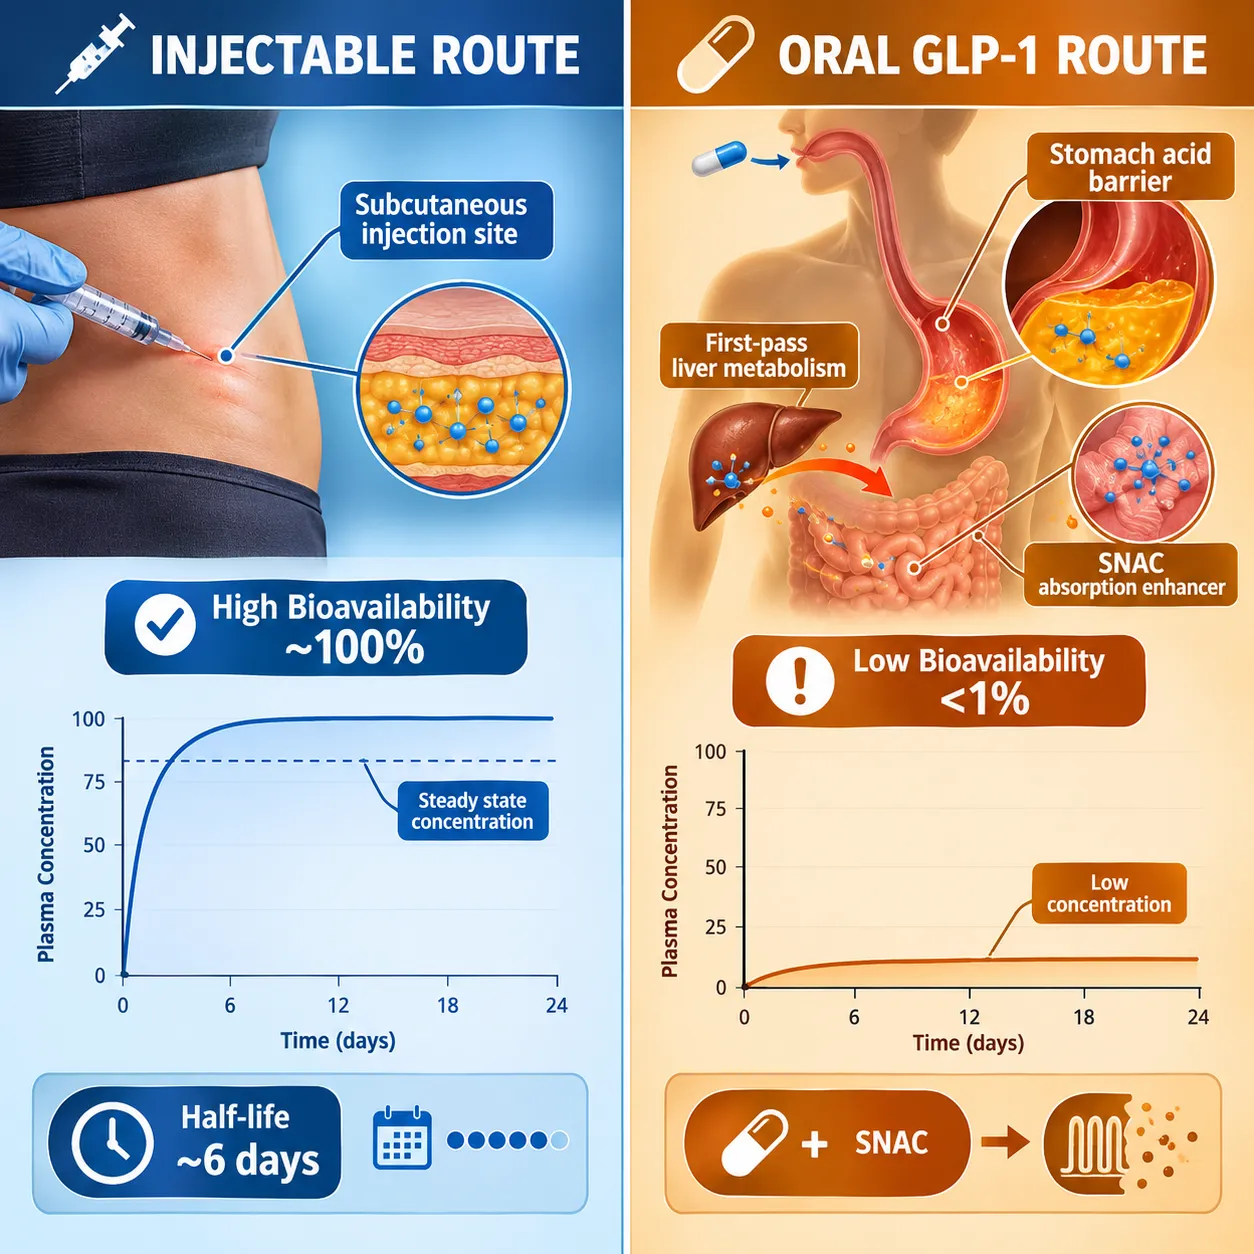
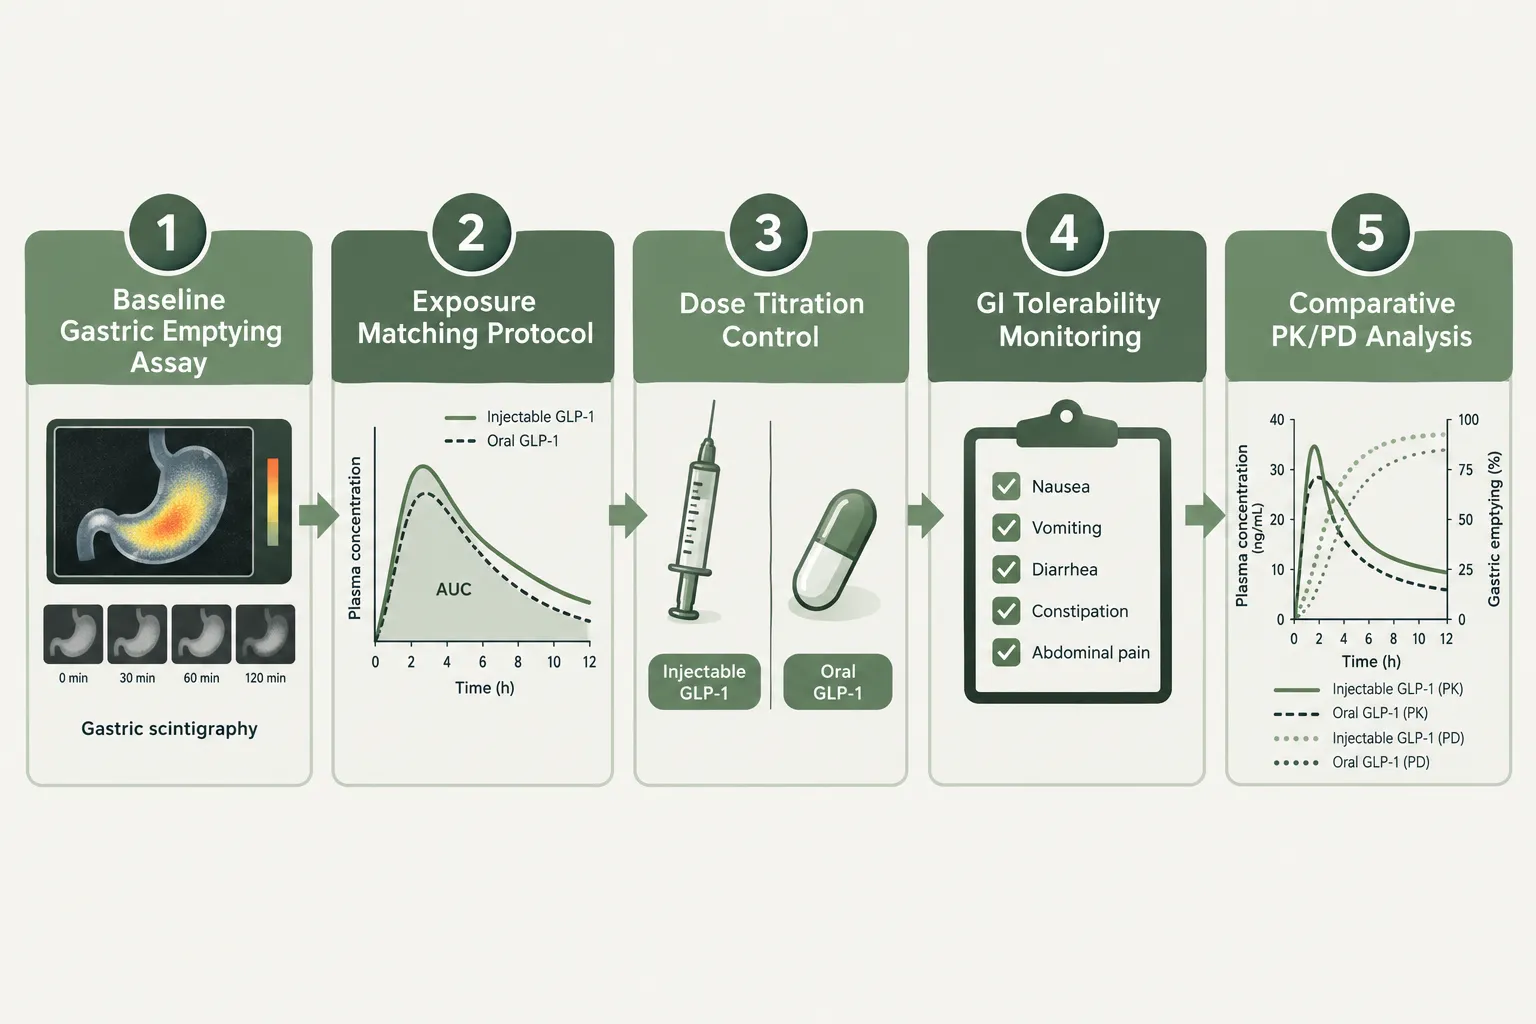
Fewer than one percent of an oral GLP-1 molecule typically survives the journey from stomach to systemic circulation, a stark contrast to the near-complete absorption seen with subcutaneous peptides. That single pharmacokinetic fact reshapes every study design attempting to compare retatrutide with oral GLP-1 agents. Understanding GLP-3 Retatrutide and Oral GLP-1 Concepts: How Researchers Should Compare Exposure, Gastric Emptying, and Bioavailability is not merely a matter of route preference; it demands rigorous attention to exposure matching, assay selection, and formulation controls before any meaningful head-to-head conclusion can be drawn.

Key Takeaways

  • Retatrutide is a triple agonist (GLP-1, GIP, and glucagon receptors), giving it a fundamentally different receptor profile than single-target oral GLP-1 agents.
  • Subcutaneous retatrutide achieves near-complete bioavailability; oral GLP-1 formulations typically reach less than 1%, requiring careful dose-normalization in comparative studies.
  • Gastric emptying slows significantly with retatrutide, but the effect attenuates over time, a tolerance pattern researchers must account for in endpoint timing.
  • Exposure matching via AUC and Cmax normalization is the critical first step before comparing pharmacodynamic outcomes across routes.
  • Study designs must control for formulation variables (e.g., SNAC absorption enhancers in oral agents) that independently affect gastric physiology.

Retatrutide's Molecular Profile and Why Route Matters

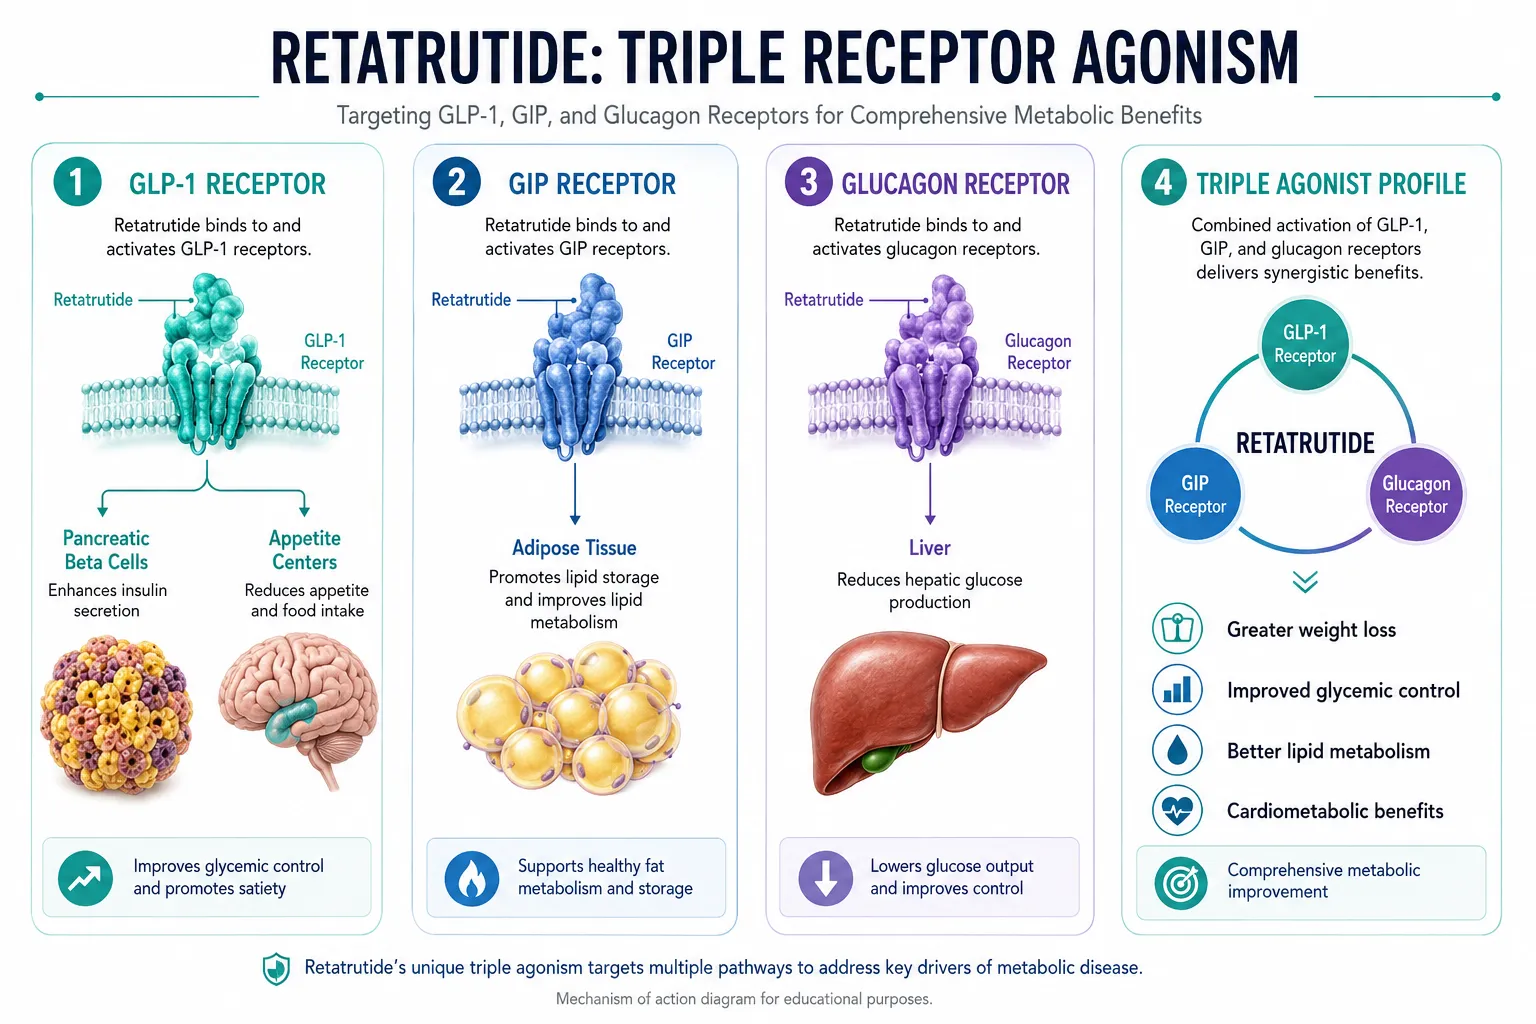
Retatrutide is a long-acting peptide that simultaneously activates GLP-1, GIP (glucose-dependent insulinotropic polypeptide), and glucagon receptors. This triple-agonist architecture sets it apart from oral GLP-1 receptor agonists, which typically target only the GLP-1 pathway. Researchers exploring GLP-1 Retatrutide mechanisms should note that the glucagon receptor component drives additional hepatic glucose output modulation and energy expenditure, effects absent from most oral comparators.

Retatrutide's Molecular Profile and Why Route Matters

Administered subcutaneously, retatrutide displays a half-life of approximately six days, enabling once-weekly dosing and predictable steady-state accumulation. Its bioavailability via this route approaches 100%. Oral GLP-1 agents, by contrast, face sequential degradation barriers: gastric acid, peptidase activity in the intestinal lumen, and extensive hepatic first-pass metabolism. Even with absorption enhancers such as sodium N-[8-(2-hydroxybenzoyl)amino]caprylate (SNAC), systemic exposure remains a fraction of the administered dose.

This gap is not a minor technical detail. It fundamentally changes what "equivalent dose" means across routes, and it is the first problem any comparative study design must solve.


Comparing Exposure: AUC Matching and Normalization Strategies

When researchers set out to apply GLP-3 Retatrutide and Oral GLP-1 Concepts: How Researchers Should Compare Exposure, Gastric Emptying, and Bioavailability to actual protocols, exposure normalization is the non-negotiable starting point. The standard approach uses area under the concentration-time curve (AUC) and peak plasma concentration (Cmax) as anchors.

Parameter Subcutaneous Retatrutide Oral GLP-1 Agent
Bioavailability ~100% <1%
Half-life ~6 days 12-14 hours (semaglutide oral)
Dosing frequency Once weekly Once daily
Steady-state variability Low Moderate-to-high

Key normalization steps for researchers:

  • Calculate molar AUC at steady state for each agent under study conditions.
  • Adjust oral doses iteratively until systemic AUC overlaps with the injectable comparator.
  • Document intra-subject variability in oral absorption, which is substantially higher than subcutaneous routes.
  • Account for food-state dependency: oral GLP-1 absorption drops sharply when taken with meals, while subcutaneous absorption is largely food-independent.

For labs sourcing materials, detailed product specifications for GLP-3 peptide (10mg, 99% pure, third-party tested) provide purity benchmarks that affect in vitro exposure calculations.


Gastric Emptying: Endpoints, Timing, and Tolerance

Gastric emptying slowing is a shared pharmacodynamic effect across GLP-1 class agents, but the magnitude, onset, and durability differ considerably between retatrutide and oral formulations.

Gastric Emptying: Endpoints, Timing, and Tolerance

With retatrutide, gastric emptying slows markedly in early treatment weeks. Scintigraphic studies show significant retention of gastric contents at four hours post-meal during dose escalation. Critically, this effect attenuates with continued exposure, a tolerance pattern driven by receptor desensitization and adaptive autonomic responses. By weeks 12 to 16 of continuous dosing, gastric emptying rates partially recover toward baseline even as plasma drug concentrations remain at steady state.

With oral GLP-1 agents, the gastric emptying effect is present but often less pronounced at clinically achievable systemic exposures. The SNAC excipient itself may exert local gastric effects independent of GLP-1 receptor activation, complicating interpretation of gastric emptying endpoints in oral-agent studies.

"Researchers who measure gastric emptying only at peak effect risk attributing a transient pharmacodynamic response to a sustained mechanism, a design flaw that inflates apparent potency differences between routes."

For comparative studies, the recommended approach is serial gastric emptying assessment at weeks 2, 8, and 16, capturing both peak effect and tolerance development. Acetaminophen absorption tests offer a practical surrogate when scintigraphy is unavailable.


Study Design Guidance for Comparing Routes

Applying GLP-3 Retatrutide and Oral GLP-1 Concepts: How Researchers Should Compare Exposure, Gastric Emptying, and Bioavailability to a rigorous protocol requires several additional controls beyond exposure matching.

Study Design Guidance for Comparing Routes

Formulation controls: SNAC and similar permeation enhancers alter gastric pH and mucosal permeability. Studies must include SNAC-only control arms to isolate GLP-1 receptor-mediated gastric effects from excipient-mediated ones.

Receptor specificity controls: Because retatrutide activates glucagon receptors, which independently influence gastric motility and hepatic metabolism, researchers comparing it to GLP-1-only oral agents should include receptor-selective antagonist arms where feasible.

GI tolerability endpoints: Nausea and vomiting rates differ across routes partly because of absorption rate differences. Subcutaneous delivery produces a slower Cmax rise than an oral bolus, which may translate to better early tolerability. Capturing time-to-event GI data alongside exposure metrics strengthens mechanistic interpretation.

Beyond obesity endpoints: Emerging research on metabolic dysfunction-associated steatotic liver disease (MASLD) and cardiometabolic markers requires longer observation windows. Researchers sourcing materials for extended studies can review options including GLP-3 Reta 20mg and GLP-3 Reta 30mg formats to support multi-week preclinical protocols.

For foundational background on peptide mechanisms relevant to this class, the Peptides 101 for Research-Use Only Buyers resource covers structure and receptor interaction concepts that inform study design. Researchers also comparing oral versus injectable delivery formats more broadly may find the Slupp332 Oral Versus Injectable Research analysis a useful methodological reference.


Conclusion

The comparison between retatrutide and oral GLP-1 agents is only as valid as the study design supporting it. Researchers in 2026 who treat route of administration as a secondary variable, rather than a primary pharmacokinetic determinant, risk generating data that cannot be meaningfully interpreted or replicated.

Actionable next steps for research teams:

  1. Begin every comparative protocol with AUC-matched exposure normalization, not nominal dose equivalence.
  2. Use serial gastric emptying assessments (weeks 2, 8, and 16 minimum) to capture tolerance development.
  3. Include SNAC-only control arms in any oral GLP-1 study measuring gastric endpoints.
  4. Pre-specify receptor-specificity controls when comparing multi-agonist injectables to single-agonist oral agents.
  5. Source verified, high-purity research materials, such as those available through the Buy Retatrutide Peptide catalog, to ensure compound integrity does not introduce confounding variables.

Rigorous attention to these pharmacokinetic and pharmacodynamic fundamentals is what separates publishable comparative data from inconclusive noise.

https://www.puretestedpeptides.com/wp-content/uploads/2026/10/glp-3-retatrutide-and-oral-glp-1-concepts-how-researchers-should-compare-exposur.webp 1254 1254 https://www.puretestedpeptides.com/wp-content/uploads/2026/01/buy-peptides-online.jpg 2026-10-09 13:07:312026-10-09 13:07:31GLP-3 Retatrutide and Oral GLP-1 Concepts: How Researchers Should Compare Exposure, Gastric Emptying, and Bioavailability
Where to Buy 5-Amino-1MQ and MOTS-c Research Materials: A COA, Identity, Purity, and Storage Checklist

Where to Buy 5-Amino-1MQ and MOTS-c Research Materials: A COA, Identity, Purity, and Storage Checklist

October 9, 2026/0 Comments/in Uncategorized/by

Fewer than one in five research-grade peptide lots on the market in 2026 carry a fully documented, batch-specific Certificate of Analysis that covers identity, purity method, residual solvents, and lot traceability simultaneously. For researchers sourcing 5-Amino-1MQ or MOTS-c, that gap is not a minor inconvenience, it is a direct threat to data integrity. This guide on where to buy 5-Amino-1MQ and MOTS-c research materials covers every documentation and storage checkpoint a researcher should verify before placing an order.

Key Takeaways

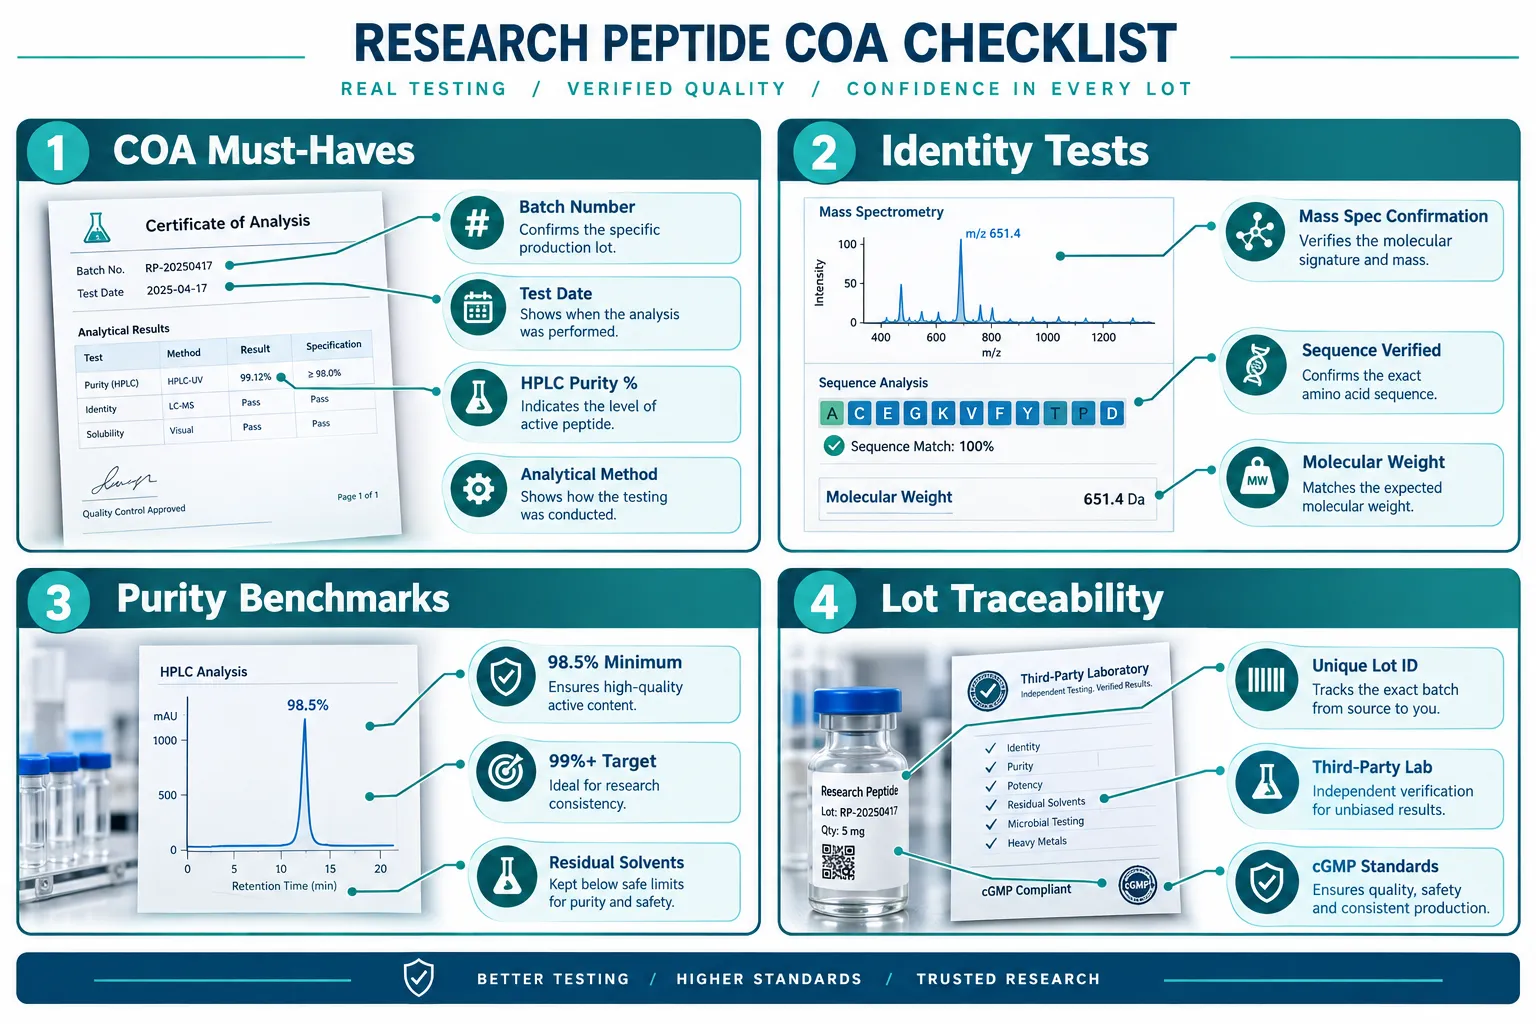
  • A legitimate COA must include batch number, test date, HPLC purity percentage, mass-spec identity confirmation, analytical method, and residual solvent data.
  • Current 2026 market standards for 5-Amino-1MQ set chromatographic purity at 98.5% minimum, with leading vendors reporting 99.15% to 99.90%.
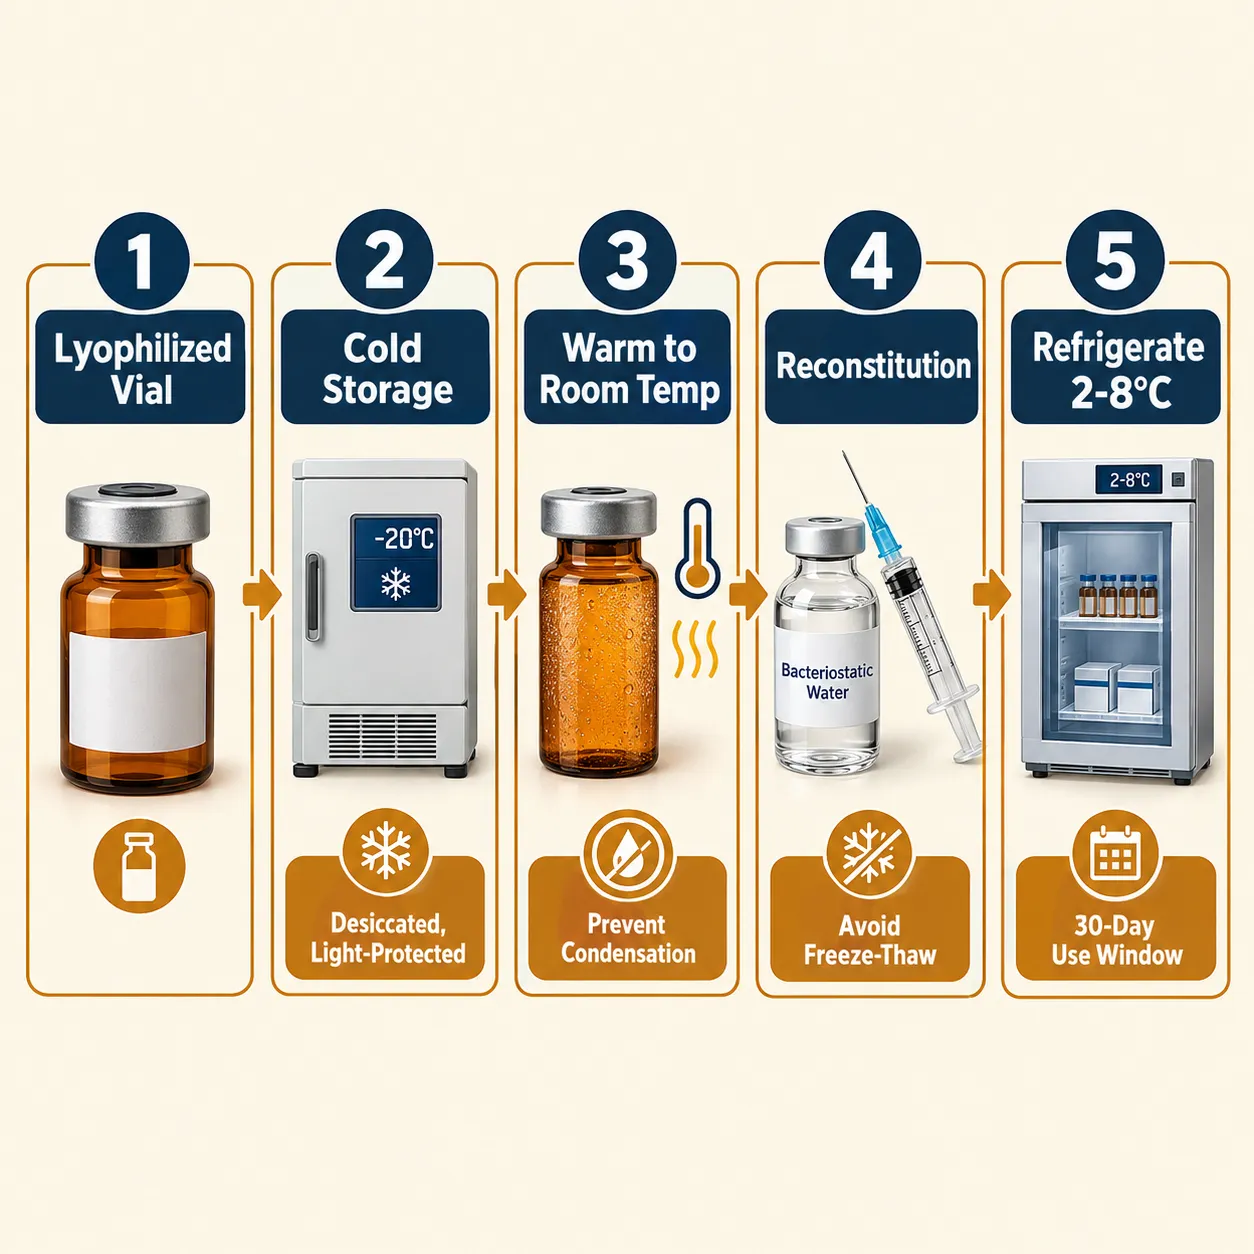
  • Lyophilized 5-Amino-1MQ and MOTS-c should be stored at -20 °C or lower, desiccated and protected from light; reconstituted solutions are typically stable for no more than 30 days at 2-8 °C.
  • MOTS-c carries heightened regulatory scrutiny as a non-approved investigational peptide; sourcing from vendors with full documentation is non-negotiable.
  • Only vendors that supply lot-specific, third-party-verified COAs and clear storage labeling meet the minimum standard for serious research procurement.

What a Complete COA Must Contain: The Documentation Checklist

What a Complete COA Must Contain: The Documentation Checklist

The Certificate of Analysis is the single most important document in any research material procurement decision. A COA that lists only a purity number without identifying the analytical method, the lab that ran the test, or the specific lot being certified is functionally incomplete.

For a thorough introduction to how research peptides are classified and where compounds like 5-Amino-1MQ and MOTS-c fit structurally, the Peptides 101 for research-use only buyers guide provides useful foundational context.

Minimum COA checklist for 5-Amino-1MQ and MOTS-c:

COA Element What to Look For
Batch / Lot Number Unique alphanumeric ID traceable to a single production run
Test Date Specific date, not a vague range or model year
Purity Method Reversed-phase HPLC with stated column and conditions
Purity Result Numerical percentage, not just "high purity"
Identity Confirmation Mass spectrometry data matching expected molecular weight
Net Peptide Content Corrected for water and salt content
Water Content Karl Fischer or equivalent titration result
Residual Solvents Reported values for acetonitrile, TFA, or other process solvents
Third-Party Lab Name or accreditation number of the independent testing facility

"A COA without a named third-party lab and a specific test date is a marketing document, not an analytical record."

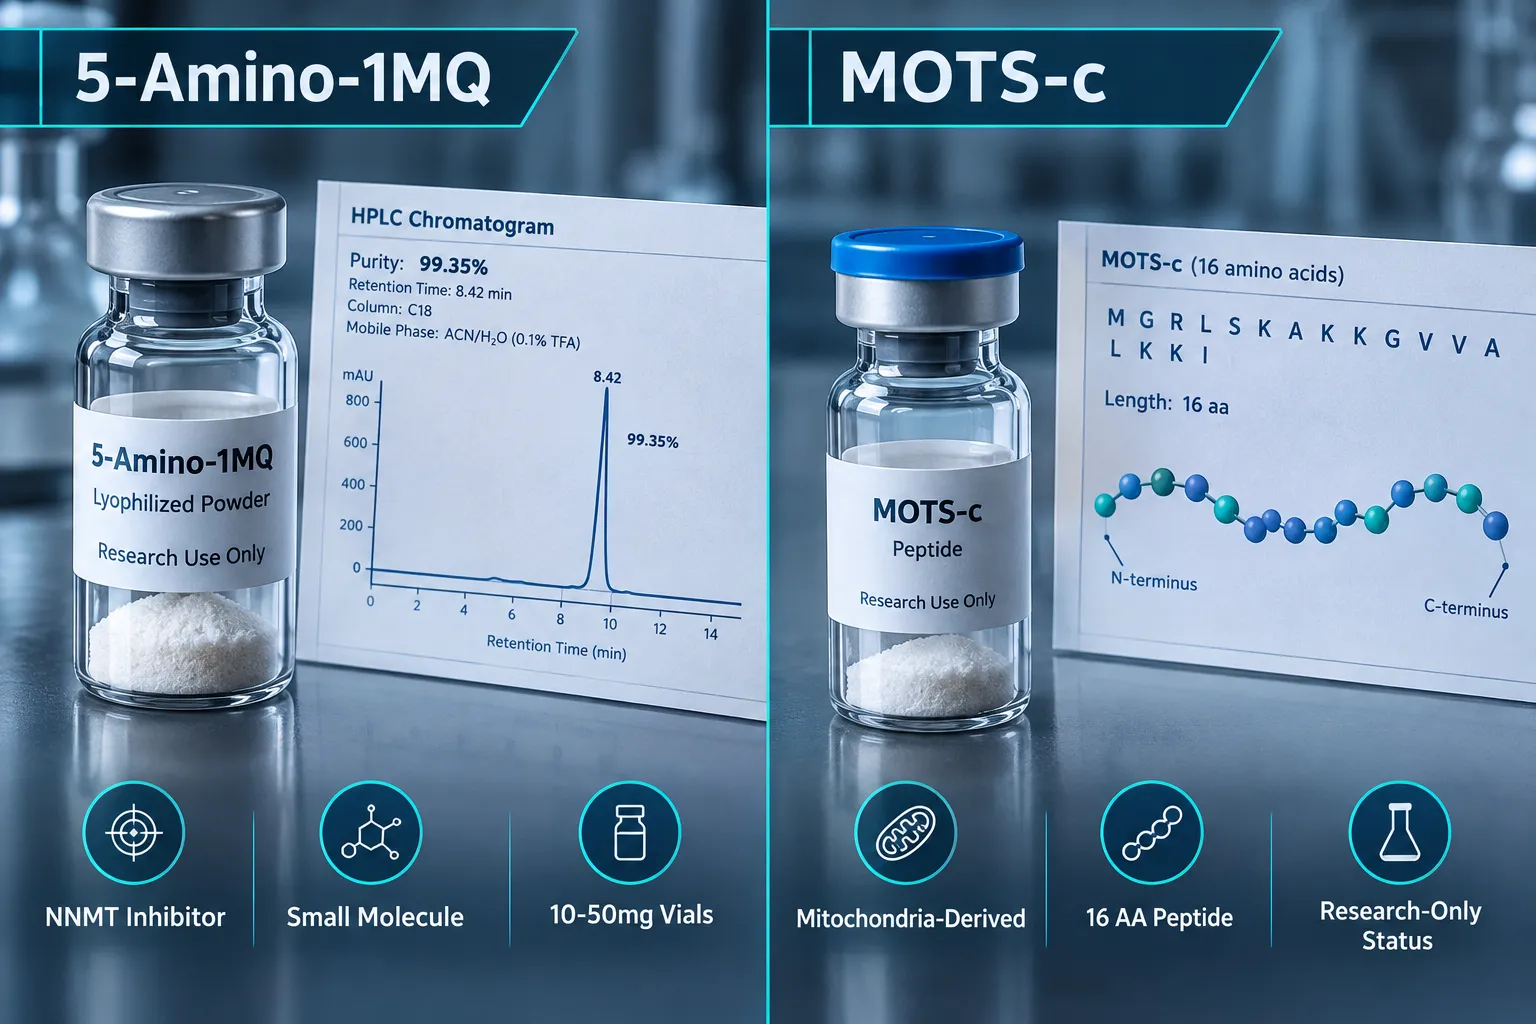
Leading vendors in 2026, including those supplying 5-Amino-1MQ at 99.35% purity with a traceable lot ID and a March 2026 test date, demonstrate that this level of documentation is achievable and should be expected as standard. Vendors operating under cGMP-comparable manufacturing standards and using accredited independent labs consistently meet or exceed 99% chromatographic purity on HPLC.


Storage Conditions: Lyophilized Powder vs. Reconstituted Solution

Storage Conditions: Lyophilized Powder vs. Reconstituted Solution

Storage requirements differ significantly depending on whether the material is still in lyophilized powder form or has been reconstituted. Conflating the two is one of the most common errors in peptide handling.

Lyophilized (dry powder) storage:

  • Store at -20 °C or lower, desiccated and protected from light
  • Sealed vials at -20 °C: powder stability of approximately 3 years
  • Sealed vials at 4 °C: powder stability of approximately 2 years
  • Room temperature (15 °C): stability drops to approximately 3 months
  • Always allow a sealed vial to warm to room temperature before opening to prevent moisture condensation from degrading the powder

Post-reconstitution storage:

  • Refrigerate at 2-8 °C immediately after reconstitution
  • Use within 30 days; do not rely on visual clarity as a stability indicator
  • Solutions stored at -20 °C are suitable for approximately 1 month
  • Solutions stored at -80 °C extend stability to approximately 6 months
  • Avoid repeated freeze-thaw cycles, which accelerate degradation

For MOTS-c specifically, an August 2026 FDA Pharmacy Compounding Advisory Committee briefing document confirms that lyophilized MOTS-c free base is stable at -20 °C when desiccated and protected from light, with reconstituted solution recommended at +4 °C for 2-7 days or below -18 °C for longer-term storage. The same document underscores that MOTS-c is not an approved drug and remains under active regulatory review.

One important exception: certain ready-to-use peptide formulations specify storage at 2-8 °C in the dark and explicitly instruct "do not freeze." These are formulation-specific requirements. Always check the lot-specific label and COA, not just general guidance, before storing any vial.

For researchers working with related mitochondrial compounds, the MOTS-c and elamipretide research overview and the SS-31 mitochondrial research themes page offer relevant comparative context.


Where to Buy 5-Amino-1MQ and MOTS-c Research Materials: Vendor Evaluation Framework

Where to Buy 5-Amino-1MQ and MOTS-c Research Materials: Vendor Evaluation Framework

Applying the COA and storage checklist above to current vendor offerings narrows the field considerably. The following framework answers the core question of where to buy 5-Amino-1MQ and MOTS-c research materials with documentation standards that support reproducible research.

5-Amino-1MQ vendor landscape (2026):

Multiple US and Canadian vendors currently supply 5-Amino-1MQ as a lyophilized research reagent with batch-specific COAs. Purity values across verified 2026 COAs range from 98.5% (HPLC measured at 99.15%) to 99.90%, with the majority of reputable suppliers clustered at 99%+. Available sizes range from 5 mg to 50 mg vials, all labeled for laboratory research use only.

For researchers specifically evaluating injectable formulations, the where to buy 5-Amino-1MQ injectable guide addresses formulation-specific sourcing considerations. The MOTS-c peptide and 5-Amino-1MQ combined research overview is also useful for researchers working with both compounds simultaneously.

MOTS-c sourcing considerations:

MOTS-c availability is more constrained than 5-Amino-1MQ. As a synthetic 16-amino-acid mitochondria-derived peptide encoded in the 12S rRNA, MOTS-c sits in a more heavily scrutinized regulatory category. Vendors supplying MOTS-c for research should provide:

  • Full lot-specific COA with mass-spec sequence confirmation
  • Explicit lyophilized storage conditions (-20 °C or -80 °C, desiccated)
  • Reconstitution and post-reconstitution handling instructions
  • Clear "research use only" labeling

The MOTS-c 10mg product page and the where to buy MOTS-c and SLUPP-332 guide are practical starting points for researchers comparing current supply options.

Red flags that disqualify a vendor:

  • No third-party lab named on the COA
  • Purity stated without an analytical method
  • No batch number or test date on the COA
  • Storage instructions absent from product listing and COA
  • No "research use only" designation

Conclusion

Sourcing 5-Amino-1MQ and MOTS-c research materials responsibly in 2026 requires more than finding a vendor with a competitive price. The COA, identity, purity, and storage checklist outlined above gives researchers a concrete, actionable framework for evaluating every supplier before purchase.

Actionable next steps:

  1. Request a lot-specific COA before ordering, not a generic template document.
  2. Confirm the COA includes HPLC purity with method, mass-spec identity, residual solvents, water content, batch number, and test date.
  3. Verify the testing was conducted by a named, accredited third-party laboratory.
  4. Match storage instructions on the COA to your available lab infrastructure before committing to a vial size.
  5. For MOTS-c, confirm the vendor acknowledges the compound's research-only regulatory status explicitly.

Researchers who apply this checklist consistently will spend less time troubleshooting assay variability and more time generating reliable data.

https://www.puretestedpeptides.com/wp-content/uploads/2026/10/where-to-buy-5-amino-1mq-and-mots-c-research-materials-a-coa-identity-purity-and.webp 1024 1536 https://www.puretestedpeptides.com/wp-content/uploads/2026/01/buy-peptides-online.jpg 2026-10-09 13:07:022026-10-09 13:07:02Where to Buy 5-Amino-1MQ and MOTS-c Research Materials: A COA, Identity, Purity, and Storage Checklist
Electrolytes in Peptide Studies: Designing Sodium, Potassium, and Fluid-Balance Controls for GLP and Growth-Hormone Models

Electrolytes in Peptide Studies: Designing Sodium, Potassium, and Fluid-Balance Controls for GLP and Growth-Hormone Models

October 9, 2026/0 Comments/in Uncategorized/by

Fluid retention of just 1-2 liters can add more than 1 kg to a subject's body weight overnight, a shift large enough to mask or mimic a meaningful treatment effect in a peptide study. When the compounds under investigation are GLP-1 agonists or growth-hormone analogues, both of which directly alter renal sodium handling and total body water, uncontrolled electrolyte variables are not a minor nuisance. They are a primary source of confounding. Designing rigorous electrolyte controls is therefore central to valid endpoint measurement in these models, and the field of electrolytes in peptide studies: designing sodium, potassium, and fluid-balance controls for GLP and growth-hormone models has matured considerably in 2026.

Key Takeaways

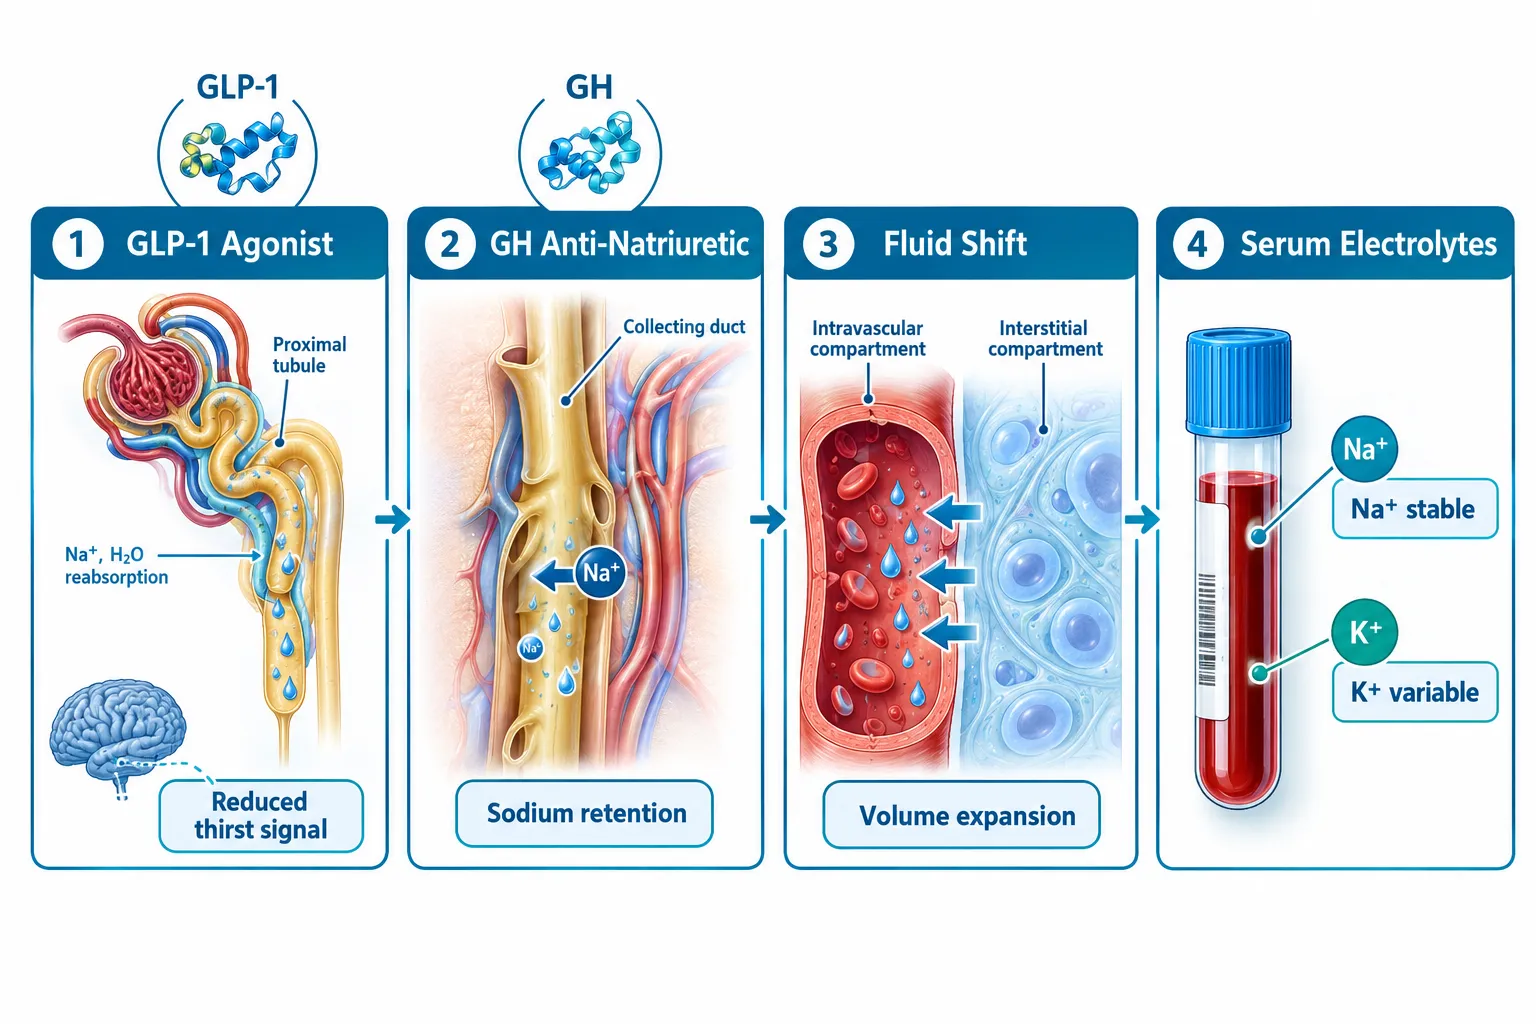
  • GLP-1 agonists suppress thirst and reduce fluid intake, creating real dehydration and hyponatremia risk that must be controlled prospectively.
  • Growth hormone is anti-natriuretic: it promotes sodium and water retention through direct renal mechanisms, altering body weight and blood pressure readouts.
  • Serum sodium and potassium can appear stable even when total-body balances are significantly altered, making urine and fluid-intake logs essential.
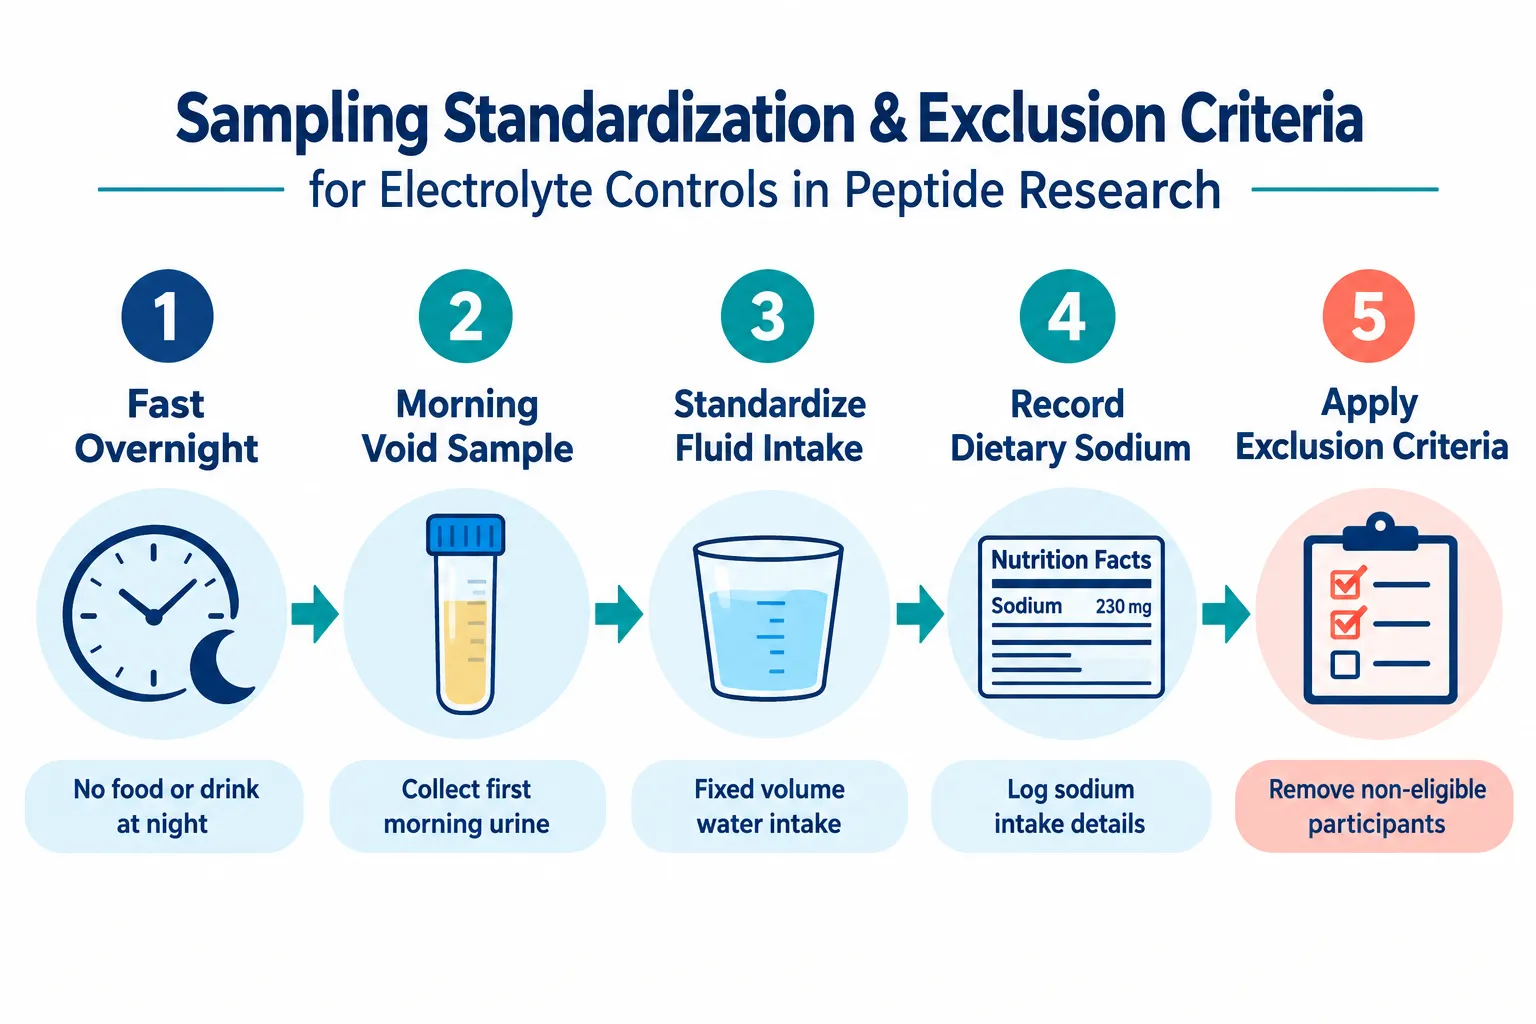
  • Sampling standardization, fixed fasting state, fixed hydration window, morning collection, is non-negotiable for reproducible electrolyte endpoints.
  • Exclusion criteria for baseline electrolyte abnormalities protect data integrity and reduce the risk of confounded renal and cardiovascular readouts.

Why Electrolyte Physiology Matters in GLP and GH Peptide Research

Both GLP-1 receptor agonists and growth-hormone-related peptides interact with the kidney in ways that directly alter sodium excretion, potassium distribution, and extracellular fluid volume. Understanding these mechanisms is the first step toward building controls that actually work.

Why Electrolyte Physiology Matters in GLP and GH Peptide Research

GLP-1 agonists reduce appetite and caloric intake, but they also suppress thirst, a phenomenon now described as hypodipsia. Subjects in GLP-1 models frequently show reduced spontaneous fluid consumption, raising the risk of mild-to-moderate dehydration. This matters because dehydration concentrates serum sodium, elevates hematocrit, and reduces glomerular filtration rate (GFR). If these changes are not tracked, a researcher may misattribute them to the peptide's metabolic action rather than to simple fluid deficit. Researchers working with GLP-3 R Peptide GA3 or GLP-3 R Peptide GA4 should treat hydration monitoring as a core protocol element, not an afterthought.

Growth hormone operates through a different but equally important mechanism. GH is anti-natriuretic: it increases renal tubular sodium reabsorption, expands extracellular fluid volume, and raises total body water. In GH-deficient subjects receiving replacement therapy, serum sodium and potassium often remain within normal reference ranges even as total-body sodium and water increase measurably. This dissociation between serum values and actual balance is a critical insight. Relying solely on a serum electrolyte panel will miss the fluid-volume shifts that inflate body weight and raise blood pressure, two of the most common endpoints in GH analogue studies.


Designing GLP-1 Models: Sodium, Potassium, and Hydration Controls

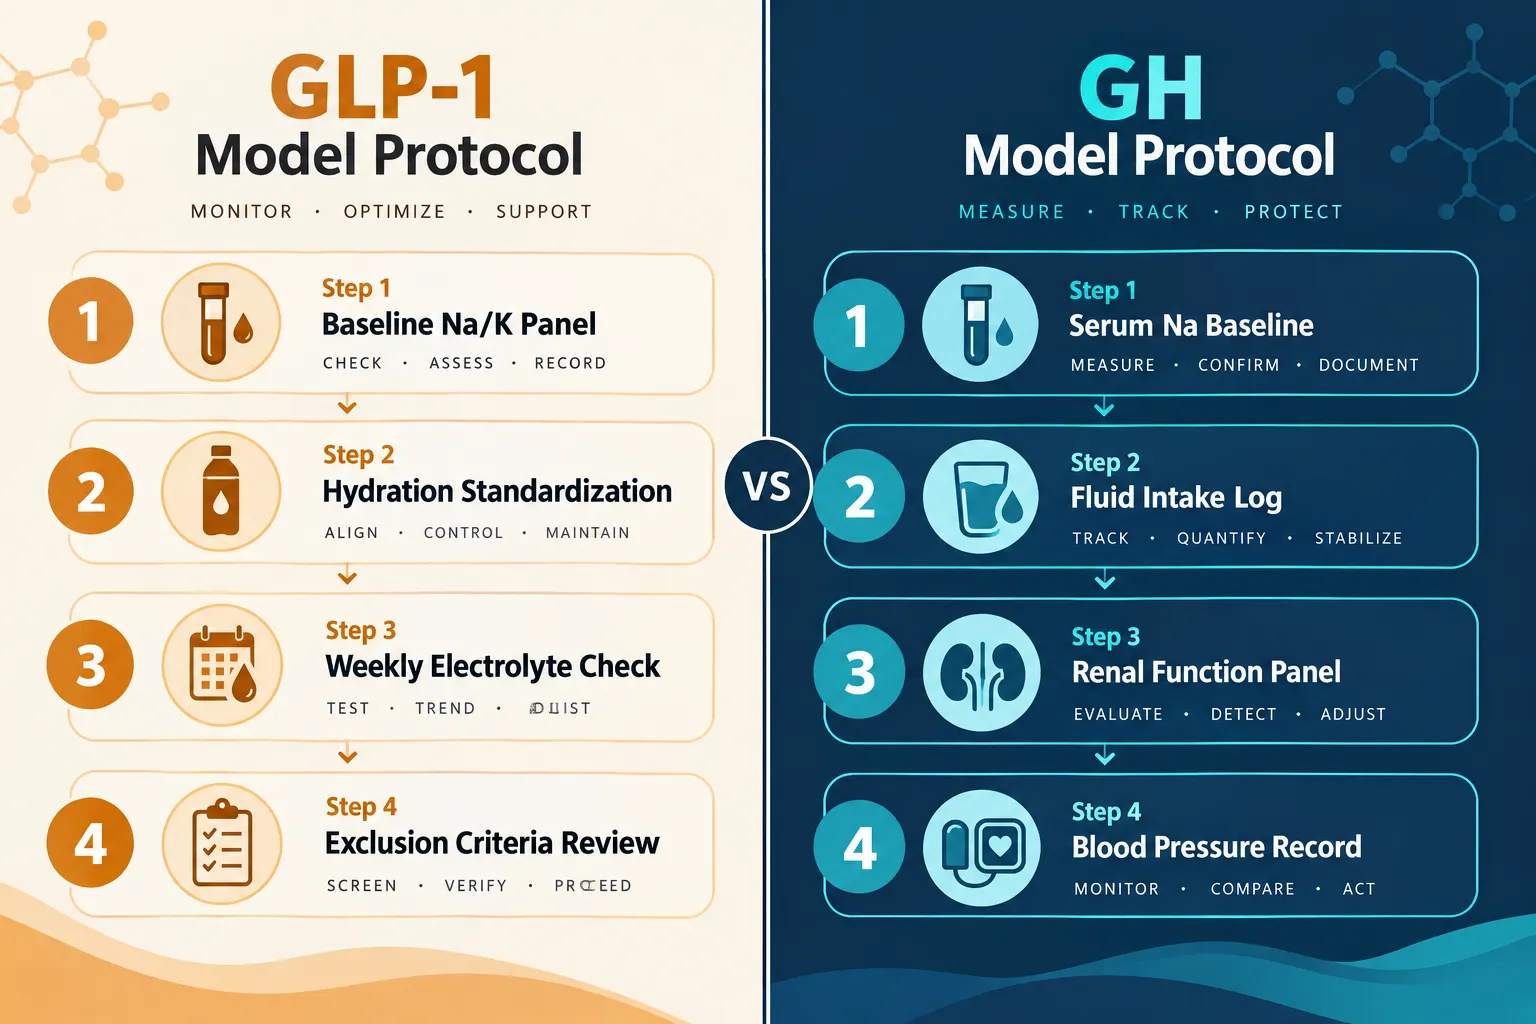
A well-designed GLP-1 model requires prospective hydration targets and a formalized electrolyte monitoring schedule built into the protocol from day one.

Hydration targets should be set at a defined minimum daily fluid intake, typically 30-35 mL per kilogram of body weight, and documented through daily fluid-intake logs. Subjects who fall below threshold on two or more consecutive days should trigger a protocol review. Urine-specific gravity measured at each morning sample collection provides a rapid, low-cost hydration proxy.

Sodium monitoring in GLP-1 models should include:

  • Baseline serum sodium before compound administration
  • Weekly serum sodium during active dosing
  • Urine sodium-to-creatinine ratio at baseline and at key timepoints
  • Dietary sodium standardization (target: 2,000-2,300 mg/day) or at minimum, a validated dietary recall at each visit

Potassium deserves separate attention. Rapid weight loss, which GLP-1 agonists can accelerate, increases the risk of hypokalemia through reduced dietary intake and increased renal losses. A serum potassium below 3.5 mEq/L should be a pre-specified action threshold: halt dose escalation, initiate dietary supplementation, and re-test within 72 hours.

"The most common electrolyte error in GLP-1 peptide models is treating hydration as a background variable rather than a controlled input."

For researchers sourcing compounds like Cagrilintide peptide or Retatrutide peptide, agents that combine GLP-1 and other receptor activity, the electrolyte burden is compounded, and monitoring frequency should increase accordingly.


Designing GH Models: Fluid Volume, Renal Endpoints, and Sampling Standards

Growth-hormone models present a different design challenge. Because GH expands extracellular fluid without reliably shifting serum sodium outside normal ranges, standard chemistry panels alone are insufficient as electrolyte controls.

Designing GH Models: Fluid Volume, Renal Endpoints, and Sampling Standards

Recommended control variables for GH models include:

Variable Measurement Method Frequency
Serum sodium Venous blood draw Baseline, weeks 2, 4, 8
Total body water Bioimpedance or deuterium dilution Baseline and end-of-study
Blood pressure Standardized seated measurement Every visit
Urine sodium Spot urine Na/Cr ratio Baseline and monthly
Body weight Morning, post-void, fasted Every visit

The key principle here is morning, post-void, fasted body weight. Because GH-driven fluid retention fluctuates with activity, posture, and dietary sodium intake, weight measurements taken at inconsistent times introduce noise that can easily exceed the magnitude of the treatment effect being studied.

Researchers using GH analogue peptides or PEG-MGF peptide should also pre-specify renal endpoints. GH's anti-natriuretic effect is mediated partly through IGF-1-dependent increases in GFR and partly through direct tubular action. Both pathways can alter creatinine clearance, so eGFR should be tracked alongside electrolytes rather than treated as a separate safety variable.


Sampling Standardization and Exclusion Criteria

Reproducible electrolyte data requires standardized collection conditions. Variability in fasting duration, hydration state, or posture at blood draw can shift serum sodium by 2-4 mEq/L and potassium by 0.3-0.5 mEq/L, differences large enough to cross clinical action thresholds.

Sampling Standardization and Exclusion Criteria

Standardization checklist for every electrolyte sample:

  1. Overnight fast of at least 8 hours
  2. Morning collection (6:00-9:00 AM window)
  3. Seated rest for 10 minutes before venipuncture
  4. No strenuous exercise in the prior 24 hours
  5. Standardized fluid intake the evening before (250-500 mL water, no electrolyte beverages)
  6. Document any diuretic, laxative, or supplement use within 48 hours

Exclusion criteria should be applied at screening to protect endpoint validity. Subjects with baseline serum sodium below 135 or above 145 mEq/L, potassium below 3.5 or above 5.0 mEq/L, or eGFR below 60 mL/min/1.73 m² should be excluded from electrolyte-sensitive peptide models. These thresholds reduce the risk that a pre-existing imbalance will be misread as a compound effect.

For models involving MOTS-C peptide, which influences mitochondrial and metabolic function, or BPC-157 / TB-500 peptide in wound healing models, electrolyte controls serve a secondary but still meaningful role in ensuring that inflammatory and fluid shifts do not confound tissue-repair endpoints.


Conclusion

The integrity of GLP and growth-hormone peptide research depends on treating electrolytes and fluid balance as primary controlled variables, not secondary safety checks. Actionable next steps for researchers in 2026 include:

  • Build electrolyte monitoring into the protocol at study design, not as an amendment after data collection begins.
  • Set pre-specified action thresholds for sodium, potassium, and hydration markers with clear decision rules for dose adjustment or subject review.
  • Standardize all sampling conditions, fasting state, time of day, posture, and prior-evening fluid intake, and document deviations as protocol deviations, not minor notes.
  • Apply strict exclusion criteria at screening to remove subjects with baseline electrolyte abnormalities that would confound interpretation.
  • Separate serum values from total-body balance in GH models by adding bioimpedance or urine electrolyte measures alongside standard chemistry panels.

Electrolytes in peptide studies, specifically designing sodium, potassium, and fluid-balance controls for GLP and growth-hormone models, is no longer an optional refinement. It is a prerequisite for data that can withstand scrutiny and support meaningful conclusions.

https://www.puretestedpeptides.com/wp-content/uploads/2026/10/electrolytes-in-peptide-studies-designing-sodium-potassium-and-fluid-balance-con.webp 1024 1536 https://www.puretestedpeptides.com/wp-content/uploads/2026/01/buy-peptides-online.jpg 2026-10-09 13:05:152026-10-09 13:05:15Electrolytes in Peptide Studies: Designing Sodium, Potassium, and Fluid-Balance Controls for GLP and Growth-Hormone Models
GLP-3 Retatrutide Research Models: How to Separate GLP-1, GIP, and Glucagon Receptor Contributions

GLP-3 Retatrutide Research Models: How to Separate GLP-1, GIP, and Glucagon Receptor Contributions

October 8, 2026/0 Comments/in Uncategorized/by

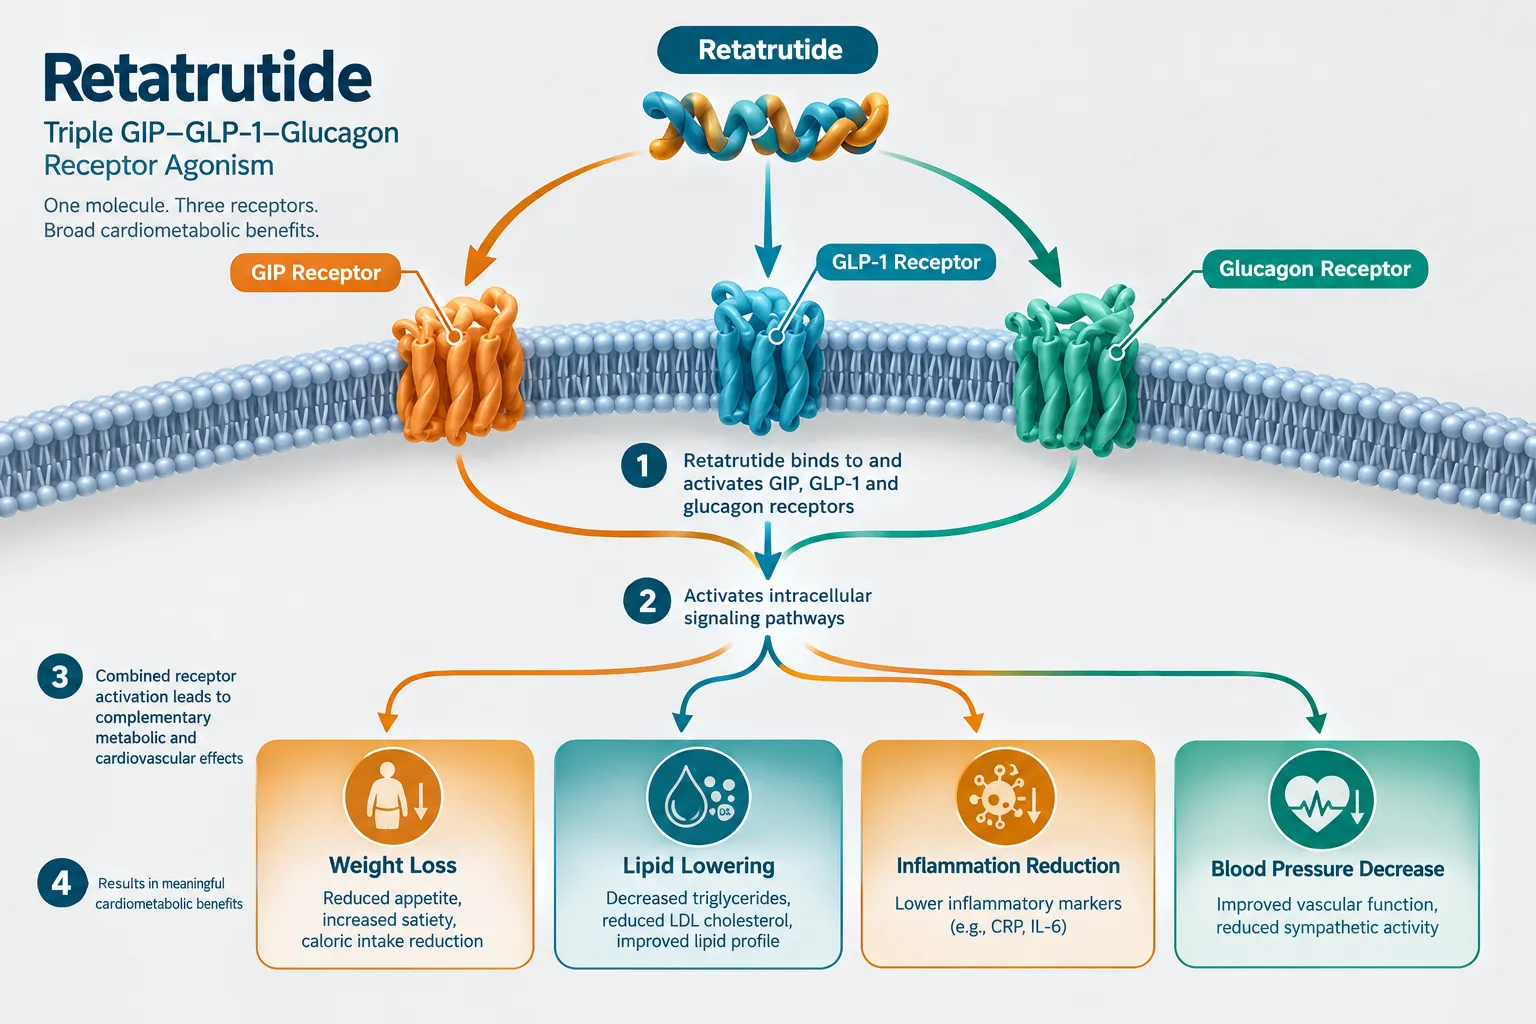
Retatrutide activates three distinct hormone receptors simultaneously, yet most published analyses treat its effects as a single pharmacological event. That framing obscures the mechanistic picture and limits the design of better molecules. The real scientific challenge is attribution: which receptor drives appetite suppression, which governs energy expenditure, and which fine-tunes insulin secretion? Applying rigorous GLP-3 Retatrutide Research Models to separate GLP-1, GIP, and glucagon receptor contributions is now a central priority in metabolic pharmacology.

Key Takeaways

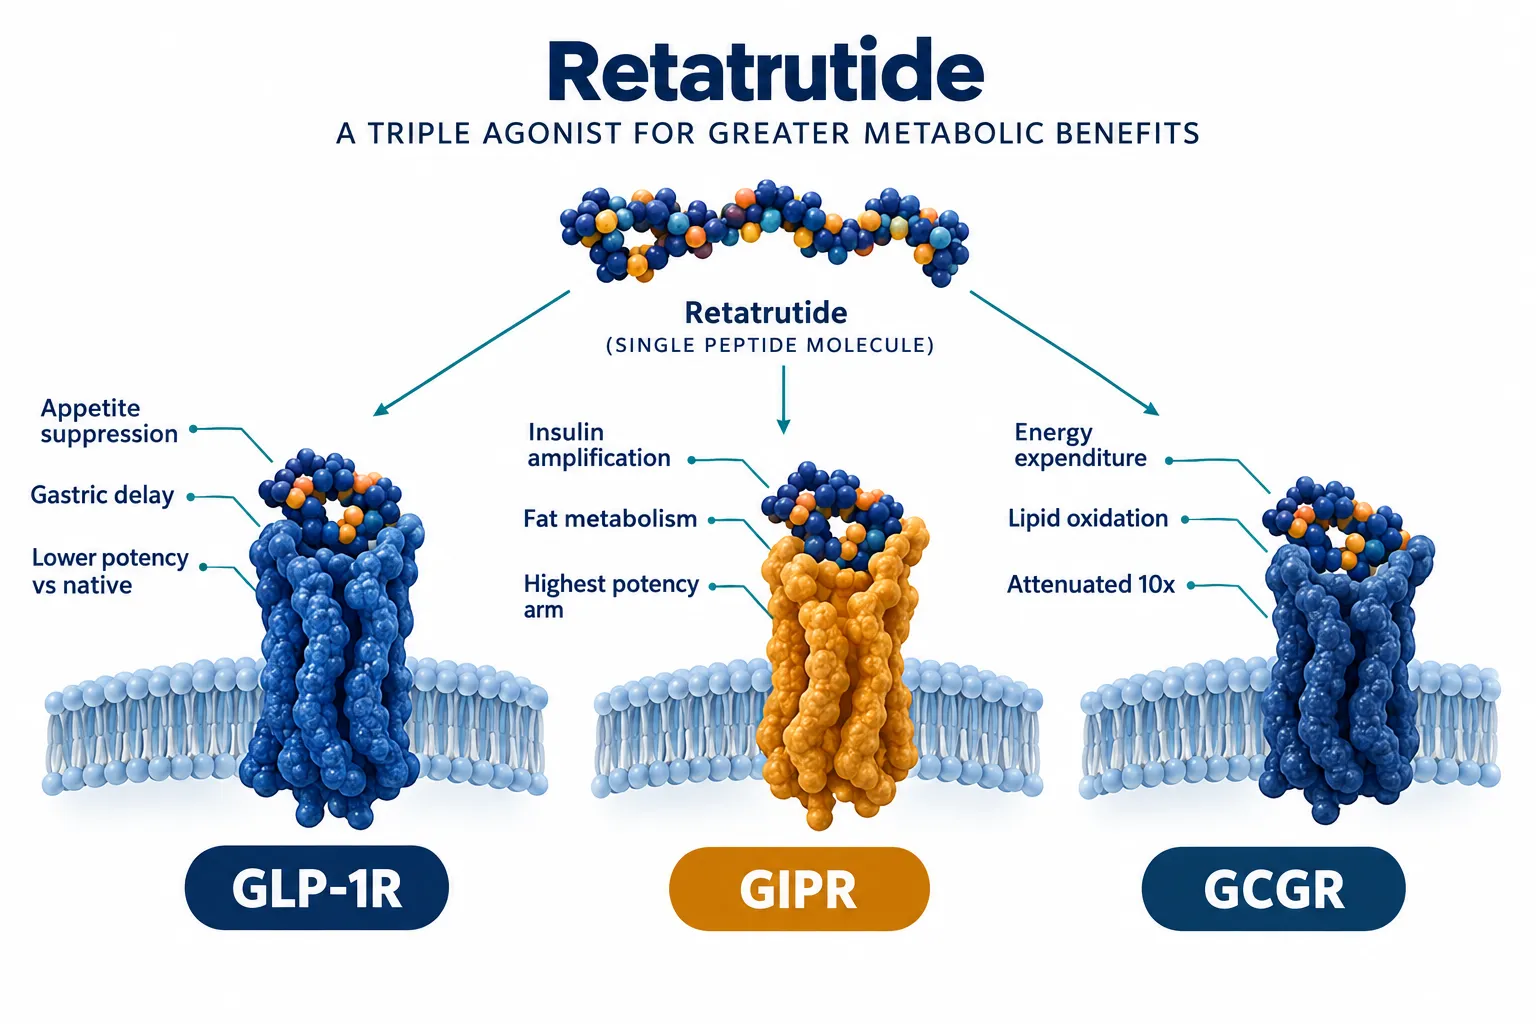
  • Retatrutide is intentionally engineered with higher potency at GIPR and reduced potency at GLP-1R and GCGR relative to native ligands, encoding a separable receptor "weighting" that can be exploited in mechanistic studies.
  • GLP-1R blockade or knockout primarily blunts appetite suppression and gastric emptying delay; GCGR disruption mainly reduces energy expenditure, lipid oxidation, and natriuresis.
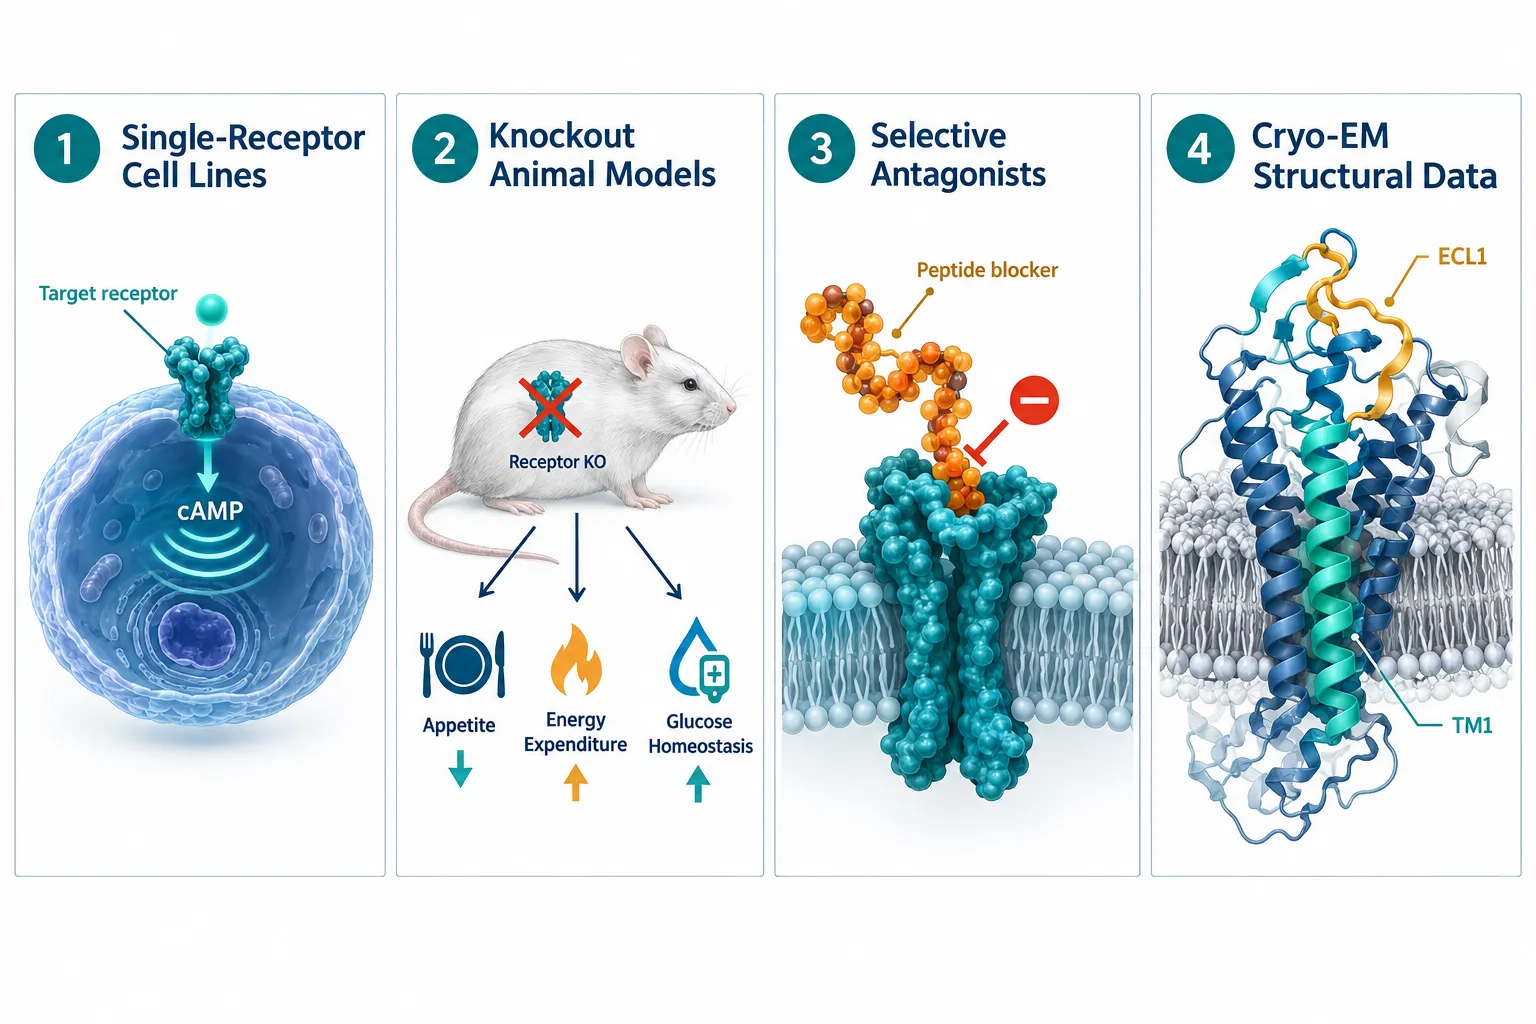
  • Single-receptor cell lines measuring cAMP and beta-arrestin recruitment provide the cleanest in vitro separation of each receptor's signaling contribution.
  • Cryo-EM structures reveal receptor-specific conformations at ECL1 and TM1, enabling rational design of chimeric and mutant receptors for mechanistic dissection.
  • Orthogonal biomarker panels, indirect calorimetry, hepatic MRI-PDFF, gastric emptying scintigraphy, and glucagon/ketone profiles, allow investigators to attribute clinical endpoints to specific receptor arms.

Understanding Retatrutide's Engineered Receptor Weighting

Understanding Retatrutide's Engineered Receptor Weighting

Retatrutide (LY3437943) is a synthetic fatty diacid-conjugated peptide that co-activates GLP-1R, GIPR, and GCGR. Its design is deliberately asymmetric. In human receptor assays, it shows several-fold greater potency at GIPR than endogenous GIP itself, while displaying lower potency than native GLP-1 at GLP-1R and lower potency than native glucagon at GCGR. Glucagon receptor activity is intentionally attenuated to roughly one-tenth of GLP-1R activity.

This asymmetry is not incidental, it is the foundation for receptor-deconvolution research. Because each arm operates at a different intrinsic potency, dose-response experiments can be designed to selectively saturate one receptor while leaving others sub-maximally engaged. Researchers exploring GLP-1 Retatrutide activity profiles will recognize this tiered potency as a built-in experimental lever.

Why this matters for modeling: A molecule with equal potency at all three receptors would make attribution nearly impossible. Retatrutide's intentional imbalance means that incremental dose increases will disproportionately engage the highest-affinity receptor first, allowing investigators to map which effects emerge at low, medium, and high occupancy.


Core Experimental Strategies in GLP-3 Retatrutide Research Models: How to Separate GLP-1, GIP, and Glucagon Receptor Contributions

Core Experimental Strategies in GLP-3 Retatrutide Research Models: How to Separate GLP-1, GIP, and Glucagon Receptor Contribu

Single-Receptor Cell Lines and In Vitro Signaling Assays

The cleanest starting point for receptor attribution is a cell system expressing only one receptor. By exposing GLP-1R-only, GIPR-only, or GCGR-only cell lines to retatrutide and measuring:

  • cAMP accumulation (primary Gs-coupled readout)
  • Beta-arrestin recruitment (biased signaling indicator)
  • Receptor internalization kinetics

…investigators generate EC50 and Emax values for each receptor in isolation. Comparing these values against native ligand benchmarks quantifies how much of the molecule's activity "belongs" to each receptor arm. This approach directly supports the broader goal of GLP-3 Retatrutide Research Models to separate GLP-1, GIP, and glucagon receptor contributions at the molecular level.

Cryo-EM Structural Models as a Design Blueprint

High-resolution cryo-EM structures of retatrutide bound separately to GLP-1R, GIPR, and GCGR reveal a single continuous alpha-helix penetrating the transmembrane core. The N-terminal segment (residues 1-13) drives receptor activation, while the C-terminal helix engages the extracellular domain and ECL1.

Critically, receptor-specific conformational differences appear at ECL1 and the extracellular tip of TM1. These structural distinctions provide a rational basis for:

  1. Introducing point mutations at receptor-peptide contact sites
  2. Building chimeric receptors that swap ECL1 regions between GLP-1R and GCGR
  3. Designing analogs with altered N-terminal sequences to bias activation toward one receptor

These tools allow researchers to test how specific peptide-receptor contacts govern signaling, turning structural data into functional attribution experiments.

Preclinical Knockout and Antagonist Models

Animal models remain the gold standard for whole-organism receptor attribution:

Intervention Primary Effect Reduced Preserved Effects
GLP-1R knockout or blockade Appetite suppression, gastric emptying delay Glucose lowering, energy expenditure
GCGR knockout or antagonism Energy expenditure, lipid oxidation, natriuresis Appetite suppression, insulin secretion
GIPR deficiency Insulin secretory response, adipose metabolism Appetite effects largely intact

This table reflects a consistent pattern across multiple preclinical studies: each receptor arm has a dominant physiological role that becomes visible only when the other arms are silenced. For researchers sourcing materials for such studies, options like buy Retatrutide peptide and GLP-3 Retatrutide buy online USA provide access to research-grade material.


Orthogonal Biomarker Panels and Clinical Attribution Frameworks

Orthogonal Biomarker Panels and Clinical Attribution Frameworks

Preclinical knockout data only goes so far. In clinical and translational settings, receptor-specific attribution relies on orthogonal biomarker panels, multiple independent readouts that each correlate preferentially with one receptor arm.

GLP-1R-dominant biomarkers:

  • Gastric emptying scintigraphy (delayed emptying tracks GLP-1R engagement)
  • Nausea and vomiting incidence (GI adverse events mirror GLP-1 agonist patterns)
  • Appetite visual analog scores

GIPR-dominant biomarkers:

  • Insulin/C-peptide ratios during mixed-meal tolerance tests
  • Adipose tissue lipolysis markers
  • Musculoskeletal symptom patterns in adverse-event monitoring

GCGR-dominant biomarkers:

  • Indirect calorimetry (resting energy expenditure and respiratory quotient)
  • Hepatic MRI-PDFF for liver fat quantification
  • Brown adipose tissue activity via PET imaging
  • Glucagon and ketone body profiles
  • Natriuresis and renal hemodynamic measures

"By comparing retatrutide's weight and HbA1c outcomes to those of GLP-1 mono-agonists and GLP-1/GIP dual agonists in meta-analyses, modeling studies apportion the incremental 3-5% additional weight loss and greater hepatic fat reduction largely to the glucagon receptor component."

This comparative framework, triagonist versus dual agonist versus mono-agonist, functions as a clinical receptor-subtraction model. The "extra" efficacy beyond what tirzepatide or semaglutide achieves is attributed to the GCGR arm by difference. Researchers interested in the broader cardiometabolic context can explore polypeptide peptides in cardiometabolic models for additional comparative context.

Pharmacokinetic Modeling as a Temporal Lever

Retatrutide's fatty diacid conjugation produces a half-life of approximately six days, enabling once-weekly dosing. Because GLP-1R, GIPR, and GCGR differ in internalization and desensitization kinetics, PK/PD time-course modeling reveals how receptor contributions shift across the dosing interval. GLP-1R and GIPR effects tend to dominate early satiety and postprandial glucose control, while sustained GCGR engagement drives ongoing energy expenditure and lipid oxidation later in the cycle. This temporal separation adds another dimension to the attribution toolkit.

For researchers sourcing high-purity material for PK/PD studies, GLP-3 Reta 20mg and Reta 20mg for sale options are available with third-party purity verification.


Future Directions: Biased Agonism and Next-Generation Attribution Tools

The 2026 research landscape points toward increasingly precise receptor-deconvolution strategies. Several developments are expected to advance the field:

  • Biased agonist analogs, GCGR-biased molecules for NASH research; GLP-1/GIP-biased analogs for pure glycemic control, will allow prospective attribution rather than retrospective subtraction
  • Tissue-targeted delivery, hepatic-targeted GCGR agonism to isolate liver-specific effects from systemic thermogenesis
  • Receptor-selective biomarker panels in phase 3 trials, systematic collection of indirect calorimetry, hepatic imaging, and renal endpoints to formally decompose triagonist effects
  • Chimeric receptor mutagenesis panels, expanded use of ECL1-swapped and TM1-mutant constructs informed by cryo-EM data

These approaches collectively move the field from descriptive pharmacology toward quantitative receptor attribution, the ultimate goal of rigorous GLP-3 Retatrutide Research Models that separate GLP-1, GIP, and glucagon receptor contributions with experimental precision. Researchers building these models can also reference IPA Sermorelin stack research for comparative multi-peptide experimental design strategies.


Conclusion

Separating the individual receptor contributions of retatrutide is not merely an academic exercise, it directly informs the design of safer, more targeted metabolic therapies. The practical framework involves four complementary layers: engineered potency asymmetry as a built-in experimental lever, single-receptor cell assays and cryo-EM structural data for molecular-level attribution, knockout and antagonist animal models for whole-organism validation, and orthogonal biomarker panels for clinical translation.

Actionable next steps for researchers in 2026:

  1. Establish single-receptor cell lines expressing GLP-1R, GIPR, or GCGR individually before running multi-receptor assays
  2. Pair every in vivo retatrutide experiment with at least one receptor-selective antagonist arm to generate subtraction data
  3. Include indirect calorimetry and hepatic imaging endpoints alongside glycemic measures to capture GCGR-specific signals
  4. Use PK/PD time-course sampling at 24h, 72h, and 144h post-dose to capture temporal shifts in receptor dominance
  5. Cross-reference findings against published triagonist versus dual-agonist comparator data to validate receptor attribution estimates

For research teams sourcing verified material, buy GLP-3 peptide 10mg 99% pure third-party tested options ensure experimental reproducibility from the starting point.

https://www.puretestedpeptides.com/wp-content/uploads/2026/10/glp-3-retatrutide-research-models-how-to-separate-glp-1-gip-and-glucagon-recepto.webp 1024 1536 https://www.puretestedpeptides.com/wp-content/uploads/2026/01/buy-peptides-online.jpg 2026-10-08 13:13:042026-10-08 13:13:04GLP-3 Retatrutide Research Models: How to Separate GLP-1, GIP, and Glucagon Receptor Contributions
Retatrutide Phase 3 Cardiometabolic Endpoints: How to Interpret Triglycerides, Non-HDL Cholesterol, Blood Pressure, and hsCRP Together

Retatrutide Phase 3 Cardiometabolic Endpoints: How to Interpret Triglycerides, Non-HDL Cholesterol, Blood Pressure, and hsCRP Together

October 8, 2026/0 Comments/in Uncategorized/by

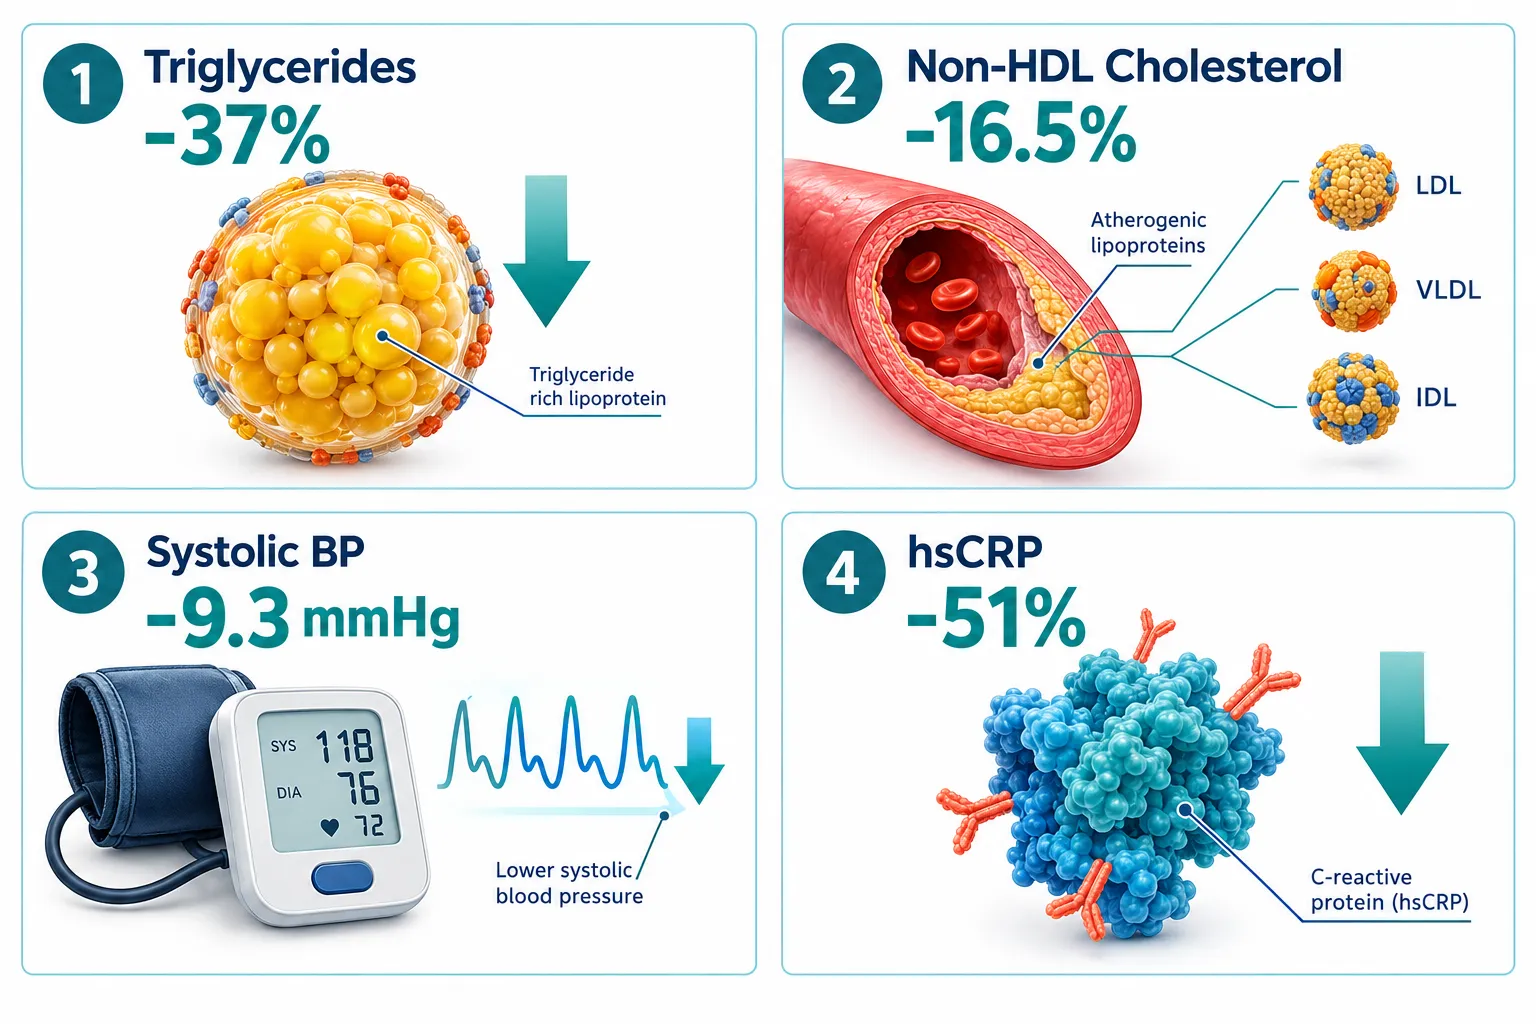
A 51% drop in high-sensitivity C-reactive protein alongside a 37% reduction in triglycerides, recorded in the same patients, at the same 80-week timepoint, is not a coincidence. It is a signal that demands careful interpretation. The TRIUMPH phase 3 program has now generated a dense cardiometabolic dataset around retatrutide, and understanding how to read Retatrutide Phase 3 Cardiometabolic Endpoints: How to Interpret Triglycerides, Non-HDL Cholesterol, Blood Pressure, and hsCRP Together requires separating what the numbers show from what they can, and cannot, prove about cardiovascular outcomes.

Key Takeaways

  • Retatrutide 12 mg produced mean weight loss of 22.6% in TRIUMPH-3, alongside reductions of 37% in triglycerides, 16.5% in non-HDL cholesterol, 9.3 mmHg in systolic blood pressure, and 51.2% in hsCRP at 80 weeks.
  • Across broader obesity populations in TRIUMPH-1 and TRIUMPH-4, these cardiometabolic effects were even larger, reaching 39.5% triglyceride reduction and 58.3% hsCRP reduction.
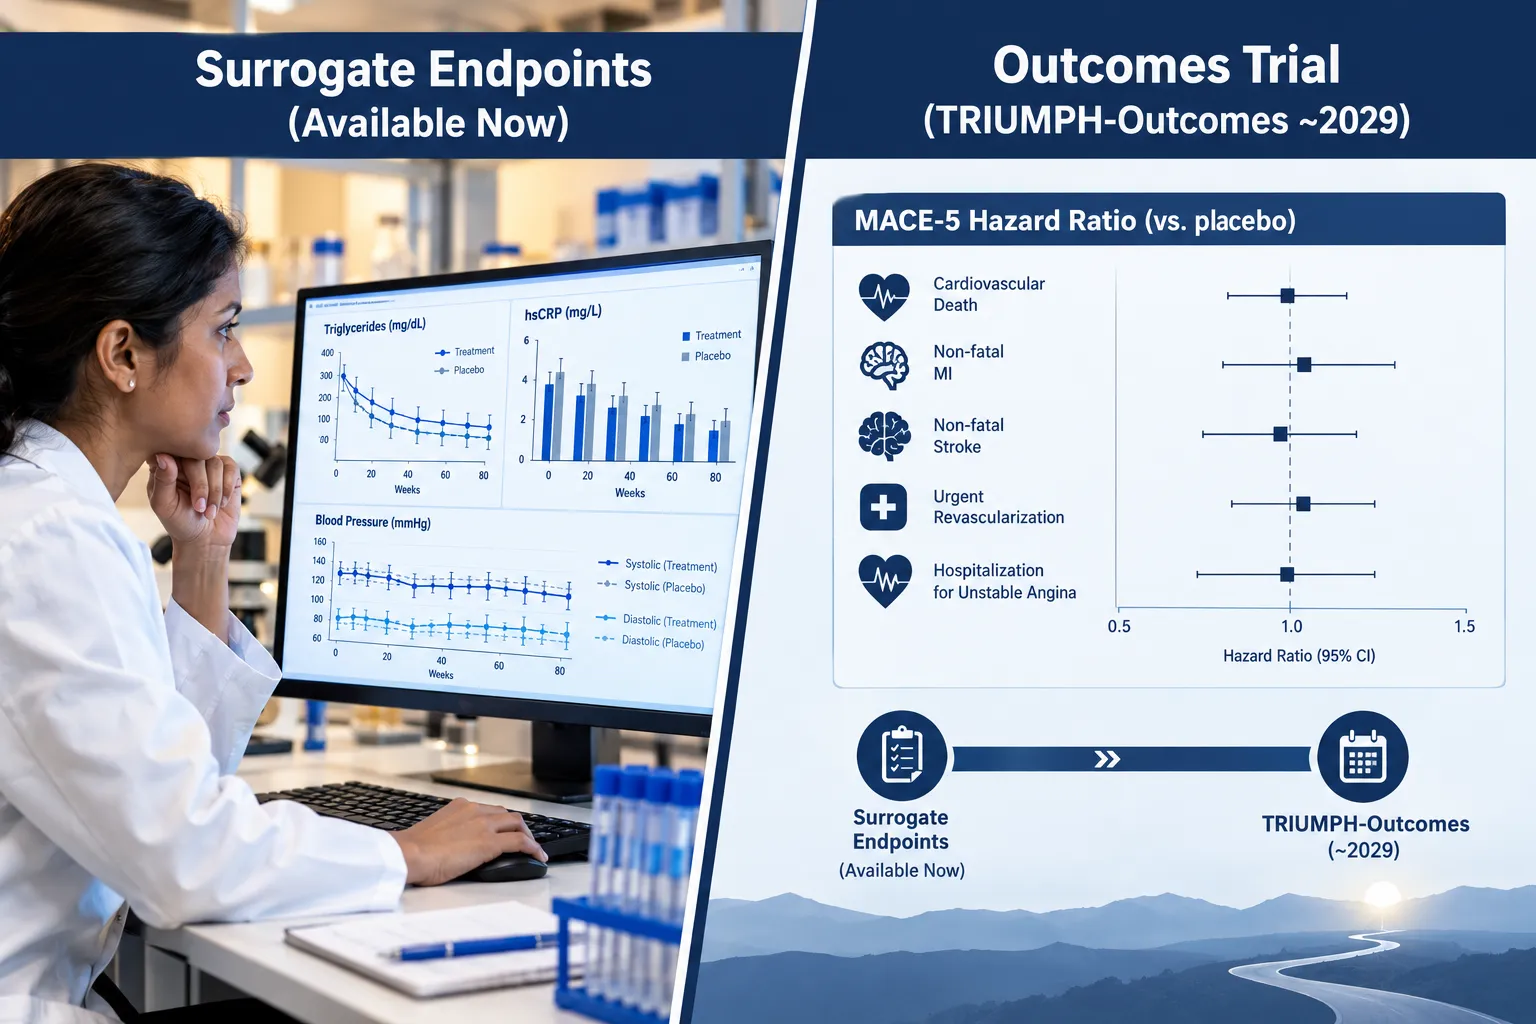
  • All four endpoints are surrogate markers, not clinical event data. The composite MACE-5 hazard ratio in TRIUMPH-3 was 0.82 but did not reach statistical significance.
  • Interpreting correlated endpoints requires understanding covariate adjustment, endpoint timing, and the distinction between weight-mediated and weight-independent effects.
  • The dedicated TRIUMPH-Outcomes cardiovascular trial is underway, with results not expected until approximately 2029 or later.

What the TRIUMPH Phase 3 Data Actually Show

The TRIUMPH program spans multiple pivotal trials. TRIUMPH-3 enrolled 1,949 adults with a BMI of 35 or higher and established cardiovascular disease. Over 80 weeks, retatrutide 12 mg delivered mean weight loss of 22.6% versus 3.2% in the control group. The cardiometabolic secondary endpoints moved in parallel:

What the TRIUMPH Phase 3 Data Actually Show

Endpoint TRIUMPH-3 (12 mg) TRIUMPH-1/TRIUMPH-4 (High Dose)
Triglycerides -37.0% -39.5%
Non-HDL Cholesterol -16.5% -19.6%
Systolic Blood Pressure -9.3 mmHg -10.8 mmHg
hsCRP -51.2% -58.3%
Waist Circumference -19.0 cm Significant reduction

In TRIUMPH-2, which studied adults with obesity or overweight and type 2 diabetes, retatrutide at 4, 9, and 12 mg produced weight losses of 12.7%, 19.1%, and 20.8%, respectively, with A1C reductions up to 1.6 percentage points. At the highest dose, systolic blood pressure fell by up to 14.0 mmHg, reinforcing that the blood pressure effect is dose-dependent and present even in a metabolically distinct population.

These findings are consistent with phase 2 data published in the NEJM, where retatrutide showed dose-dependent improvements in triglycerides, LDL cholesterol, HbA1c, and blood pressure, foreshadowing the larger phase 3 reductions across the full TRIUMPH program. Researchers following Retatrutide Clinical Trials have noted the reproducibility of these signals across different obesity phenotypes.


How to Interpret Correlated Endpoints: Separating Weight Loss from Direct Effects

This is the central interpretive challenge in Retatrutide Phase 3 Cardiometabolic Endpoints: How to Interpret Triglycerides, Non-HDL Cholesterol, Blood Pressure, and hsCRP Together. Because weight loss itself improves all four markers, it is tempting to attribute every improvement to fat mass reduction. The data suggest a more nuanced picture.

How to Interpret Correlated Endpoints: Separating Weight Loss from Direct Effects

Three interpretive principles matter here:

1. Endpoint timing relative to weight loss trajectory. Triglyceride reductions in GLP-1-class agents tend to appear early, often before peak weight loss is achieved. hsCRP reductions, by contrast, may continue to deepen as adipose-driven inflammation resolves over months. When all four endpoints are measured at the same 80-week timepoint, early and late responders are collapsed into a single number.

2. Covariate adjustment for weight change. Phase 3 secondary analyses that adjust for weight loss as a covariate can isolate the weight-independent component of each effect. Retatrutide is a triple agonist at GIP, GLP-1, and glucagon receptors. The glucagon receptor pathway has independent effects on hepatic lipid metabolism, particularly relevant to triglyceride clearance, that are not fully explained by adiposity reduction alone. Understanding GLP-1 retatrutide receptor pharmacology helps contextualize why lipid effects may exceed what weight loss alone would predict.

3. Correlation among endpoints does not imply redundancy. A patient showing large triglyceride reduction, moderate non-HDL reduction, meaningful blood pressure lowering, and substantial hsCRP reduction is experiencing improvements across three distinct cardiovascular risk axes simultaneously: atherogenic dyslipidemia, hemodynamic stress, and systemic inflammation. These are additive risk factors in atherosclerotic cardiovascular disease, and their simultaneous reduction is clinically meaningful, even before outcomes data are available.

Key distinction: Non-HDL cholesterol captures all atherogenic lipoproteins (LDL, VLDL, IDL, Lp(a)-associated particles), making it a broader risk marker than LDL alone. A 16.5% to 19.6% reduction in non-HDL represents a meaningful shift in atherogenic burden, particularly relevant in patients with residual risk despite statin therapy.


The Surrogate-to-Outcomes Gap: What the MACE Data Mean for 2026

Understanding Retatrutide Phase 3 Cardiometabolic Endpoints: How to Interpret Triglycerides, Non-HDL Cholesterol, Blood Pressure, and hsCRP Together requires honest engagement with the limits of surrogate data.

The Surrogate-to-Outcomes Gap: What the MACE Data Mean for 2026

In TRIUMPH-3, the composite MACE-5 hazard ratio was 0.82 versus control. This is a numerically encouraging signal. However, it did not reach statistical significance at 80 weeks. This means retatrutide cannot yet be claimed to reduce clinical cardiovascular events, heart attacks, strokes, or cardiovascular deaths, even in a very high-risk population with established cardiovascular disease.

All cardiovascular data available as of 2026 are based on surrogate markers. The dedicated TRIUMPH-Outcomes trial is currently underway to test whether retatrutide lowers major adverse cardiovascular events in adults with overweight or obesity and established cardiovascular disease. Results are not expected until approximately 2029 or later.

What this means for interpretation:

  • Triglyceride, non-HDL, blood pressure, and hsCRP reductions are secondary endpoints in trials designed primarily around weight management and glycemic control.
  • Expert commentaries frame the multi-axis profile as targeting atherogenic lipoproteins, hemodynamic stress, and systemic inflammation simultaneously, a potentially important profile for residual cardiovascular risk.
  • Any expectation of event reduction remains speculative pending the outcomes trial.
  • If TRIUMPH-Outcomes demonstrates meaningful MACE reduction, formal cardiovascular risk-reduction labeling would likely not be possible before the early 2030s.

Researchers tracking Retatrutide Clinical Trial developments should note that the consistency of surrogate endpoint data across TRIUMPH-1, TRIUMPH-2, TRIUMPH-3, and TRIUMPH-4 strengthens confidence in the reliability of these secondary findings, even as the outcomes question remains open. Those interested in the combination pipeline can also review data on Cagrilintide and Retatrutide for context on next-generation cardiometabolic approaches.


Conclusion

The TRIUMPH phase 3 program has produced one of the most comprehensive cardiometabolic secondary endpoint datasets in obesity pharmacology to date. Triglycerides falling 37-39%, non-HDL cholesterol declining 16-20%, systolic blood pressure dropping 9-14 mmHg, and hsCRP reducing by more than half, all at 80 weeks, represent a reproducible, multi-axis cardiometabolic signal across different obesity phenotypes and comorbidity profiles.

Actionable next steps for researchers and clinicians reviewing this data:

  • Examine covariate-adjusted analyses that isolate weight-independent lipid and inflammatory effects before attributing all improvement to fat mass reduction.
  • Treat the four endpoints as complementary axes, not redundant measures, each captures a distinct cardiovascular risk pathway.
  • Apply appropriate interpretive caution: surrogate improvements do not confirm event reduction until TRIUMPH-Outcomes reports.
  • Monitor Eli Lilly's ongoing regulatory submissions and TRIUMPH-Outcomes enrollment milestones, expected to be decisive around 2029.

The cardiometabolic profile of retatrutide is now a central part of its value proposition, not an exploratory footnote. Reading it correctly, with attention to endpoint timing, covariate structure, and the surrogate-to-outcomes gap, is essential for any rigorous assessment of this triple agonist's place in cardiovascular risk management.

https://www.puretestedpeptides.com/wp-content/uploads/2026/10/retatrutide-phase-3-cardiometabolic-endpoints-how-to-interpret-triglycerides-non.webp 1024 1536 https://www.puretestedpeptides.com/wp-content/uploads/2026/01/buy-peptides-online.jpg 2026-10-08 13:12:122026-10-08 13:12:12Retatrutide Phase 3 Cardiometabolic Endpoints: How to Interpret Triglycerides, Non-HDL Cholesterol, Blood Pressure, and hsCRP Together
Metabolic Peptide Research and Hemoglobin: When Oxygen-Carrying Capacity Becomes a Confounding Variable

Metabolic Peptide Research and Hemoglobin: When Oxygen-Carrying Capacity Becomes a Confounding Variable

October 8, 2026/0 Comments/in Uncategorized/by

Roughly one-third of all published metabolic biomarker studies fail to account for hemoglobin status in their subject populations, a methodological gap that can silently distort peptide readouts and lead researchers to false conclusions. Understanding the intersection of metabolic peptide research and hemoglobin: when oxygen-carrying capacity becomes a confounding variable is no longer optional for rigorous study design; it is foundational.

Key Takeaways

  • Hemoglobin concentration directly shapes the oxygen environment in which metabolic peptides are synthesized, released, and measured.
  • Hematocrit, hydration status, iron availability, and erythropoietic activity are upstream variables that can independently alter peptide biomarker readouts.
  • The 2,3-bisphosphoglycerate (2,3-BPG) allosteric mechanism links red cell metabolism to tissue oxygen delivery and downstream peptide signaling.
  • Failing to control for hemoglobin-related variables inflates false-positive and false-negative rates in metabolic peptide trials.
  • A structured control-panel approach, measuring CBC, ferritin, hydration markers, and hematocrit at baseline, is the most practical corrective strategy.

Why Hemoglobin Is More Than a Carrier Protein

Hemoglobin's job description extends well beyond transporting oxygen from the lungs to peripheral tissues. It functions as a finely regulated integrator of oxygen delivery and cellular metabolism, responding dynamically to pH shifts, carbon dioxide levels, temperature, and allosteric modulators such as 2,3-BPG.

Why Hemoglobin Is More Than a Carrier Protein

When tissue oxygen tension drops, whether from anemia, altitude, dehydration, or intense exercise, erythrocytes increase 2,3-BPG production. This molecule reduces hemoglobin's affinity for oxygen, promoting unloading at the tissue level. The downstream effect is a cascade of metabolic adaptations, including shifts in mitochondrial peptide signaling, changes in hypoxia-inducible factor (HIF-1alpha) activity, and altered release of exercise-related peptides such as MOTS-c. Researchers studying MOTS-c peptide as a mitochondrial-derived signal, for example, must recognize that its circulating levels are tightly coupled to the oxygen environment the mitochondria perceive, an environment shaped directly by hemoglobin status.

Key insight: Hemoglobin is not a passive backdrop. It is an active determinant of the metabolic context in which peptides operate.


How Hemoglobin, Hematocrit, and Hydration Confound Metabolic Peptide Readouts

The problem of metabolic peptide research and hemoglobin: when oxygen-carrying capacity becomes a confounding variable becomes most visible when examining how multiple erythrocyte-related factors interact simultaneously.

How Hemoglobin, Hematocrit, and Hydration Confound Metabolic Peptide Readouts

Hemoglobin Concentration

Low hemoglobin reduces oxygen delivery to metabolically active tissues. This triggers compensatory hormonal and peptide responses, including erythropoietin, certain growth hormone secretagogues, and mitochondrial stress peptides, that are unrelated to the intervention being studied. Studies examining tesa peptide benefits or visceral fat research outcomes are particularly vulnerable, because adipose tissue metabolism is highly sensitive to local oxygen availability.

Hematocrit and Plasma Volume

Hematocrit, the proportion of blood volume occupied by red cells, fluctuates with hydration. A dehydrated subject shows a falsely elevated hematocrit and a falsely concentrated peptide readout. Conversely, plasma expansion from overhydration dilutes circulating peptide concentrations without any true biological change. This hemodilution effect is a known confounder in cardiometabolic peptide biomarker studies, including those examining NT-proBNP, where anemia independently elevates the marker and mimics cardiac stress signals.

Iron and Copper Availability

Iron is the upstream determinant of hemoglobin synthesis. Iron deficiency, even before frank anemia develops, reduces erythropoietic output and alters the metabolic microenvironment. Copper deficiency compounds this by impairing ceruloplasmin-mediated iron transport. Both micronutrient gaps can shift peptide readouts in ways that mimic or mask treatment effects. Researchers exploring peptide dosing protocols need to screen for iron and ferritin status before interpreting dose-response curves.

Erythropoietic Activity

Active erythropoiesis, the bone marrow's production of new red cells, consumes significant metabolic resources and generates its own cytokine and peptide milieu. Subjects in a recovery phase after blood loss or altitude exposure will show erythropoietic peptide signals that contaminate readouts for metabolic interventions under study.


Building a Practical Control Panel for Metabolic Peptide Studies

Addressing metabolic peptide research and hemoglobin: when oxygen-carrying capacity becomes a confounding variable requires a systematic pre-study and within-study measurement framework. The table below outlines a recommended control-panel design.

Building a Practical Control Panel for Metabolic Peptide Studies

Variable Measurement Timing
Hemoglobin (Hb) Complete Blood Count (CBC) Baseline and mid-study
Hematocrit (Hct) CBC Baseline and mid-study
Serum ferritin Iron panel Baseline
Serum iron and TIBC Iron panel Baseline
Hydration status Urine specific gravity or osmolality Each sampling day
Reticulocyte count CBC differential Baseline and post-intervention
Copper/ceruloplasmin Micronutrient panel Baseline if deficiency suspected

Stratification matters. Subjects should be grouped by baseline hemoglobin category, normal, borderline low, and clinically low, before randomization. Statistical models should include hemoglobin and hematocrit as covariates, not afterthoughts. This approach is directly analogous to how researchers now handle confounding in GLP-1 receptor agonist studies, where soluble CD36 levels were found to shift independently of the intervention due to uncontrolled metabolic variables.

For peptides with known mitochondrial or oxygen-sensing mechanisms, such as those explored in synergy of LL-37 and SS-31 research, the control panel becomes even more critical. SS-31 targets the inner mitochondrial membrane and its efficacy signals are directly modulated by local oxygen tension.

Functional food research adds another dimension. Walnut oligopeptides, studied in mouse models, demonstrated anti-hypoxia effects partly by increasing hemoglobin concentration and hematocrit, meaning the peptide's apparent benefit was mediated through erythrocyte changes, not direct tissue action. Without hemoglobin tracking, that mechanism would have been invisible.

High-throughput proteomics and machine-learning diagnostic platforms are now identifying hemoglobin-derived bioactive peptides from biological matrices as metabolic agents in their own right. This dual role, hemoglobin as both a confounder and a source of bioactive fragments, makes the case for routine hemoglobin profiling in any metabolic peptide research pipeline. Researchers working with peptides and polypeptides in endocrine pharmacology contexts will find this especially relevant as multi-pathway interactions become the norm.

Hemoglobin levels have also emerged as a biomarker of systemic oxygenation linked to human longevity outcomes, reinforcing its status as a central covariate in aging and metabolic resilience studies. As the field moves toward precision peptide protocols, ignoring this variable is a design flaw, not a minor oversight.


Conclusion

The relationship between metabolic peptide research and hemoglobin, when oxygen-carrying capacity becomes a confounding variable, demands direct, structured attention from every researcher designing a metabolic peptide trial in 2026. The actionable steps are clear:

  • Screen all subjects for hemoglobin, hematocrit, ferritin, and hydration status before enrollment.
  • Stratify randomization by hemoglobin category to prevent group imbalance.
  • Include erythrocyte variables as covariates in all statistical models.
  • Standardize sampling conditions, time of day, hydration state, and activity level, to minimize within-subject variability.
  • Repeat hemoglobin measurements at key study timepoints, not just at baseline.

Researchers exploring IPA Sermorelin stack research or growth hormone-related peptide outcomes should treat this control panel as a minimum standard. The same applies to any team working with MOTS-c peptide dosage calculators where mitochondrial oxygen sensing is central to the mechanism. Hemoglobin is not background noise, it is a signal that must be measured, controlled, and reported.

https://www.puretestedpeptides.com/wp-content/uploads/2026/10/metabolic-peptide-research-and-hemoglobin-when-oxygen-carrying-capacity-becomes.webp 1024 1536 https://www.puretestedpeptides.com/wp-content/uploads/2026/01/buy-peptides-online.jpg 2026-10-08 13:11:342026-10-08 13:11:34Metabolic Peptide Research and Hemoglobin: When Oxygen-Carrying Capacity Becomes a Confounding Variable
What Is Phosphate-Buffered Saline? pH, Osmolality, Sterility, and Vehicle Controls in Peptide Research

What Is Phosphate-Buffered Saline? pH, Osmolality, Sterility, and Vehicle Controls in Peptide Research

October 8, 2026/0 Comments/in Uncategorized/by

A single degree of pH drift in a buffer solution can degrade a peptide's bioactivity by more than 50 percent before a single experiment even begins. That fact alone explains why understanding what is phosphate-buffered saline, pH, osmolality, sterility, and vehicle controls in peptide research is not a background detail, it is a foundational requirement for producing reliable data.

Phosphate-buffered saline (PBS) is the most widely used aqueous vehicle in preclinical peptide work. Yet many researchers apply it by default without verifying whether its properties actually match the peptide being studied. This article clarifies what PBS is, what its critical parameters mean, and how to use it correctly as both a solvent and a vehicle control.

Key Takeaways

  • PBS is an isotonic, phosphate-based buffer formulated to mimic physiological salt concentration and pH.
  • The target pH for standard PBS is 7.2 to 7.4, and osmolality should fall between 280 and 310 mOsm/kg.
  • Sterility and endotoxin control are non-negotiable quality criteria, especially in cell-based and in vivo peptide assays.
  • A vehicle-only control group is essential for isolating the true effect of a peptide from the effect of the buffer itself.
  • PBS is not always the optimal vehicle; some peptides require alternative buffers or pH adjustments to maintain stability.

PBS Composition and Core Properties

Phosphate-buffered saline is an aqueous solution containing sodium chloride, disodium hydrogen phosphate, and potassium dihydrogen phosphate, with potassium chloride sometimes included. These components work together to maintain a stable pH while keeping the solution isotonic with mammalian cells.

PBS Composition and Core Properties

The standard formulation targets a pH of 7.2 to 7.4 and an osmolality of 280 to 310 mOsm/kg. Both values are chosen to approximate normal physiological conditions in human and rodent tissue. When these parameters are met, PBS is considered isotonic and physiologically compatible, meaning it will not cause osmotic stress or pH-driven damage to cells during an assay.

A common variant is Dulbecco's PBS (DPBS), which is available with or without calcium and magnesium ions. The calcium- and magnesium-free version is preferred in most peptide and cell-dissociation protocols because divalent cations can interfere with certain peptide conformations and promote unwanted aggregation.

Key compositional parameters at a glance:

Parameter Standard PBS Target
pH 7.2-7.4
Osmolality 280-310 mOsm/kg
Sodium chloride ~137 mM
Phosphate concentration ~10 mM
Endotoxin limit Less than 0.1 EU/mL

pH, Osmolality, and Sterility in Peptide Research

Understanding what is phosphate-buffered saline, pH, osmolality, sterility, and vehicle controls in peptide research requires looking at each parameter as a potential source of experimental error.

pH stability is critical because most peptides carry ionizable side chains. Even a modest shift from pH 7.4 to pH 6.8 can alter the charge state of histidine, lysine, or aspartate residues, changing solubility, folding, and receptor binding. PBS resists pH drift through its phosphate buffering capacity, but that resistance is not unlimited. Dilution, CO2 absorption from ambient air, and freeze-thaw cycles can all shift pH outside the acceptable window. Researchers working with peptides such as those explored in SS-31 mitochondrial research themes should verify pH at the time of use, not just at preparation.

Osmolality drift is a subtler problem. Adding a concentrated peptide stock to PBS can raise osmolality above the isotonic range if the stock volume is significant relative to the total. Hyperosmotic solutions cause cell shrinkage and can trigger stress responses that confound results. Measuring osmolality with a calibrated osmometer before each experiment is best practice, particularly for in vivo dosing.

Sterility and endotoxin control represent the most consequential quality criteria in 2026. Commercial PBS products intended for cell culture and in vivo use are typically manufactured under USP-aligned sterility protocols, with no bacterial growth observed at 14 days. Endotoxin limits are set at less than 0.1 EU/mL, because even trace lipopolysaccharide contamination can trigger inflammatory responses that mask or amplify a peptide's apparent effect. Researchers sourcing lab-tested peptides should apply the same scrutiny to their buffer as they do to the peptide itself.

"The buffer is not inert. Every property of PBS, pH, osmolality, ionic strength, and sterility, becomes part of the experimental condition the moment it contacts a peptide."

Sterile filtration through a 0.22-micron membrane is the standard method for preparing PBS in-house. Autoclaving is less preferred because high heat can alter phosphate equilibria and shift pH.


Vehicle Controls and Buffer Optimization in Peptide Experiments

The most overlooked application of PBS in peptide research is its role as a vehicle control. A vehicle control group receives the same volume of PBS by the same route and at the same time as the treatment group, but without the peptide. This design element is essential for distinguishing the biological effect of the peptide from any effect caused by the injection itself, the volume delivered, or minor buffer-related stress.

Vehicle Controls and Buffer Optimization in Peptide Experiments

Without a vehicle control, a researcher cannot confidently attribute an observed outcome to the peptide. This matters especially for peptides studied in metabolic, neurological, or inflammatory contexts, areas where PBS alone can produce measurable physiological responses at larger volumes or in sensitive models.

When PBS is appropriate as a peptide vehicle:

  • The peptide is stable at pH 7.2 to 7.4
  • The peptide does not require organic co-solvents for solubility
  • The assay uses mammalian cells or rodent models where isotonic conditions are required
  • Endotoxin-free formulation is available

When PBS may not be the right choice:

  • Peptides with hydrophobic sequences often require DMSO or acetic acid as a co-solvent
  • Peptides sensitive to phosphate (some calcium-binding sequences) may aggregate in PBS
  • Acidic or basic peptides may require a buffer with a different pH range

The emerging consensus in 2026 is that researchers should optimize buffer choice for each peptide rather than defaulting to PBS. For example, GHK-Cu peptide formulations often benefit from slightly acidic buffers that preserve the copper-peptide complex, while GLP-1 peptides used in metabolic research are frequently formulated in PBS with added stabilizers. Researchers comparing peptides, such as those evaluating SLU-PP-332 versus MOTS-C, should use identical vehicle conditions in both arms to ensure the comparison is valid.

For peptides stored long-term, PBS is generally not the preferred medium. Lyophilized peptide reconstituted in sterile water and stored at -80°C outperforms PBS storage in most stability analyses, because phosphate ions can catalyze hydrolysis of certain peptide bonds over time. When PBS is used for short-term working solutions, single-use aliquots minimize freeze-thaw degradation.

Researchers working with mitochondria-targeted compounds can find additional context in the SS-31 kidney health research literature, where PBS vehicle controls are used consistently to isolate peptide-specific renoprotective effects.

Vehicle Controls and Buffer Optimization in Peptide Experiments


Conclusion

PBS remains the default buffer in peptide research for good reasons: it is isotonic, physiologically compatible, and well-characterized. However, treating it as a passive background component is a methodological error. pH must be verified at the point of use, osmolality should be measured when adding concentrated peptide stocks, and sterility plus endotoxin status must meet validated thresholds before any in vivo or cell-based application.

Actionable next steps for researchers:

  1. Measure pH and osmolality of every PBS preparation before use, do not rely solely on the manufacturer's certificate of analysis.
  2. Include a vehicle-only control group in every peptide experiment to isolate the peptide's true effect.
  3. Evaluate whether PBS is actually the optimal vehicle for each specific peptide, or whether a different buffer pH, ionic strength, or co-solvent is warranted.
  4. Use endotoxin-free, sterile-filtered PBS for all cell-based and in vivo work, and document the lot number and endotoxin test result.
  5. Store peptide working solutions as single-use aliquots in PBS to avoid freeze-thaw degradation.

Applying these practices consistently will strengthen the reproducibility and interpretability of peptide research data in 2026 and beyond.

https://www.puretestedpeptides.com/wp-content/uploads/2026/10/what-is-phosphate-buffered-saline-ph-osmolality-sterility-and-vehicle-controls-i.webp 1024 1536 https://www.puretestedpeptides.com/wp-content/uploads/2026/01/buy-peptides-online.jpg 2026-10-08 13:11:222026-10-08 13:11:22What Is Phosphate-Buffered Saline? pH, Osmolality, Sterility, and Vehicle Controls in Peptide Research
Retatrutide Phase 3 Diabetes Data: Designing Research Models Around A1C, Glucose Exposure, Weight Loss, and Dose Escalation

Retatrutide Phase 3 Diabetes Data: Designing Research Models Around A1C, Glucose Exposure, Weight Loss, and Dose Escalation

October 8, 2026/0 Comments/in Uncategorized/by

Only one drug in the current cardiometabolic pipeline simultaneously activates GLP-1, GIP, and glucagon receptors, and its Phase 3 data are now reshaping how researchers design glycemic studies. Retatrutide Phase 3 diabetes data, drawn from the TRANSCEND and TRIUMPH trial programs, offer an unusually rich dataset for modeling the relationship between A1C reduction, glucose area under the curve (AUC), body weight loss, and structured dose escalation. For researchers building preclinical or translational models, understanding how to separate direct glycemic effects from weight-mediated effects is now a central methodological challenge.

Key Takeaways

  • Retatrutide Phase 3 diabetes data from TRANSCEND-T2D and TRIUMPH-2 provide robust endpoints for A1C, fasting glucose, and body weight in type 2 diabetes populations.
  • Glucose AUC and A1C timing data allow researchers to model direct glycemic receptor effects independently of body-weight-mediated insulin sensitization.
  • Dose escalation protocols in Phase 3 trials (ranging from 2 mg to 24 mg weekly) are critical variables when designing exposure-response research models.
  • Placebo-adjusted analysis is essential for isolating the true pharmacodynamic signal in both glycemic and weight outcomes.
  • The dual burden of hyperglycemia and obesity in trial populations makes retatrutide a uniquely informative compound for integrated cardiometabolic research.
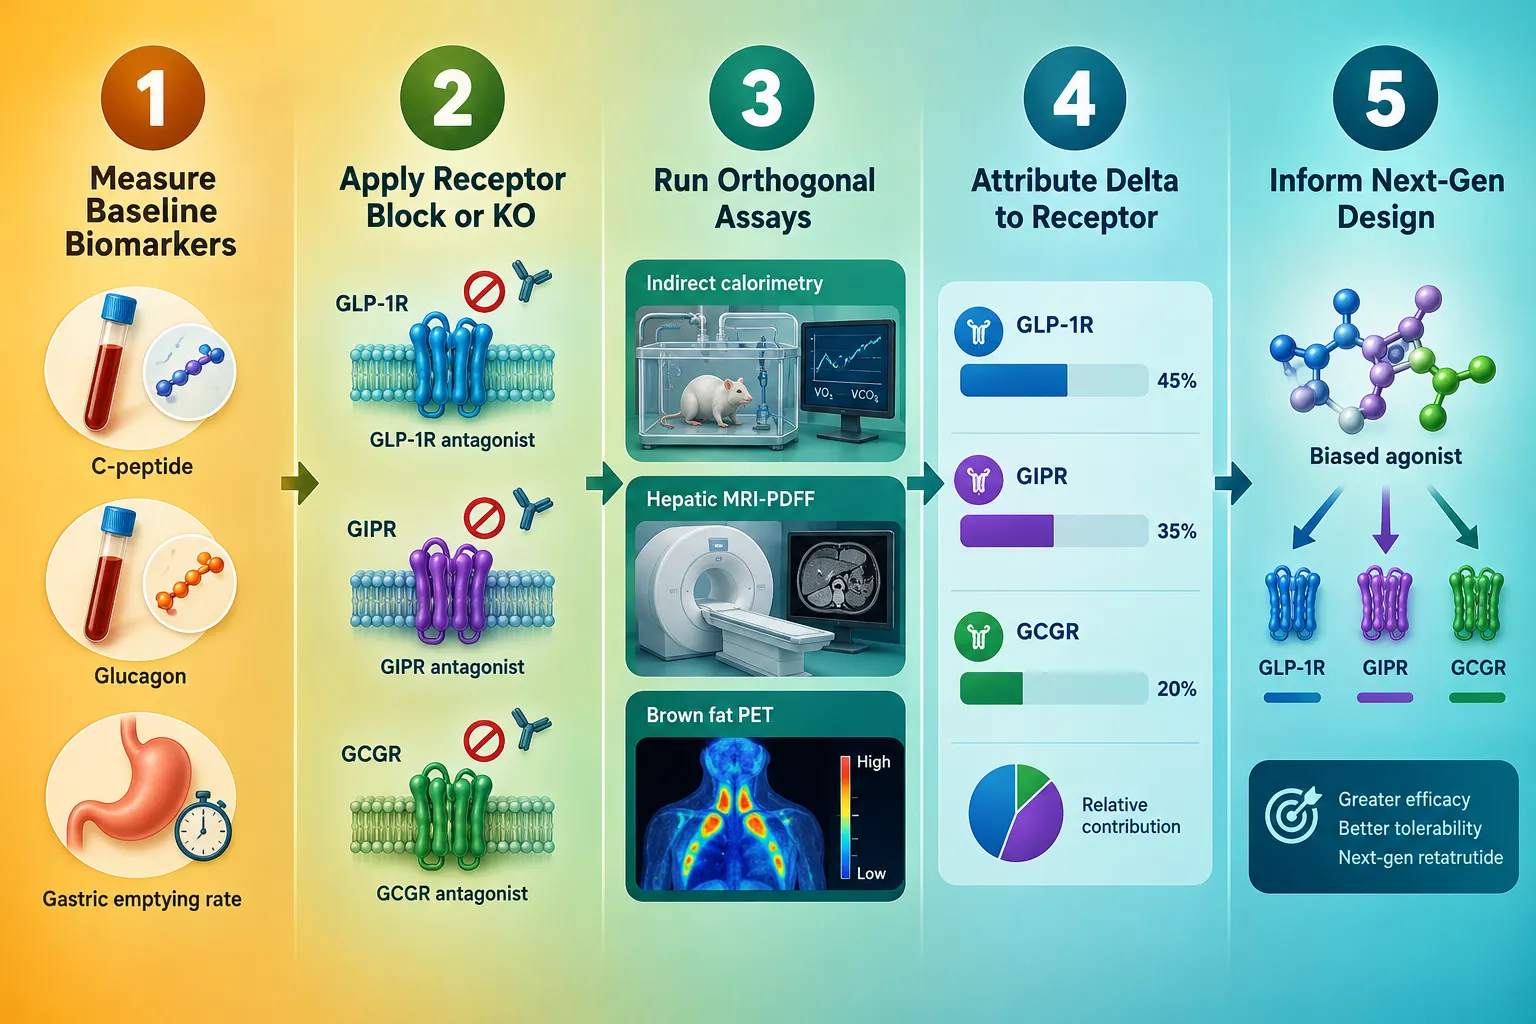
Understanding the Phase 3 Trial Architecture

The TRANSCEND-T2D program is the dedicated diabetes efficacy arm of retatrutide's Phase 3 development. TRANSCEND-T2D-1 enrolled adults with type 2 diabetes and suboptimal glycemic control, using A1C reduction as the primary endpoint alongside fasting plasma glucose and body weight. The trial design included a structured dose escalation schedule, beginning at 2 mg weekly and titrating upward over several weeks to target maintenance doses of 8 mg or 12 mg.

Understanding the Phase 3 Trial Architecture

What makes this data particularly valuable for research modeling is the granularity of glycemic endpoints. A1C was measured at multiple timepoints, and continuous glucose monitoring data in select cohorts provided glucose AUC profiles across fasting and postprandial windows. This allows researchers to distinguish early pharmacodynamic effects, driven by direct receptor activation, from later improvements that correlate more closely with cumulative weight loss.

The broader TRANSCEND-T2D program extends follow-up to 52 weeks and beyond, providing chronic exposure data that are essential for modeling long-term glucose normalization trajectories. Researchers exploring Retatrutide Endpoints will find the TRANSCEND dataset particularly useful for establishing dose-response relationships across glycemic variables.


Separating Glycemic Effects from Weight-Mediated Effects in Retatrutide Phase 3 Diabetes Data

This is the core methodological question that Retatrutide Phase 3 diabetes data: designing research models around A1C, glucose exposure, weight loss, and dose escalation must address. Retatrutide produces two partially overlapping but mechanistically distinct effects: direct incretin-mediated glycemic control and indirect glycemic improvement driven by fat mass reduction and restored insulin sensitivity.

Separating Glycemic Effects from Weight-Mediated Effects in Retatrutide Phase 3 Diabetes Data

Direct glycemic effects are detectable early, often within the first four weeks, before significant weight loss has accumulated. These include:

  • Reduced fasting plasma glucose via GLP-1 receptor-mediated insulin secretion
  • Suppressed glucagon secretion through glucagon receptor agonism at pharmacological doses
  • Improved postprandial glucose AUC through slowed gastric emptying

Weight-mediated glycemic effects emerge later and are characterized by:

  • Progressive improvement in insulin sensitivity correlated with fat mass reduction
  • Declining HOMA-IR scores tracking body weight trajectory
  • A1C reductions that continue after glucose-lowering receptor effects plateau

"Placebo-adjusted A1C delta at Week 12 versus Week 52 provides a practical window for separating these two mechanisms in research model design."

The TRIUMPH-2 trial, which enrolled participants with both obesity and type 2 diabetes, is especially informative here. TRIUMPH-2 reported substantial A1C reductions alongside body weight losses exceeding 20% from baseline at higher doses. By comparing A1C trajectories against weight-loss kinetics, researchers can use time-lagged regression models to quantify the independent glycemic contribution of the drug's receptor activity.

For researchers interested in related dual-mechanism compounds, the Cagrilintide And Retatrutide combination data offer a complementary framework for modeling additive glycemic and weight effects.


Dose Escalation as a Research Variable: Modeling Exposure-Response Relationships

Dose escalation design is not merely a safety protocol, it is a primary research variable in Retatrutide Phase 3 diabetes data: designing research models around A1C, glucose exposure, weight loss, and dose escalation. The Phase 3 programs used weekly subcutaneous dosing with escalation steps at defined intervals, creating a natural dose-exposure ladder that researchers can exploit for pharmacokinetic-pharmacodynamic (PK-PD) modeling.

Dose Escalation as a Research Variable: Modeling Exposure-Response Relationships

Key dose escalation parameters from Phase 3 data include:

Escalation Stage Weekly Dose Primary Research Signal
Initiation 2 mg Tolerability, early GLP-1 effect
Mid-escalation 4-8 mg A1C inflection, glucose AUC shift
Maintenance 12-24 mg Maximum weight loss, sustained A1C

Phase 3b studies without diabetes populations provide a useful comparator, allowing researchers to isolate the weight-loss contribution to glycemic improvement by modeling the delta between diabetic and non-diabetic cohorts at equivalent doses.

For researchers sourcing compounds for preclinical work, GLP-1 Retatrutide and GLP-3 Retatrutide Buy Online USA pages provide relevant product information. Those evaluating quantity options may also review Reta 20mg For Sale and GLP-3 Reta 30mg For Sale for research-grade availability.

The TRIUMPH-1 and TRIUMPH-4 trials, focused primarily on obesity without diabetes, extend the dose-response dataset by providing weight-loss curves at equivalent dose levels without the confounding variable of baseline hyperglycemia. This cross-trial comparison is a powerful tool for building research models that quantify the glycemic benefit attributable solely to weight reduction.


Conclusion

Retatrutide Phase 3 diabetes data: designing research models around A1C, glucose exposure, weight loss, and dose escalation represents one of the most data-rich opportunities in current cardiometabolic research. The TRANSCEND and TRIUMPH programs together provide a structured, multi-dose, multi-timepoint dataset that enables researchers to disentangle direct receptor-mediated glycemic effects from weight-loss-driven improvements.

Actionable next steps for researchers:

  1. Use early-timepoint A1C and glucose AUC data (Weeks 4-12) to establish direct glycemic receptor effect baselines before significant weight loss accumulates.
  2. Apply placebo-adjusted analysis at each dose level to isolate the true pharmacodynamic signal from regression to the mean.
  3. Leverage the TRIUMPH-2 versus TRIUMPH-1 cross-trial comparison to quantify the weight-mediated glycemic contribution at matched dose levels.
  4. Incorporate dose escalation timing as a covariate in PK-PD models to account for exposure-dependent receptor desensitization.
  5. Validate preclinical models against the Phase 3 dose-response ladder before extrapolating to novel endpoints.

The depth of available Phase 3 data makes retatrutide a uniquely powerful reference compound for integrated glycemic and metabolic research model design in 2026.

https://www.puretestedpeptides.com/wp-content/uploads/2026/10/retatrutide-phase-3-diabetes-data-designing-research-models-around-a1c-glucose-e.webp 1024 1536 https://www.puretestedpeptides.com/wp-content/uploads/2026/01/buy-peptides-online.jpg 2026-10-08 13:11:152026-10-08 13:11:15Retatrutide Phase 3 Diabetes Data: Designing Research Models Around A1C, Glucose Exposure, Weight Loss, and Dose Escalation
Page 4 of 80«‹23456›»
×

Helpful Links

  • My account
  • Cart
  • Checkout
  • Refund and Returns Policy
  • Privacy Policy
  • SMS Privacy Policy
  • Login
  • My Account
  • Logout

USA Made Lab Tested Peptides

All products are sold for research, laboratory, or analytical purposes only, and are not for human consumption


Pure Tested Peptides is a chemical supplier. Pure Tested Peptides is not a compounding / chemical compounding facility as defined under 503A of the Federal Food, Drug, and Cosmetic act. Pure Tested Peptides is not an outsourcing facility as defined under 503B of the Federal Food, Drug, and Cosmetic act.

The statements made within this website have not been evaluated by the US Food and Drug Administration. The products we offer are not intended to diagnose, treat, cure or prevent any disease.

Human/Animal Consumption Prohibited. Laboratory/In-Vitro Experimental Use Only

Scroll to top Scroll to top Scroll to top