Call or Text 727-513-9780
  • Shopping Cart Shopping Cart
    0Shopping Cart
Pure Tested Peptides | America's most trusted Peptides for sale online
  • Peptides for sale
    • Oral Peptides for sale
      • Peptide Capsules for sale
      • BPC 157 Capsules 1000mcg
      • SLU-PP-332 Capsules | 1000 mcg
      • 5-Amino-1MQ 50mg Capsules
      • Tesofensine 500mcg
    • All Peptides for sale
    • Peptide Sprays
      • BPC 157 Nasal Spray Kit
      • BPC-157 TB500 Nasal Spray Kit
      • Semax Nasal Spray 10mg
      • Selank – Nasal Spray Kit – 10mg
      • Epithalon 50MG Nasal Spray Kit
      • Ipamorelin 10mg Nasal Spray
      • Klow Nasal Spray (BPC-157 + TB-500 + GHK-Cu + KPV) | 80mg
      • Hulk Nasal Spray Tesa / Ipa Blend 6/3 MG
      • Klow Nasal Spray
      • NAD + 500 mg Nasal Spray
      • PT-141 Nasal Spray Kit
    • GHRH Peptides
      • Ipa Peptides
      • CJC-1295 Peptides
        • CJC-1295 with DAC 5 mg
        • CJC-1295 without DAC 5 mg
        • CJC-1295 Ipa 10mg
      • Tesa Peptides
        • Tesa Peptide
        • Tesa 20 mg
    • GHK-Cu Peptides
      • All GHK-Cu Peptides
      • GHK-Cu 100mg
      • KLOW Peptide Blend – Buy KLOW blend online
    • BPC Peptides
      • All BPC Peptides
      • BPC-157
      • BPC-157 TB-500
      • BPC 157 capsules 1000mcg
    • SLU-PP-332 Peptides
      • All SLU-PP-332 Peptides
      • SLU-PP-332 5mg
    • GLP3 Peptides
    • PT-141 Peptides
      • PT-141 Peptides for sale
      • PT-141 10mg
      • PT-141 Nasal Spray
    • CAG Peptides
      • Lipo-C Peptide Blend
      • CAG 5mg
      • CAG 10mg
    • MOTS-C Peptides
      • MOTS-C Peptides for sale
      • MOTS-c peptide
      • MOTS-c 10mg *6 pack*
    • 5 Amino 1MQ Peptides
      • 5 Amino 1MQ Peptides for sale
      • 5-Amino-1MQ 50mg Capsules
      • 5-Amino-1MQ 5mg
    • Epithalon Peptides
      • Epithalon Peptides for sale
      • Epithalon 10mg
      • Epithalon 50mg
  • Shop
    • GLPs
      • 5-Amino-1MQ 50mg Capsules
      • 5-Amino-1MQ 5mg
      • L-Carnitine 500mg/ml
      • Tesofensine 500mcg
      • SLU-PP-332 5mg
      • MOTS-c 10mg *6 pack*
    • Epithalon & BPC Peptides
      • Epithalon 10mg
      • Epithalon 50mg
      • BPC-157
      • BPC 157 capsules 1000mcg
      • BPC-157 TB-500
      • BPC-157 TB500 Nasal Spray Kit
      • BPC 157 Nasal Spray Kit
    • BPC TB-500 & NAD+ Peptides
      • NAD+ 500 mg
      • KLOW Peptide Blend – Buy KLOW blend online
      • GLOW Peptide Blend
      • TB 500 5mg
      • BPC 157 capsules 1000mcg – Supplement
      • BPC 157 Nasal Spray Kit
      • BPC-157
      • BPC-157 TB500 Nasal Spray Kit
      • BPC-157 TB-500
      • BPC 157 capsules 1000mcg
    • LL-37 Peptide
      • LL-37 10 mg
    • MOTS-C & Selank
      • MOTS-c peptide
      • Selank 10mg
    • GHK Peptides
      • GHK-Cu 100mg
      • GLOW Peptide Blend
      • KLOW Peptide Blend – Buy KLOW blend online
  • COAs
  • Wholesale
    • Wholesale Peptides for sale
  • PTP FAQ
  • Affiliates
    • Selank Peptide: Advanced Pharmacological Mechanisms Underlying Its Anxiolytic and Nootropic Effects in Research
      • 5-Amino-1MQ Peptide: Detailed Mechanisms of NNMT Inhibition and Its Impact on Cellular Metabolism Research
        • MOTS-C Peptide: Unraveling Its Role in Mitochondrial Dynamics and Energy Metabolism Research
          • Epithalon Peptide and Telomerase Regulation: Investigating Its Impact on Cellular Senescence and Lifespan Research Models
            • GLP2-T vs GLP2 Tirz Peptide: Understanding the Naming, Mechanistic Nuances, and Research Implications for Gut Health
      • Peptides and Polypeptides in Modern Pharmacology: What Research on Metoprolol, Prednisone, and Amlodipine Reveals
        • Polypeptide Peptides vs NSAIDs: What Naproxen and Diclofenac Teach Tissue-Repair Researchers About BPC‑157 and TB‑500
          • Peptides and Polypeptides in Endocrine Pharmacology: How GLP-1, GLP-2, and GLP-3 Retatrutide Differ From Classic Drugs Like Prednisone and Amlodipine
          • 5‑Amino‑1MQ Peptide and NNMT Inhibition: How It Compares With Statins Like Atorvastatin in Adipose and Lipid Metabolism Research
      • Enclomiphene, Estrogen Receptor Signaling, and Luteinizing Phase Biology: What Hormone Researchers Should Measure
        • Mesenchymal Stem Cells, BPC‑157, and GHK‑Cu: How Tissue Repair Peptides Compare With Classic NSAIDs Like Naproxen in Injury Models
          • Peptide Calculator Use Cases Beyond Growth Hormone: Working Through GLP‑3 Retatrutide, MOTS‑c, and BPC‑157 Research Dosing
        • Polypeptide Peptides in Endocrine and Metabolic Pharmacology: Lessons From Amlodipine, Prednisone, and Metoprolol
        • Peptides Calculator for Advanced Blends: Worked Examples for Tesamorelin, CJC‑1295, and Ipamorelin Stacks
          • Peptides and Polypeptides in Human Physiology: How Molecular Size Shapes Research Applications
            • Selank Peptide: Advanced Pharmacological Mechanisms Underlying Its Anxiolytic and Nootropic Effects in Research
          • 5-Amino-1MQ Peptide: Detailed Mechanisms of NNMT Inhibition and Its Impact on Cellular Metabolism Research
            • MOTS-C Peptide: Unraveling Its Role in Mitochondrial Dynamics and Energy Metabolism Research
              • Epithalon Peptide and Telomerase Regulation: Investigating Its Impact on Cellular Senescence and Lifespan Research Models
                • GLP2-T vs GLP2 Tirz Peptide: Understanding the Naming, Mechanistic Nuances, and Research Implications for Gut Health
                  • Peptides and Polypeptides in Endocrine Pharmacology: How GLP-1, GLP-2, and GLP-3 Retatrutide Differ From Classic Drugs Like Prednisone and Amlodipine
                    • Polypeptide Peptides vs NSAIDs: What Naproxen and Diclofenac Teach Tissue-Repair Researchers About BPC‑157 and TB‑500
                      • Peptides and Polypeptides in Modern Pharmacology: What Research on Metoprolol, Prednisone, and Amlodipine Reveals
                        • 5‑Amino‑1MQ Peptide and NNMT Inhibition: How It Compares With Statins Like Atorvastatin in Adipose and Lipid Metabolism Research
                        • Enclomiphene, Estrogen Receptor Signaling, and Luteinizing Phase Biology: What Hormone Researchers Should Measure
                        • Mesenchymal Stem Cells, BPC‑157, and GHK‑Cu: How Tissue Repair Peptides Compare With Classic NSAIDs Like Naproxen in Injury Models
                        • Peptide Calculator Use Cases Beyond Growth Hormone: Working Through GLP‑3 Retatrutide, MOTS‑c, and BPC‑157 Research Dosing
                        • Polypeptide Peptides in Endocrine and Metabolic Pharmacology: Lessons From Amlodipine, Prednisone, and Metoprolol
                        • Peptides Calculator for Advanced Blends: Worked Examples for Tesamorelin, CJC‑1295, and Ipamorelin Stacks
                        • Peptides and Polypeptides in Human Physiology: How Molecular Size Shapes Research Applications
                        • Selank Peptide: Advanced Pharmacological Mechanisms Underlying Its Anxiolytic and Nootropic Effects in Research
                        • MOTS-C Peptide: Unraveling Its Role in Mitochondrial Dynamics and Energy Metabolism Research
                        • Peptides and Polypeptides in Modern Pharmacology: What Research on Metoprolol, Prednisone, and Amlodipine Reveals
                        • Peptides and Polypeptides in Endocrine Pharmacology: How GLP-1, GLP-2, and GLP-3 Retatrutide Differ From Classic Drugs Like Prednisone and Amlodipine
                        • 5-Amino-1MQ Peptide: Detailed Mechanisms of NNMT Inhibition and Its Impact on Cellular Metabolism Research
                        • Mesenchymal Stem Cells, BPC‑157, and GHK‑Cu: How Tissue Repair Peptides Compare With Classic NSAIDs Like Naproxen in Injury Models
                        • Peptide Calculator Use Cases Beyond Growth Hormone: Working Through GLP‑3 Retatrutide, MOTS‑c, and BPC‑157 Research Dosing
                        • GLP2-T vs GLP2 Tirz Peptide: Understanding the Naming, Mechanistic Nuances, and Research Implications for Gut Health
                        • Polypeptide Peptides in Endocrine and Metabolic Pharmacology: Lessons From Amlodipine, Prednisone, and Metoprolol
                        • Polypeptide Peptides vs NSAIDs: What Naproxen and Diclofenac Teach Tissue-Repair Researchers About BPC‑157 and TB‑500
                        • Peptides and Polypeptides in Human Physiology: How Molecular Size Shapes Research Applications
                        • Peptides Calculator for Advanced Blends: Worked Examples for Tesamorelin, CJC‑1295, and Ipamorelin Stacks
                        • 5‑Amino‑1MQ Peptide and NNMT Inhibition: How It Compares With Statins Like Atorvastatin in Adipose and Lipid Metabolism Research
                        • Enclomiphene, Estrogen Receptor Signaling, and Luteinizing Phase Biology: What Hormone Researchers Should Measure
                        • Epithalon Peptide and Telomerase Regulation: Investigating Its Impact on Cellular Senescence and Lifespan Research Models
                        • Best research protocol Klow blend
                        • best time to take BPC-157
                        • best time to take DSIP (Delta Sleep Inducing Peptide)
                        • best time to take CJC-1295
                        • best time to take AOD-9604
                        • best time to take Follistatin 344
                        • best time to take Ipamorelin
                        • best time to take MK-677 (Ibutamoren)
                        • best time to take Ligandrol (LGD-4033) — research compound
                        • best time to take Ostarine (MK-2866) — research compound
                        • best time to take GHK-CU
                        • best time to take TB-500
                        • best time to take MOTS-c
                        • best time to take Semax
                        • best time to take RAD-140 (Testolone) — research compound
                        • best time to take Thymosin Alpha-1
                        • best time to take PEG-MGF
                        • Biolife Plasma, Octapharma Plasma, and Research Peptides: How Plasma Donation Labs Differ From Peptide Suppliers
                        • best time to take YK-11 — research compound
                        • best time to take PT-141 (Bremelanotide)
                        • Best research protocol Klow blend
                        • 5-Amino-1MQ and MOTS-C Synergy: Metabolic Signaling, Mitochondria, and Research Design
                        • BPC-157 and TB-500: Investigating Their Combined Effects on Angiogenesis and Cellular Migration in Tissue Repair Models
                        • BPC-157 Peptide: Gut Barrier Function, Inflammation, and Tissue-Recovery Research
                        • 5‑Amino‑1MQ and MOTS‑c Synergy in Metabolic Research: Designing NNMT and Mitochondrial Biogenesis Stacks
                        • CJC-1295 with DAC vs. Without DAC: Half-Life, Release Kinetics, and Research Implications
                        • CJC‑1295 with DAC vs. Without DAC: Expanding on Half‑Life Differences Using Tesamorelin and Ipamorelin Blend Case Studies
                        • Collagen Biology and Copper‑Binding Peptides: How GHK‑Cu, Glow Blend, and Klow Blend Interact with Skin and Connective Tissue
                        • Collagen Biology and Regenerative Peptides: How GHK‑Cu, Glow Blend, and Klow Blend Affect Extracellular Matrix Research
                    • DNA, Telomeres, and Longevity Peptides: Positioning Epithalon and MOTS‑c in Genetic Aging Research
                      • Enclomiphene Citrate: serm Mechanism, Testosterone Research, and Stack Compatibility
                        • Enclomiphene vs Enclomiphene Citrate: Formulation, Bioavailability, and Research Distinctions
                        • Epithalon Peptide Research: Telomerase Activation, Aging, and Pineal Gland Function
                        • Estrogen Receptor Signaling and Enclomiphene: How Selective Modulators Compare with Classic Polypeptide Hormones
                        • GHK-Cu Peptide: Advanced Mechanisms in Extracellular Matrix Remodeling and Wound Healing Research
                        • GHK-Cu Peptide: Collagen Synthesis, Wound Repair, and Skin-Barrier Research Models
                        • GLP-1 vs GLP-3 vs GLP-2: Peptide Classification and Research Applications
                        • GLP-2 Peptide Research Guide: Gut Barrier Function, Nutrient Absorption, and Intestinal Recovery Models
                        • GLP-3 Retatrutide vs. GLP-1 Drugs: What Triple-Agonist Biology Changes in Research Models
                        • Ipamorelin and Tesamorelin Combination: Synergistic GH Secretagogue Research and Dosing Protocols
                        • GLP2 Tirz Peptide: What It Is, Why the Name Exists, and How Researchers Should Interpret It
                        • Klow Blend Peptide Nasal Spray: What the Formulation Is Trying to Do in Cognitive Research
                        • Mitochondria, NNMT Inhibition, and Peptide Modulators: Where MOTS‑c and 5‑Amino‑1MQ Fit in Cellular Energy Research
                        • MOTS-c Peptide: Mitochondrial Function, Energy Metabolism, and What Researchers Measure
                        • MOTS-c vs. 5-Amino-1MQ: Which Metabolic Research Questions Each Compound Actually Answers
                        • Nasal Spray Peptides: Bioavailability, Administration, and Semax/Selank Research Applications
                        • PT-141 Peptide Research: Mechanism of Action and Melanocortin Receptor Signaling
                        • Retatrutide for Research: Mechanism, Structure, and GLP-1/GLP-3 Dual Action
                        • Retatrutide for Obesity and Type 2 Diabetes: What the Latest Trial Data Suggest
                        • Tesofensine Peptide Research: Mechanism, Appetite Suppression, and Neuropeptide Y Pathways
  • Contact
    • Contact Customer Service
    • Text Customer Support
  • About US
  • Shop all peptides
  • Affiliate Program
    • Affiliate Signup
  • Login / Register Login / Register Page Link Login / Register Page Link
  • Click to open the search input field Click to open the search input field Search
  • Menu Menu
Complement-Dependent Cytotoxicity in GLP-3 and BPC-157 Studies: What New Safety Data Signals Mean for Peptide Researchers in 2026

Complement-Dependent Cytotoxicity in GLP-3 and BPC-157 Studies: What New Safety Data Signals Mean for Peptide Researchers in 2026

September 28, 2026/0 Comments/in Uncategorized/by

Fewer than ten serious adverse event reports in a public pharmacovigilance database might seem trivial, until those reports involve a peptide that millions of athletes and biohackers are already self-administering. As of September 2026, the FDA Adverse Event Reporting System lists ten serious reports linked to BPC-157 since 2021, a number that, combined with emerging immunogenicity concerns around GLP-3 receptor agonists, has pushed complement-dependent cytotoxicity (CDC) to the center of peptide safety discourse. Understanding what complement-dependent cytotoxicity in GLP-3 and BPC-157 studies means for peptide researchers in 2026 is no longer optional, it is a prerequisite for responsible laboratory work.

Key Takeaways

  • Complement-dependent cytotoxicity is a specific immune mechanism in which antibody binding to a target cell activates the complement cascade, leading to cell lysis, and it is an underexamined endpoint in current peptide safety studies.
  • BPC-157 has no FDA approval, is banned by WADA, and carries a Category 2 bulk substance designation; its human safety data remains limited to small pilots.
  • GLP-3 receptor agonist research lacks published CDC-specific data as of 2026, requiring researchers to extrapolate from broader peptide immunology frameworks.
  • Ten serious FAERS reports involving BPC-157 since 2021 represent an early pharmacovigilance signal that warrants structured monitoring protocols.
  • Practical CDC risk assessment for peptide labs should incorporate purity verification, anti-drug antibody screening, and systematic adverse event cross-referencing.

Understanding Complement-Dependent Cytotoxicity in the Context of Peptide Research
Understanding Complement-Dependent Cytotoxicity in the Context of Peptide Research

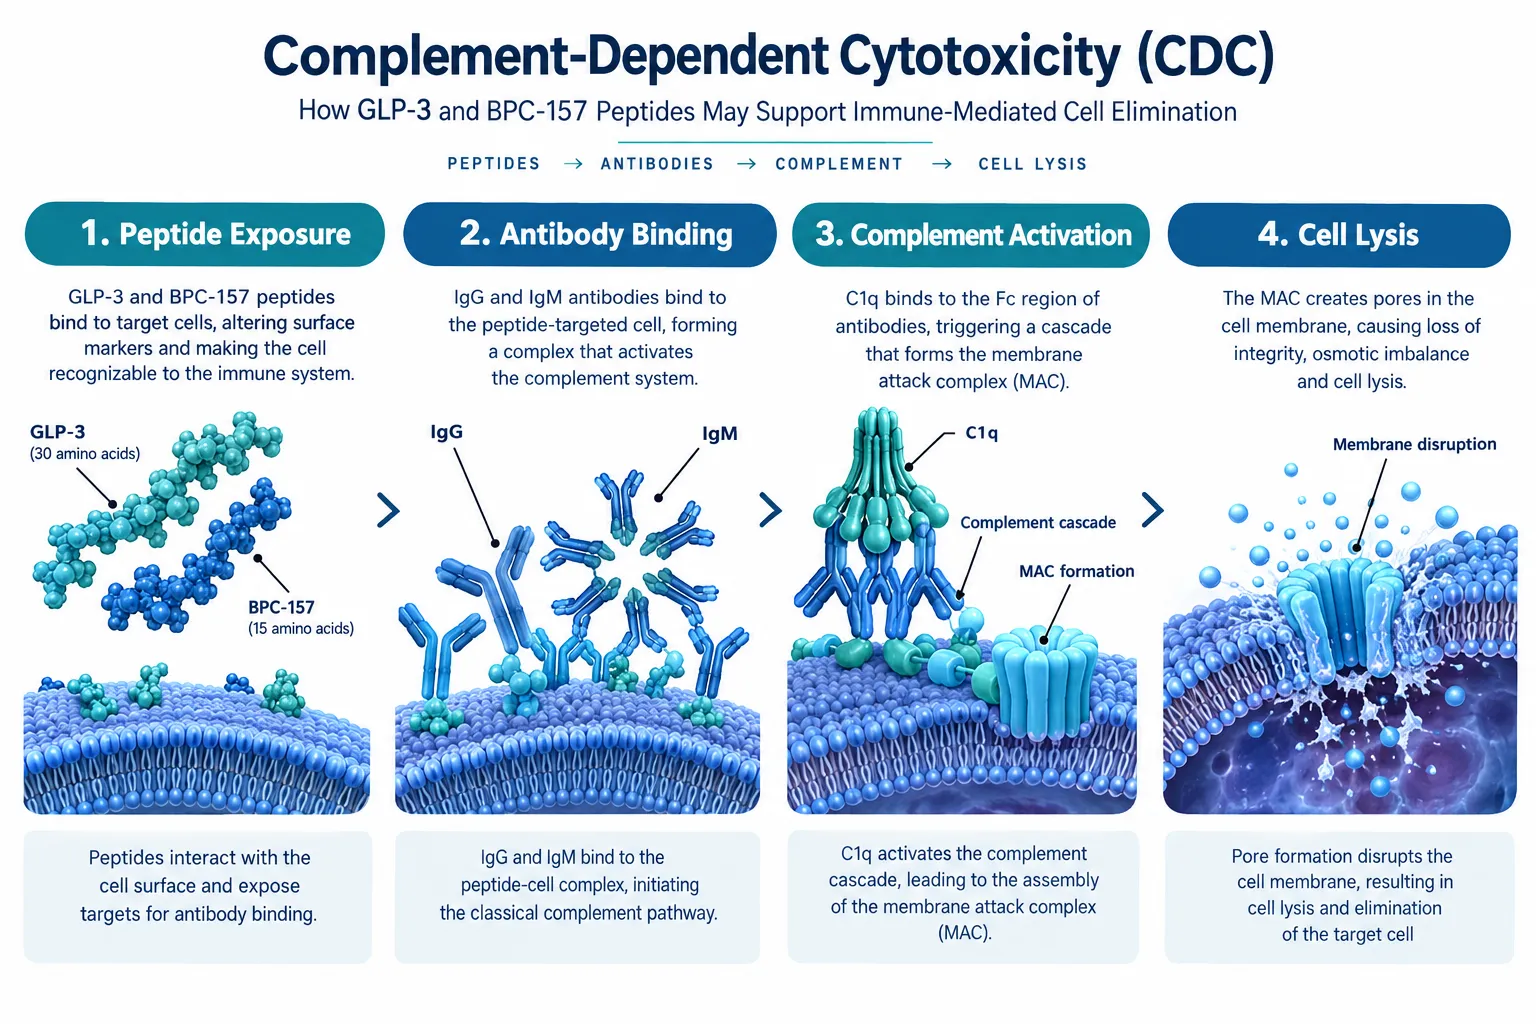
Complement-dependent cytotoxicity describes a process in which an antibody binds to an antigen on a cell surface, recruits the C1q complement protein, and triggers a cascade that ultimately forms the membrane attack complex (MAC). The MAC punches holes in the target cell membrane, causing lysis. In oncology, this mechanism is deliberately exploited by therapeutic monoclonal antibodies. In peptide research, however, it represents an unintended and largely unmonitored risk.

Why does this matter for small synthetic peptides? Historically, low-molecular-weight peptides were considered poorly immunogenic. More recent immunology literature has complicated that assumption. Peptide aggregation, carrier protein conjugation, impurities from synthesis, and route of administration can all elevate immunogenic potential. When a peptide triggers an antibody response, those antibodies can theoretically engage complement, particularly if the peptide localizes to cell surfaces or forms immune complexes.

For researchers working with GLP-3 peptide products or reviewing GLP-3R 30mg peptide formulations, this is directly relevant. GLP-3 receptor agonists are structurally related to incretin-class peptides, a class that has demonstrated measurable immunogenicity in clinical settings. No peer-reviewed CDC-specific data for GLP-3 analogs has entered the public domain as of mid-2026, but the structural and mechanistic parallels with GLP-1 and dual agonist compounds make CDC screening a logical precaution.

"The absence of published complement data is not evidence of complement safety, it is a gap that 2026 research protocols should be designed to close."

Key factors that elevate CDC risk in synthetic peptides include:

  • Aggregation propensity at physiological pH and temperature
  • Synthesis impurities that act as hapten carriers
  • Repeat dosing schedules that allow antibody titers to build
  • Intravenous or subcutaneous routes that maximize systemic exposure

BPC-157 Safety Signals: What the 2025-2026 Data Actually Shows
BPC-157 Safety Signals: What the 2025-2026 Data Actually Shows

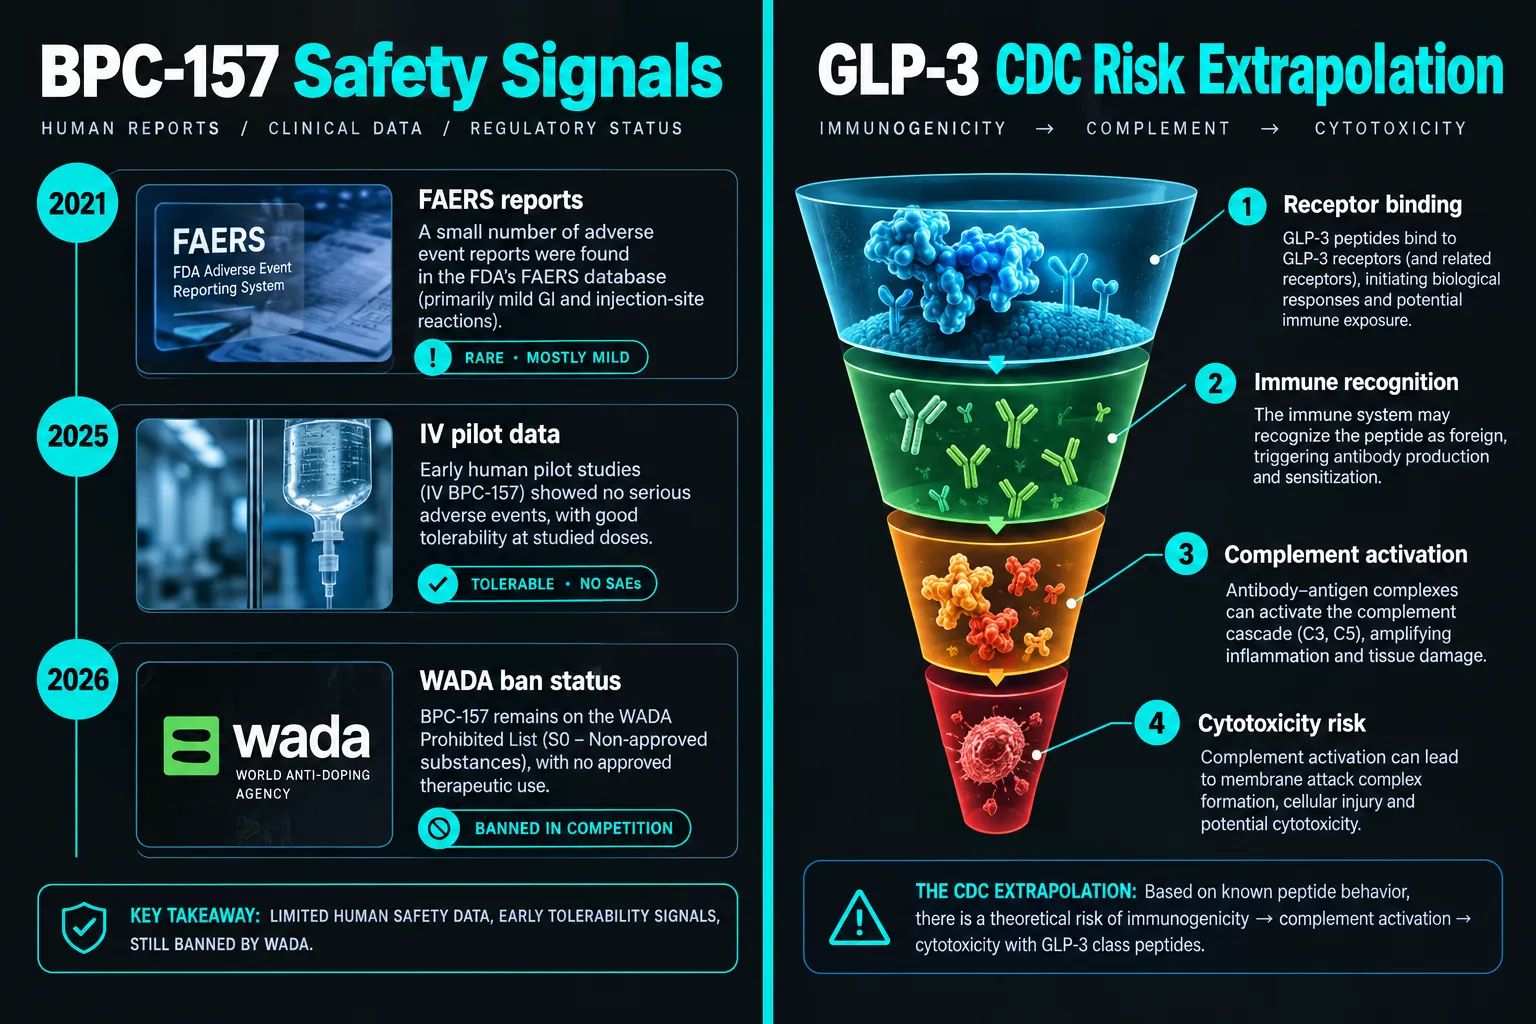
BPC-157 (Body Protection Compound-157) is a synthetic pentadecapeptide derived from a gastric protein sequence. Its preclinical profile is genuinely striking: no organ toxicity has been identified in animal models, and no lethal dose was established even at 2 g/kg. A small intravenous safety pilot published in 2025, involving two subjects receiving 10-20 mg, reported no acute toxicity. These data points have been widely cited in the peptide community as evidence that BPC-157 is "safe and well-tolerated."

That framing deserves scrutiny. Two subjects do not constitute a safety dataset in any statistically meaningful sense. Aggregate human data as of early 2026 consists of small pilots and limited trials with no systematic immune or complement safety endpoints. Critical analysis published in 2026 has specifically challenged the leap from "no acute toxicity in a two-person pilot" to broad safety claims.

Regulatory and sports-medicine context in 2026:

Parameter Status
FDA Approval Not approved
WADA Classification Banned substance
Bulk Substance Category Category 2
FAERS Serious Reports (since 2021) 10 reports
Immunogenicity Assessment Formal regulatory concern

The ten serious FAERS reports are a pharmacovigilance signal, not a confirmed causal link. However, regulatory guidance issued in July 2026 explicitly lists immunogenicity and impurity concerns as primary reasons for BPC-157's Category 2 bulk substance designation. The angiogenic properties of BPC-157, one of its most studied efficacy mechanisms, also raise long-term questions, since uncontrolled angiogenesis could theoretically interact with complement-mediated inflammatory pathways.

Researchers sourcing BPC-157 for preclinical work should prioritize purity documentation. This connects directly to CDC risk: synthesis impurities are a known driver of unwanted immunogenicity. Platforms that provide wound healing peptide research materials with verified purity certificates reduce one of the most controllable CDC risk variables.

For comparison, researchers familiar with mitochondria-targeted peptides like SS-31 can review SS-31 10mg research peptide considerations to understand how purity and formulation standards are applied to a structurally distinct but similarly small synthetic peptide.


A Practical CDC Risk-Assessment Framework for Peptide Labs in 2026
A Practical CDC Risk-Assessment Framework for Peptide Labs in 2026

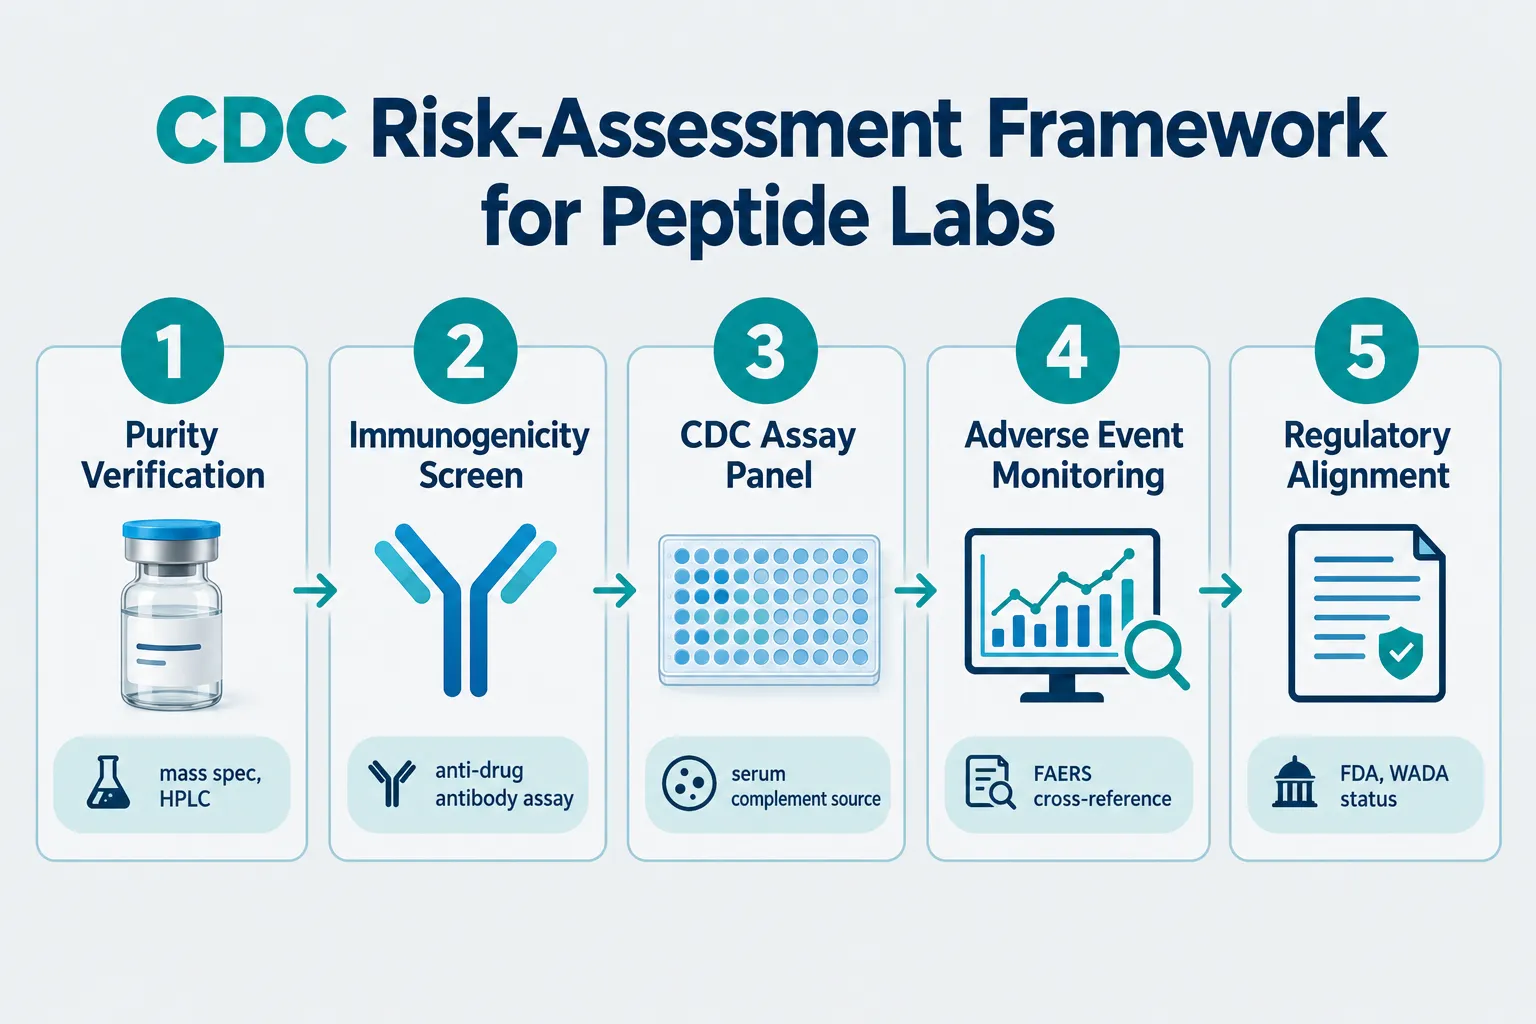
Given the data gaps outlined above, what should a peptide research laboratory actually do in 2026? The following framework synthesizes current immunology best practices with the specific signals emerging from BPC-157 and GLP-3 research.

Step 1: Verify Peptide Purity Before Any Biological Assay
Mass spectrometry and HPLC purity confirmation should be non-negotiable. Impurities above 1% are a meaningful immunogenicity risk factor. Researchers exploring GLP-3R 10mg peptide formulations should request certificates of analysis that specify both purity percentage and identified impurity profiles.

Step 2: Conduct Anti-Drug Antibody (ADA) Screening
ADA assays detect whether a peptide is generating an antibody response in the test system. Positive ADA results should trigger CDC-specific follow-up assays using complement-active human serum.

Step 3: Run a Formal CDC Assay Panel
Standard CDC assays use target cells incubated with the peptide-antibody complex plus complement source. Cell viability readouts (e.g., calcein-AM or LDH release) quantify lytic activity. This step is standard in biologic drug development but is largely absent from current peptide research protocols.

Step 4: Cross-Reference Adverse Event Databases
FAERS cross-referencing should be part of any ongoing safety monitoring plan. The ten BPC-157 serious reports represent a baseline; researchers should track whether this number changes as 2026 progresses.

Step 5: Align with Current Regulatory Guidance
Researchers should document FDA and WADA status for every compound in active study. For peptides with known regulatory concerns, institutional review processes should include explicit immunogenicity risk sections.

Researchers interested in related peptide safety comparisons may find value in reviewing Tesamorelin peptide benefits as a case study of an FDA-approved peptide with a documented safety and immunogenicity profile, a useful contrast to the uncharted territory of BPC-157 and GLP-3.


Conclusion

Complement-dependent cytotoxicity in GLP-3 and BPC-157 studies represents one of the most consequential underexamined safety endpoints in peptide research as of 2026. The data landscape is characterized by preclinical promise, minimal human evidence, and a growing pharmacovigilance signal that demands structured attention. The practical path forward is clear: implement purity verification, add ADA and CDC assays to standard safety panels, monitor FAERS actively, and treat regulatory designations as meaningful risk signals rather than bureaucratic obstacles.

Actionable next steps for peptide researchers:

  • Audit current protocols for the presence or absence of CDC-specific endpoints
  • Require HPLC and mass spec purity data for every peptide batch used in biological assays
  • Establish a baseline ADA screening step before any repeat-dose in vitro or in vivo work
  • Document WADA and FDA status for all compounds in active research files
  • Review emerging 2026-2027 literature on incretin-class peptide immunogenicity as a predictive framework for GLP-3 analog safety

The field is moving quickly. Labs that build CDC risk assessment into their standard operating procedures now will be better positioned as regulatory scrutiny of research peptides intensifies through 2027.

https://www.puretestedpeptides.com/wp-content/uploads/2026/09/complement-dependent-cytotoxicity-in-glp-3-and-bpc-157-studies-what-new-safety-d.webp 1254 1254 https://www.puretestedpeptides.com/wp-content/uploads/2026/01/buy-peptides-online.jpg 2026-09-28 13:10:552026-09-28 13:10:55Complement-Dependent Cytotoxicity in GLP-3 and BPC-157 Studies: What New Safety Data Signals Mean for Peptide Researchers in 2026
Semax Nasal Spray Research Products: How to Compare Concentration, Excipient Disclosure, and Analytical Documentation

Semax Nasal Spray Research Products: How to Compare Concentration, Excipient Disclosure, and Analytical Documentation

September 28, 2026/0 Comments/in Uncategorized/by

Purity figures alone tell only part of the story. A nasal spray labeled "99% pure Semax" could contain anywhere from 1 mg/mL to 10 mg/mL of active peptide, a tenfold difference that fundamentally changes every dose calculation. Researchers evaluating Semax nasal spray research products: how to compare concentration, excipient disclosure, and analytical documentation need a structured framework, not just a headline number.

Key Takeaways

  • Semax nasal spray concentration is expressed in mg/mL; a 0.1% solution equals 1 mg/mL and a 1% solution equals 10 mg/mL, always convert before comparing products.
  • COA-measured net peptide content often differs from the label claim; reviewing actual tested values is essential for accurate dosing calculations.
  • Excipient disclosure, including buffer type, pH, and preservative identity, varies widely between suppliers and directly affects formulation comparability.
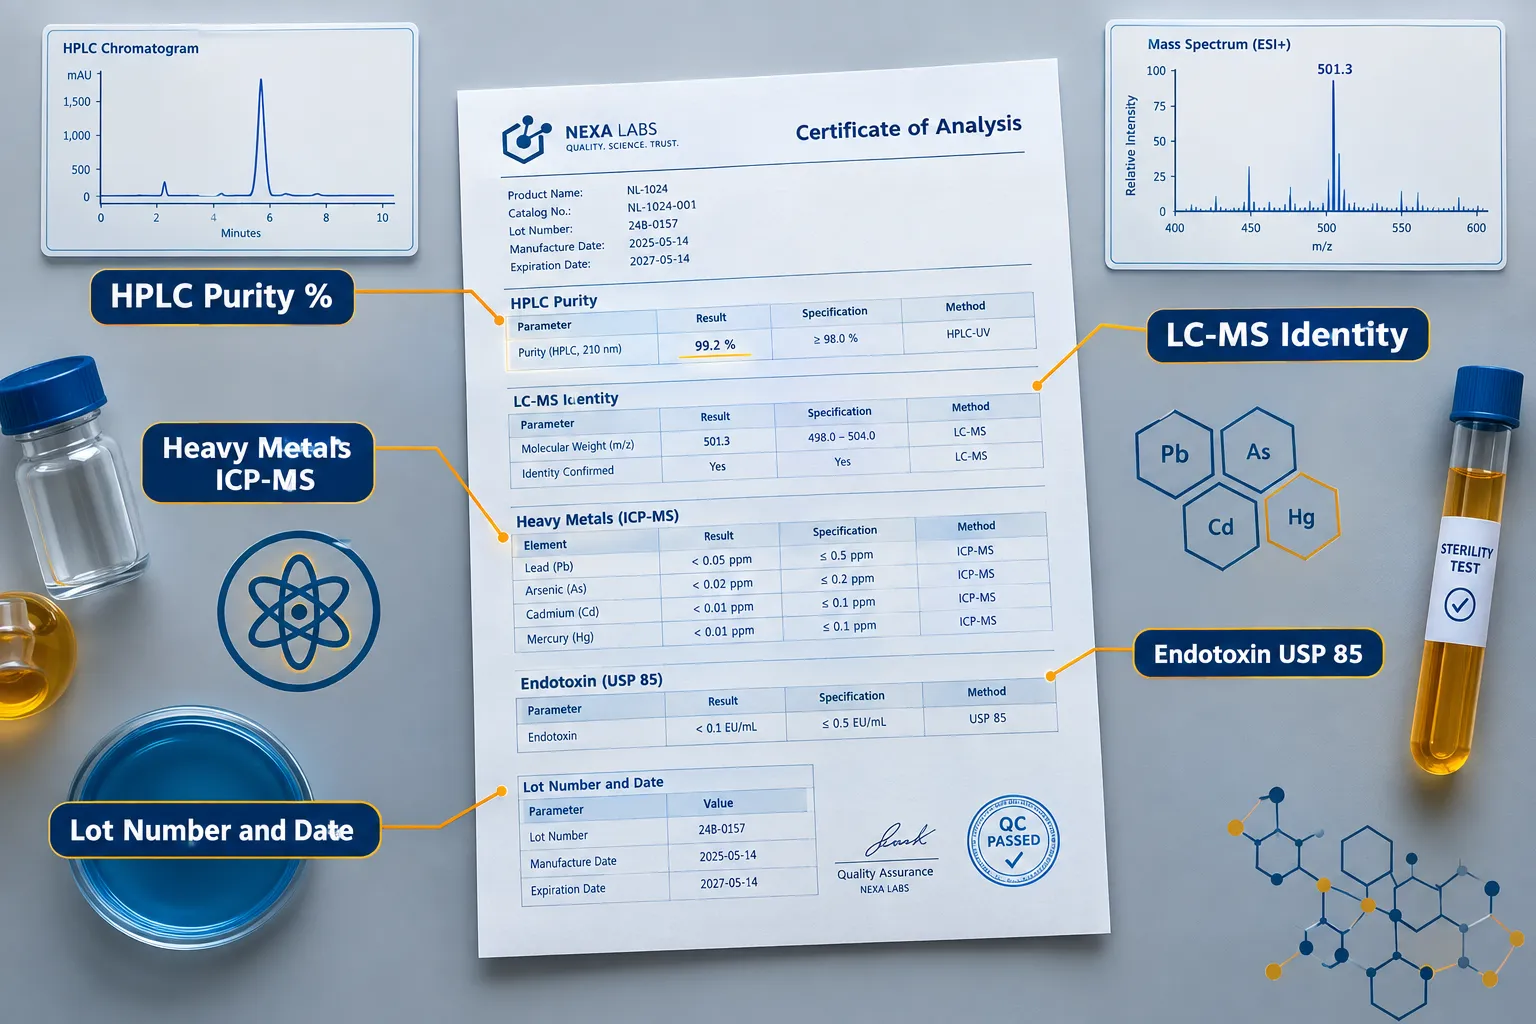
  • High-quality analytical documentation combines HPLC purity, MS identity confirmation, heavy metal screening, sterility testing, and endotoxin limits, not just a single purity percentage.
  • COA accessibility models range from instant download to on-request portals; downloadable batch-specific documents with ISO-accredited lab credentials offer the strongest verification path.

Comparing Concentration Across Semax Nasal Spray Research Products

Comparing Concentration Across Semax Nasal Spray Research Products

The single most consequential variable when comparing Semax nasal spray research products is concentration, yet it is frequently presented inconsistently across suppliers. Some vendors list total milligrams per bottle, others use percentage notation, and others specify micrograms per actuation. All three refer to the same underlying quantity, but only when converted to mg/mL do they become directly comparable.

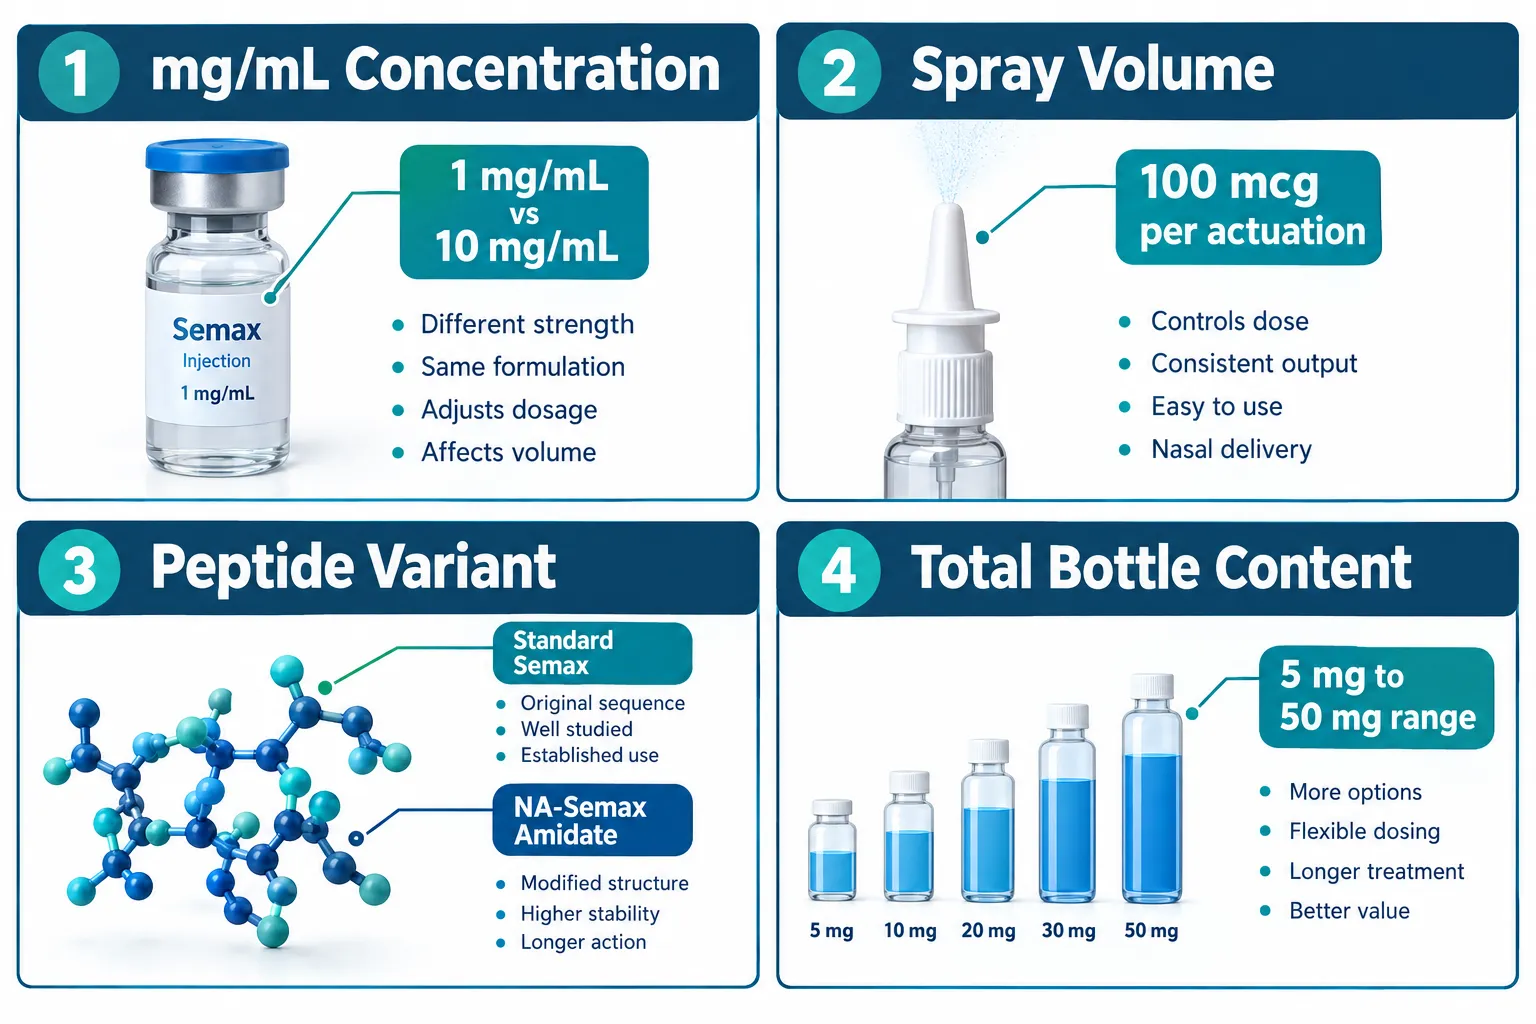
A 0.1% Semax nasal spray contains 1 mg/mL of active peptide. A 1% spray contains 10 mg/mL. Russian clinical studies that established the foundational Semax research record typically used 0.1% (1 mg/mL) solutions, delivering 200-400 mcg intranasally per day. A 5 mL bottle at that concentration holds 5 mg total and delivers roughly 50-100 mcg per spray, yielding approximately 25-50 actuations at 100 mcg each.

Some commercial research products now sit at 1 mg/mL with 100 mcg per metered spray across a 10 mL bottle, a total of 10 mg per container. Others label 30 mg in a 10 mL bottle, placing concentration at 3 mg/mL. The table below illustrates how to normalize these figures:

Label Claim Volume Calculated mg/mL Mcg per 100 µL Spray
5 mg bottle 5 mL 1.0 mg/mL 100 mcg
10 mg bottle 10 mL 1.0 mg/mL 100 mcg
30 mg bottle 10 mL 3.0 mg/mL 300 mcg
50 mg bottle 10 mL 5.0 mg/mL 500 mcg

Always verify whether the listed volume is the fill volume or the nominal bottle size. COA-measured net content can exceed the label claim, one batch labeled at 30 mg was independently tested and found to contain 33 mg, which shifts every dose calculation upward. Relying on the label alone introduces systematic error.

Beyond standard Semax, researchers should confirm the peptide variant. N-acetyl Semax amide (NA-Semax Amidate) is a structurally distinct analogue with different pharmacokinetic properties. It may be presented in an identical nasal spray format at 1 mg/mL, but it is not interchangeable with the classical heptapeptide for research comparison purposes. The COA identity section, not just the product name, is the authoritative source for confirming which compound is actually present.


Excipient Disclosure: What the Carrier Composition Reveals

Excipient Disclosure: What the Carrier Composition Reveals

Excipient transparency has emerged as one of the clearest differentiators among Semax nasal spray research products. The carrier solution, the liquid in which the peptide is dissolved, directly influences stability, mucosal tolerability, and the comparability of formulations across studies.

A fully disclosed excipient profile includes:

  • Buffer identity (e.g., normal saline, phosphate-buffered saline)
  • pH value (typically 5.5-7.0 for nasal formulations)
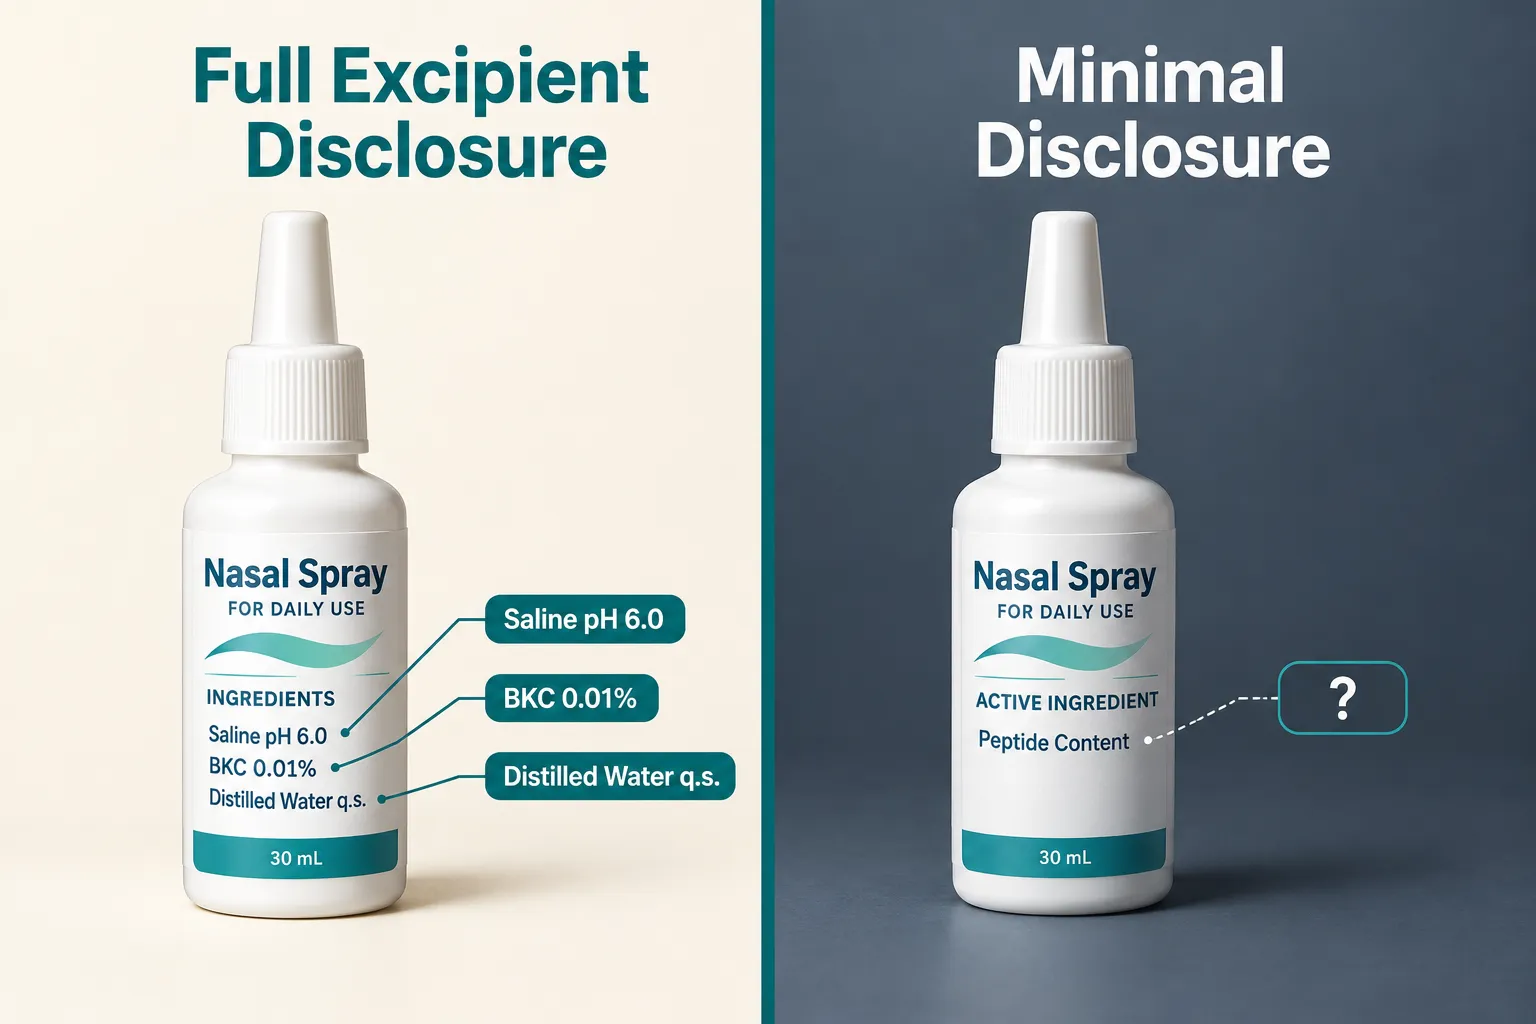
  • Preservative (e.g., benzalkonium chloride at 0.01%)
  • Solvent grade (e.g., lab-grade distilled water, sterile water for injection)

Some suppliers publish this information directly on the product page, specifying normal saline at pH 6.0 with benzalkonium chloride (BKC) at 0.01% as the antimicrobial preservative. This level of detail allows a researcher to assess whether the formulation is isotonic, whether the pH is within a range that preserves peptide integrity, and whether the preservative could interact with any assay being conducted.

Other suppliers focus their public-facing documentation entirely on peptide identity and purity, leaving excipient composition unstated. This is not necessarily a quality failure, the peptide itself may be excellent, but it limits formulation comparability and makes it harder to replicate or cross-reference research conditions.

"The carrier is not inert. pH, ionic strength, and preservative concentration all affect peptide stability and nasal absorption kinetics. Excipient disclosure is a research variable, not just a regulatory formality."

Container closure is a related but often overlooked factor. Metered-dose nasal pumps with defined actuation volumes (typically 100 µL) enable reproducible delivery. Simple dropper-top bottles do not. When comparing products, confirm whether the delivery device is a calibrated pump and what the stated actuation volume is.


Analytical Documentation Standards for Semax Spray Research Products

Analytical Documentation Standards for Semax Spray Research Products

Evaluating Semax nasal spray research products: how to compare concentration, excipient disclosure, and analytical documentation ultimately depends on the depth and accessibility of the certificate of analysis. A single purity percentage is a starting point, not a complete picture.

Purity figures across current research suppliers range from approximately 98.5% to a claimed 100%. However, the more meaningful question is: what method produced that number, and what does the COA document beyond it?

A research-grade COA should include:

  1. HPLC purity, with method details (e.g., RP-HPLC at 214 nm), retention time, and a defined specification threshold (e.g., ≥99.0% peak area)
  2. Mass spectrometry identity, LC-MS or MALDI-MS confirming the expected molecular mass (Semax: approximately 813.9 Da for the full heptapeptide sequence)
  3. Net peptide content, HPLC-quantified actual mass, not just label claim
  4. Heavy metals, ICP-MS screening with a "not detected" or numerical result
  5. Sterility or microbial testing, PCR-based or culture-based, with explicit pass criteria
  6. Endotoxin, tested under USP guidelines with a defined EU/mL limit
  7. Lot number and analysis date, batch-specific, not a generic template
  8. Laboratory accreditation, ISO 17025 certification is the current benchmark

Some suppliers now offer panels that include all eight elements above, including fentanyl screens as an additional safety marker. Others provide identity and purity alone. The gap between these two documentation levels is significant for any serious research context.

COA accessibility also varies. Some vendors maintain downloadable COA libraries organized by batch ID and analysis date, enabling pre-purchase verification. Others issue batch-specific documents only through a support portal on request. Both models can yield legitimate documentation, but downloadable access reduces friction and allows faster cross-batch comparison.

When reviewing identity data, look for explicit mass values rather than generic confirmations. Semax's molecular formula is C₃₇H₅₁N₉O₁₀S (CAS 80714-61-0), with a monoisotopic mass of approximately 813.35 Da. A COA that reports a measured mass matching this value, and notes the absence of Met-sulfoxide oxidation products or truncated sequence variants, demonstrates a higher level of analytical rigor than one that simply states "identity confirmed."

Researchers exploring related peptide research categories, such as SS-31 mitochondrial research or ipamorelin spray products, will recognize that the same COA evaluation framework applies across nasal and injectable peptide formats. The same standards used to assess IPA Sermorelin stack research documentation, HPLC purity, MS identity, and lot traceability, translate directly to Semax nasal spray evaluation. Similarly, researchers reviewing SS-31 kidney health research products or aging support compounds will find that multi-method COA panels are becoming the expected standard across the research peptide sector.


Conclusion

Comparing Semax nasal spray research products: how to compare concentration, excipient disclosure, and analytical documentation requires moving beyond headline purity figures to a structured, multi-variable assessment.

Actionable next steps for researchers:

  • Convert all concentration data to mg/mL before comparing products; do not rely on percentage notation or total bottle content alone.
  • Request or download the batch-specific COA before purchase and confirm it includes HPLC purity with method details, MS identity with a numerical mass value, and a dated lot number.
  • Verify excipient composition, buffer type, pH, and preservative identity, to ensure formulation comparability across research conditions.
  • Confirm the peptide variant (standard Semax vs. NA-Semax Amidate or other analogues) using the identity section of the COA, not the product name alone.
  • Prioritize suppliers using ISO 17025-accredited laboratories and offering multi-parameter panels that include heavy metal, sterility, and endotoxin testing.

As the research peptide market in 2026 continues to mature, suppliers offering transparent, multi-method documentation and full excipient disclosure are setting a higher benchmark. Applying this framework consistently protects research integrity and enables meaningful cross-product comparison.

https://www.puretestedpeptides.com/wp-content/uploads/2026/09/semax-nasal-spray-research-products-how-to-compare-concentration-excipient-discl.webp 1024 1536 https://www.puretestedpeptides.com/wp-content/uploads/2026/01/buy-peptides-online.jpg 2026-09-28 13:04:162026-09-28 13:04:16Semax Nasal Spray Research Products: How to Compare Concentration, Excipient Disclosure, and Analytical Documentation
Glow Blend Peptide vs GHK-Cu: What Skin and Tissue Research Models Actually Measure

Glow Blend Peptide vs GHK-Cu: What Skin and Tissue Research Models Actually Measure

September 28, 2026/0 Comments/in Uncategorized/by

Fewer than one in ten multi-peptide research blends entering the market in 2026 have published combination data to support their formulation rationale, and Glow Blend is no exception. That gap between product development and peer-reviewed evidence is precisely what makes understanding the comparison of Glow Blend Peptide vs GHK-Cu: What Skin and Tissue Research Models Actually Measure so important for researchers, formulators, and science-focused readers who want to separate measurable endpoints from marketing language.

Key Takeaways

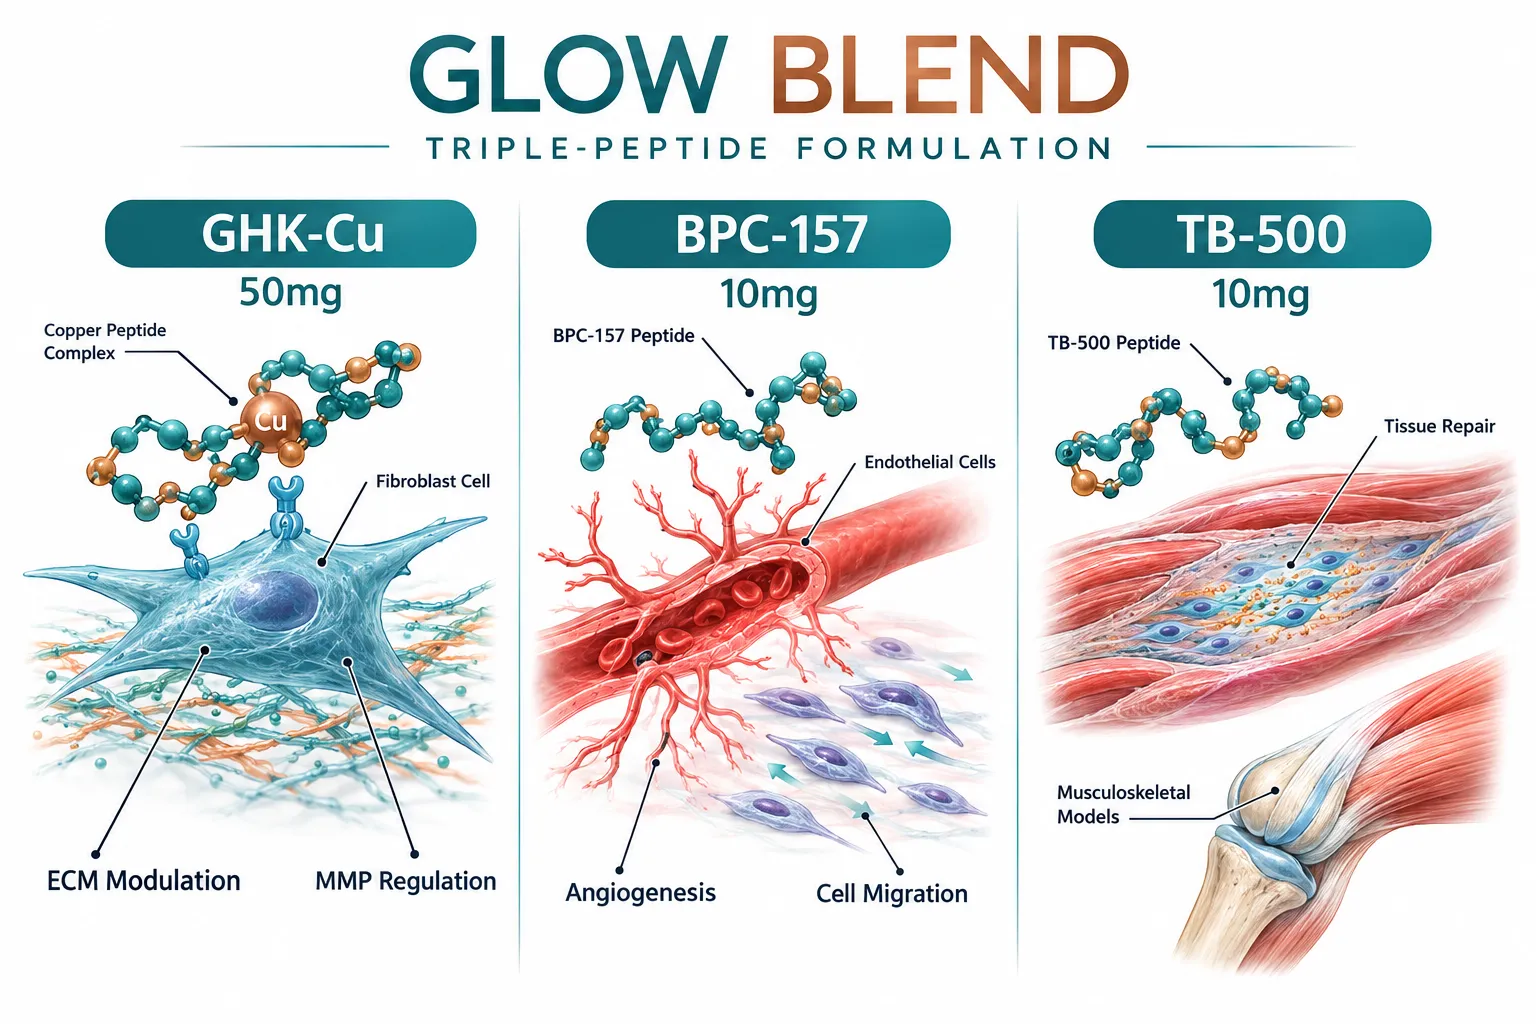
  • Glow Blend is a 70 mg lyophilized triple-peptide research formulation (50 mg GHK-Cu, 10 mg BPC-157, 10 mg TB-500) positioned strictly for in vitro and analytical research use, not clinical or cosmetic application.
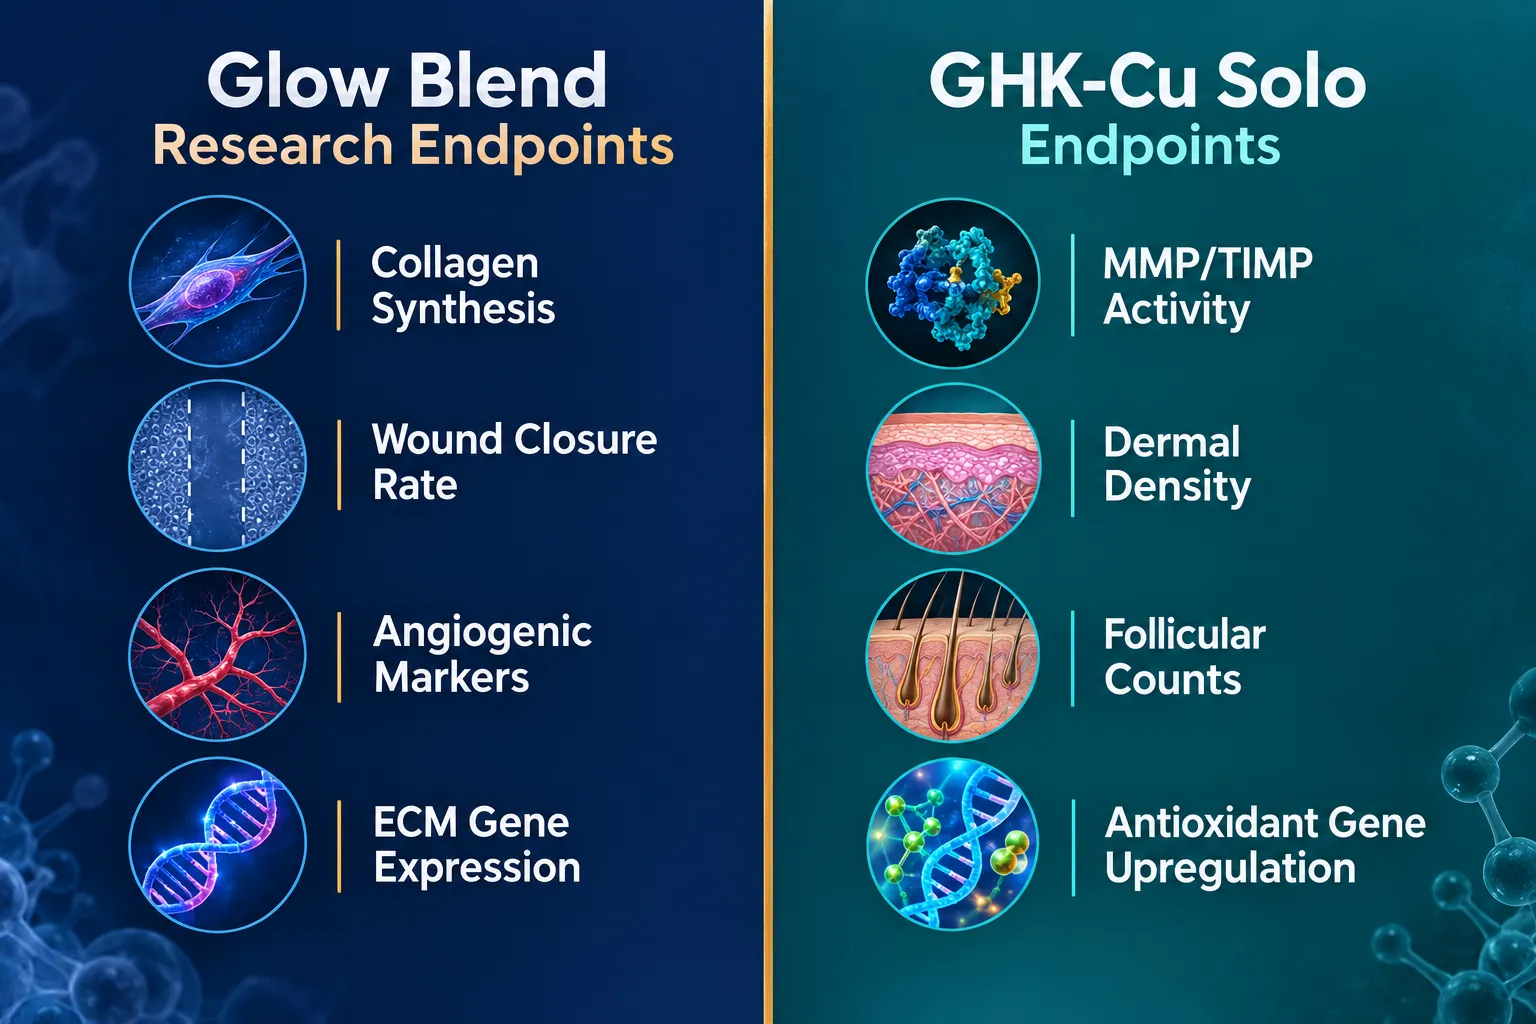
  • GHK-Cu has substantial published mechanistic evidence in dermal fibroblast and wound models, with clearly defined endpoints including collagen synthesis, MMP/TIMP activity, and gene expression profiling.
  • Glow Blend's claimed endpoints, collagen signaling, angiogenesis, tissue repair, are extrapolated from individual peptide literature; no published combination studies currently exist.
  • Research models that matter most include scratch assays, fibroblast proliferation assays, ECM gene panels, and histological wound-closure measurements.
  • Purity verification (HPLC, mass spectrometry, Certificate of Analysis) is necessary for research reproducibility but does not itself demonstrate biological efficacy.

What Glow Blend Actually Is in a Research Context

Multiple suppliers define Glow Blend as a 70 mg lyophilized triple-peptide formulation, typically 50 mg GHK-Cu, 10 mg BPC-157, and 10 mg TB-500 per vial. A variant featuring higher GHK-Cu content alongside TB-500 fragments and 10 mg BPC-157 has also appeared in late 2026 listings, reflecting active product development in this category. Across all vendors, the formulation is labeled "for research use only" and explicitly not intended for human or veterinary administration, nor classified as a drug, food, cosmetic, or dietary supplement.

What Glow Blend Actually Is in a Research Context

This framing matters. It positions Glow Blend within the research-chemical market as a reference material for in vitro and analytical work. The stated research applications converge on:

  • Collagen and extracellular matrix (ECM) signaling
  • Tissue regeneration and wound-healing pathways
  • Cell migration and angiogenesis models
  • Musculoskeletal repair systems

These are not subjective "anti-aging" endpoints. They are quantifiable outputs from controlled laboratory assays, a distinction that becomes central when comparing this blend to GHK-Cu studied in isolation. Researchers interested in related regenerative peptide research may also find value in reviewing GHK-Cu peptides for sale from verified suppliers to ensure analytical-grade material for their models.


Glow Blend Peptide vs GHK-Cu: What Skin and Tissue Research Models Actually Measure

Understanding the comparison requires mapping each peptide component to its known assay readouts.

GHK-Cu: Established Endpoints in Dermal Models

GHK-Cu (copper tripeptide-1) has the most robust individual evidence base of the three components. In dermal fibroblast and tissue explant models, it has been shown to:

  • Stimulate collagen type I and III synthesis, measured via biochemical collagen content assays and immunohistochemistry
  • Modulate metalloproteinase (MMP) and TIMP activity, quantified through enzyme-linked assays of MMP-1, MMP-2, and their inhibitors in conditioned media
  • Regulate glycosaminoglycan (GAG) synthesis, assessed by colorimetric or fluorometric assays of ECM components
  • Upregulate tissue-remodeling genes, captured through microarray or RNA-seq platforms targeting TGF-beta, integrin, and collagen-related gene families
  • Downregulate pro-inflammatory and fibrotic gene sets, including cytokine panels (IL-1, TNF-alpha) and fibrosis markers

In wound-healing models, GHK-Cu endpoints include wound-closure speed (scratch assay), re-epithelialization rate, granulation tissue formation, dermal density, and follicular counts in hair-follicle models. These are structural and functional tissue metrics, not cosmetic impressions. Researchers exploring complementary regenerative peptides can also consult the IPA Sermorelin stack research resource for context on how stacked peptide models are evaluated.

BPC-157 and TB-500: Complementary Assay Domains

Within the Glow Blend formulation, BPC-157 and TB-500 are described as components studied in angiogenesis, cell-migration, and musculoskeletal repair models. Their relevant assay readouts include:

Peptide Primary Model Type Key Measured Endpoints
BPC-157 Angiogenesis / GI tissue Endothelial sprouting, microvessel formation, vessel density
TB-500 Cell migration / soft tissue Actin-mediated migration rate, tendon/ligament cell motility, functional recovery scores

These endpoints are framed as complementary to GHK-Cu's ECM-focused effects. However, no publicly indexed peer-reviewed papers currently report combination data for Glow Blend itself. All current research claims draw on known properties of each peptide tested individually in preclinical models.

BPC-157 and TB-500: Complementary Assay Domains


Analytical Verification vs Biological Efficacy: A Critical Distinction

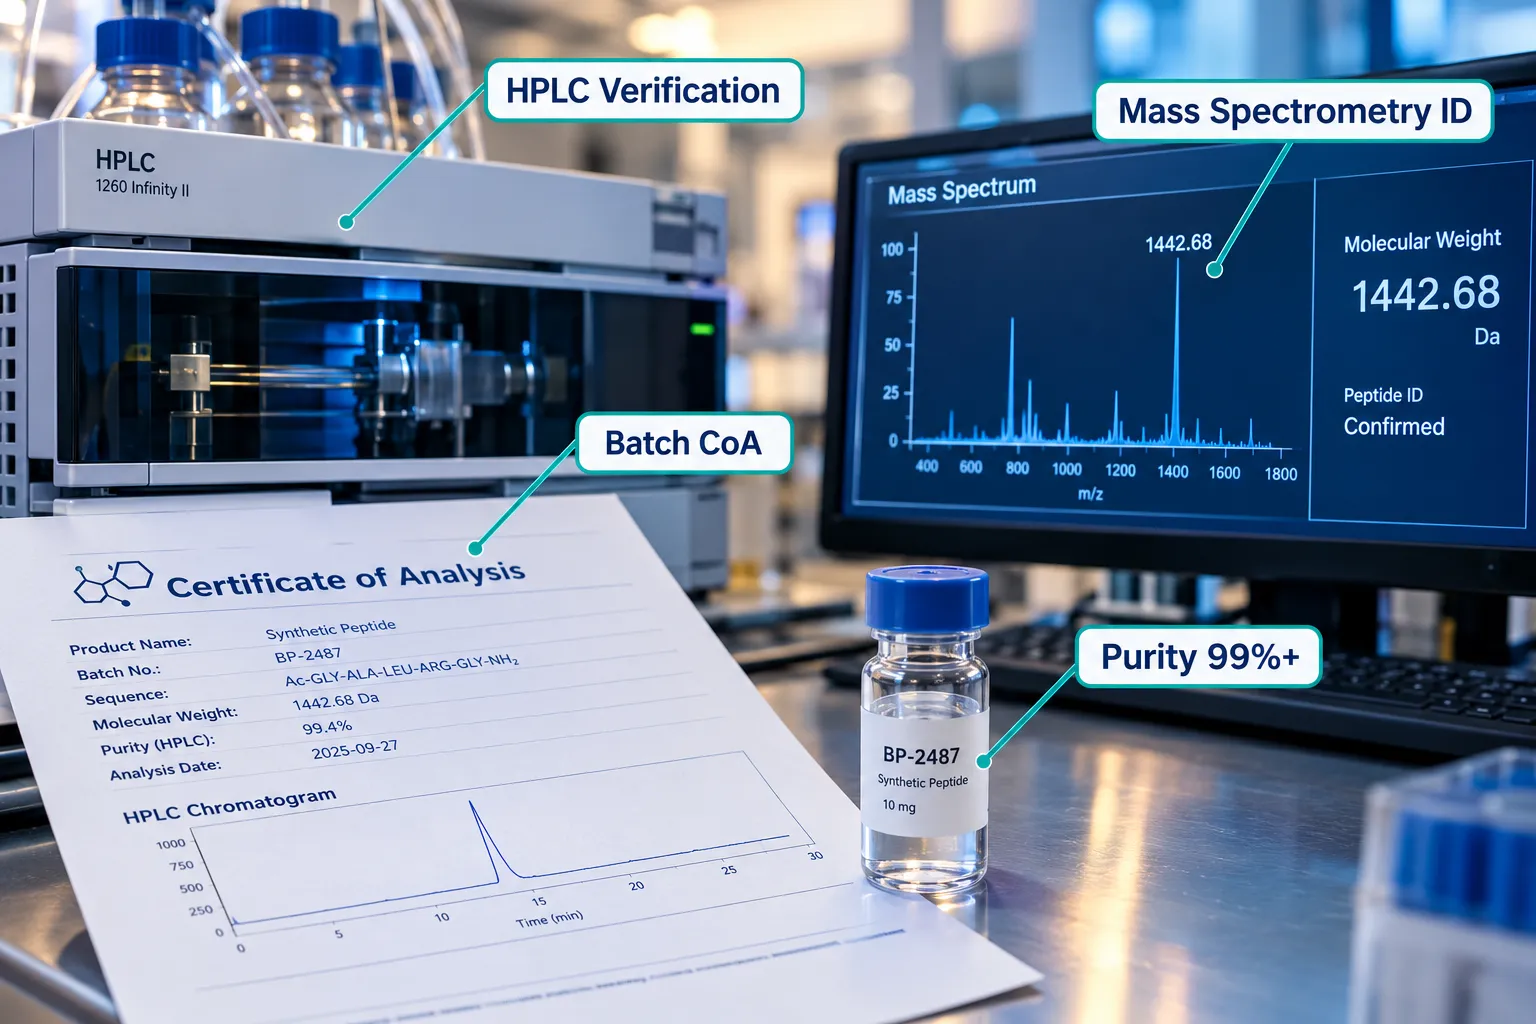
Several suppliers emphasize rigorous analytical characterization of Glow Blend: greater than or equal to 99% purity, HPLC and mass-spectrometry verification, defined molecular weights, amino acid counts, and batch-specific Certificates of Analysis. These are measured using standard chromatographic and spectrometric methods.

Key distinction: QC metrics confirm peptide identity and purity. They do not demonstrate biological efficacy. They are prerequisites for research reproducibility, not substitutes for functional assay data.

This distinction separates how a researcher should evaluate Glow Blend from how a consumer might evaluate a cosmetic product. For in vitro skin and tissue work, purity verification ensures that observed effects in fibroblast cultures or wound models are attributable to the peptide and not to contaminants. Researchers sourcing related compounds may also find it useful to review GHK-Cu peptide for sale listings that include CoA documentation.

By contrast, GHK-Cu has already transitioned from purely experimental peptide to a recognized active in commercial cosmetic formulations, a trajectory that reflects its accumulated mechanistic evidence base. Industry-facing sources describe similar "Glow Protocol" stacks as "synergistic multi-pathway regeneration," yet acknowledge these formulations remain experimental and rely on extrapolation from individual peptide literature.

For researchers interested in other peptides with established tissue-level evidence, the SS-31 mitochondrial research literature offers a useful parallel example of how mechanistic endpoint data builds over time in preclinical models.

Analytical Verification vs Biological Efficacy: A Critical Distinction

The clustering of new Glow Blend listings in September 2026 suggests rising interest in multi-peptide regeneration models. A reasonable forward-looking expectation is that upcoming preclinical work will focus on additive or synergistic effects in standardized systems, fibroblast cultures, reconstructed human skin, and animal wound-healing models, using metrics such as collagen content, wound-closure rate, capillary density, and inflammatory markers. This remains speculative and is not yet supported by published combination studies. Researchers interested in other regenerative research tools may also explore Ipamorelin peptide for sale as a related area of growth-factor pathway investigation.


Conclusion

The comparison of Glow Blend Peptide vs GHK-Cu: What Skin and Tissue Research Models Actually Measure ultimately comes down to evidence depth. GHK-Cu has a well-mapped endpoint profile, collagen synthesis, MMP modulation, gene expression, wound closure, validated across multiple published dermal and fibroblast studies. Glow Blend offers a rationally designed multi-pathway formulation, but its combination effects remain uncharacterized in published research as of 2026.

Actionable next steps for researchers:

  1. Use GHK-Cu's established endpoint library (collagen assays, MMP panels, scratch assays) as the benchmark when designing Glow Blend experiments.
  2. Require batch-specific CoA documentation with HPLC and mass-spec data before using any multi-peptide blend in tissue models.
  3. Design experiments that isolate individual component effects before testing the full blend, enabling additive vs. synergistic effect analysis.
  4. Track the emerging preclinical literature on BPC-157 and TB-500 combination models to identify validated assay frameworks as they become available.
  5. Distinguish cosmetic-use claims from research-model endpoints when evaluating supplier descriptions of any peptide formulation.
https://www.puretestedpeptides.com/wp-content/uploads/2026/09/glow-blend-peptide-vs-ghk-cu-what-skin-and-tissue-research-models-actually-measu.webp 1024 1536 https://www.puretestedpeptides.com/wp-content/uploads/2026/01/buy-peptides-online.jpg 2026-09-28 13:04:102026-09-28 13:04:10Glow Blend Peptide vs GHK-Cu: What Skin and Tissue Research Models Actually Measure
Enclomiphene Research Materials: Enclomiphene Base vs Citrate for Identity, Solubility, and COA Review

Enclomiphene Research Materials: Enclomiphene Base vs Citrate for Identity, Solubility, and COA Review

September 28, 2026/0 Comments/in Uncategorized/by

Fewer than a handful of small-molecule research compounds generate as much procurement confusion as enclomiphene, largely because researchers routinely receive materials labeled under two chemically distinct forms without clear guidance on how that distinction affects their assay design. Selecting the correct form from the outset, and then verifying it through proper documentation, is not a minor administrative step. For anyone sourcing enclomiphene research materials: enclomiphene base vs citrate for identity, solubility, and COA review, understanding the chemical and analytical differences between these two forms is the foundation of reproducible, well-documented laboratory work.

Key Takeaways

  • Enclomiphene base and enclomiphene citrate are chemically distinct forms with different molecular weights, solubility profiles, and documentation requirements.
  • Enclomiphene citrate offers meaningfully higher aqueous solubility, making it preferable for buffer-based in vitro assays.
  • Enclomiphene base is better suited to organic solvent systems such as DMSO or ethanol.
  • A high-quality Certificate of Analysis must explicitly state the salt form, CAS number, purity method, and solubility data, not just a percentage purity figure.
  • As of 2026, enclomiphene holds no FDA-approved indication in any form; all procurement and use remains within a research-only context.

Chemical Identity: What Separates Enclomiphene Base from Its Citrate Salt

Chemical Identity: What Separates Enclomiphene Base from Its Citrate Salt

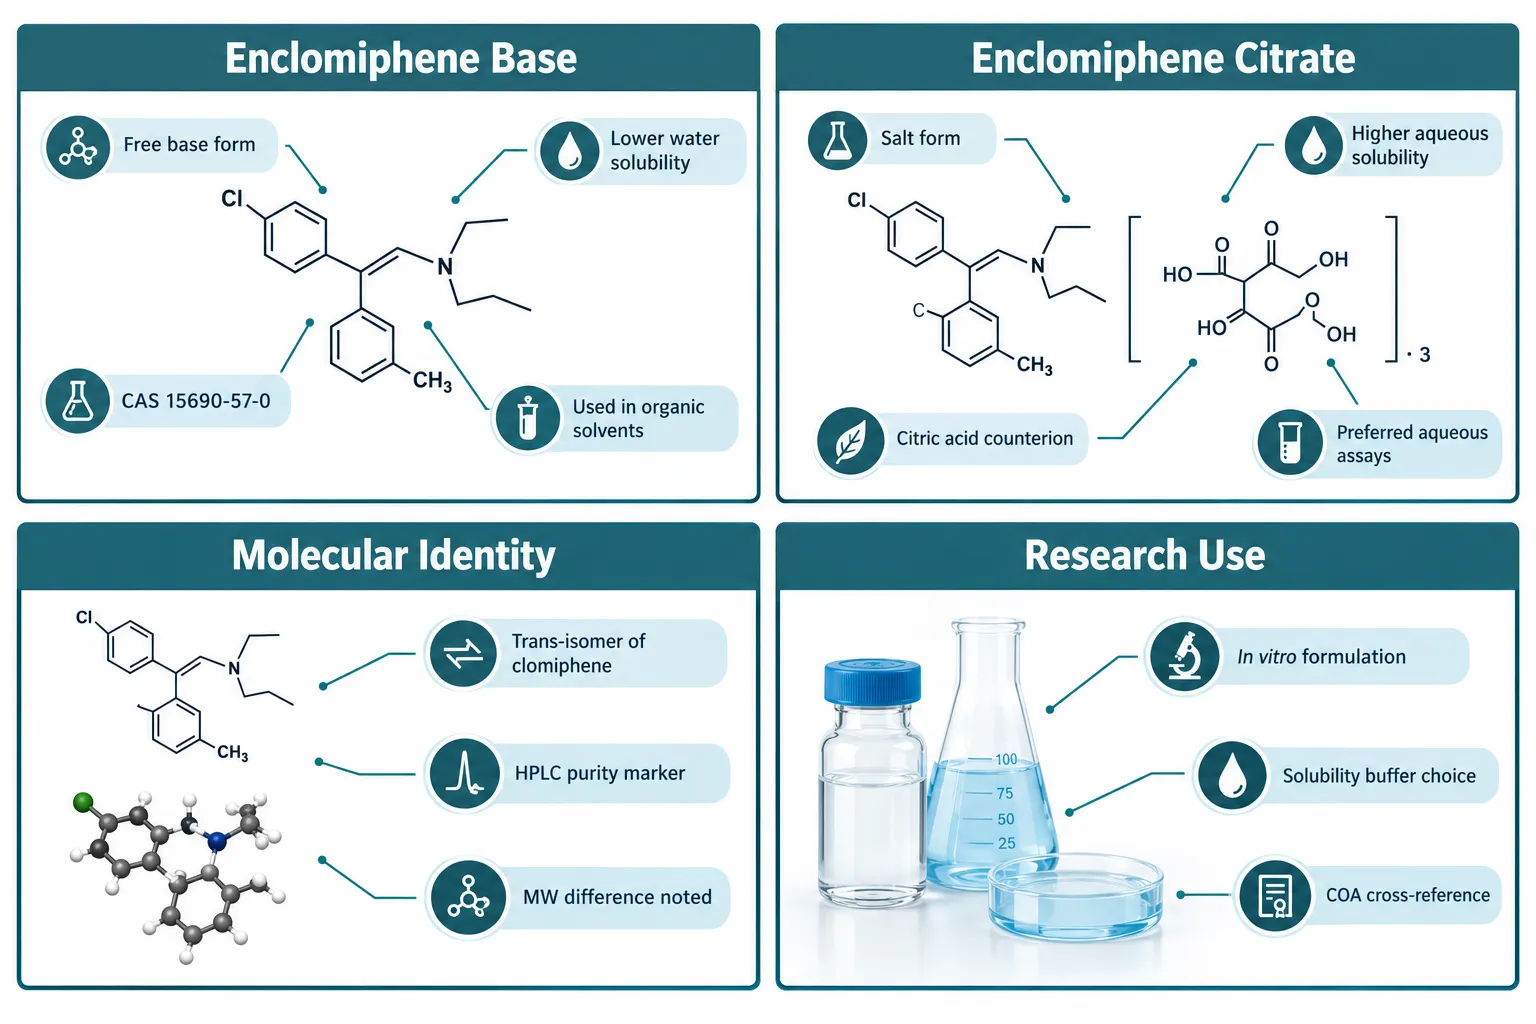
Enclomiphene is the trans-isomer of clomiphene, a selective estrogen receptor modulator (serm) that has been studied for its effects on the hypothalamic-pituitary-gonadal axis. The base form (free base) carries CAS number 15690-57-0 and represents the compound in its uncharged, non-salt state. The citrate salt is formed when the base is combined with citric acid, producing a counterion pair that significantly alters the compound's physical and chemical behavior.

This distinction matters immediately at the procurement stage. A supplier listing "enclomiphene" without specifying salt form is providing incomplete information. Researchers should confirm:

  • Exact CAS number (base vs. citrate have different registry entries)
  • Molecular weight (the citrate salt is heavier due to the citric acid moiety)
  • IUPAC name or systematic name confirming the trans-configuration
  • Salt ratio (typically 1:1 for citrate salts, but this should be stated explicitly)

Clomiphene citrate, the racemic mixture containing both enclomiphene and zuclomiphene, has a long clinical history. Enclomiphene as an isolated isomer is a more refined research material, and its documentation standards should reflect that precision. Researchers comparing enclomiphene to other research-grade serms can find relevant context in the serm 10mg product documentation as a reference point for how salt-form labeling should appear on supplier listings.


Solubility Profiles: Matching the Form to the Assay

Solubility Profiles: Matching the Form to the Assay

Solubility is where the base-versus-citrate distinction has the most direct impact on experimental planning. The two forms behave very differently across common laboratory solvents.

Enclomiphene Base, Solubility Summary

Solvent Solubility
DMSO Moderate to good (~10-25 mg/mL typical)
Ethanol Moderate
Water Very low (practically insoluble)
Aqueous buffers Not suitable without co-solvent

Enclomiphene Citrate, Solubility Summary

Solvent Solubility
Water Measurably higher than base form
Aqueous buffers (pH 4-7) Acceptable for in vitro use
DMSO Also soluble
Ethanol Soluble

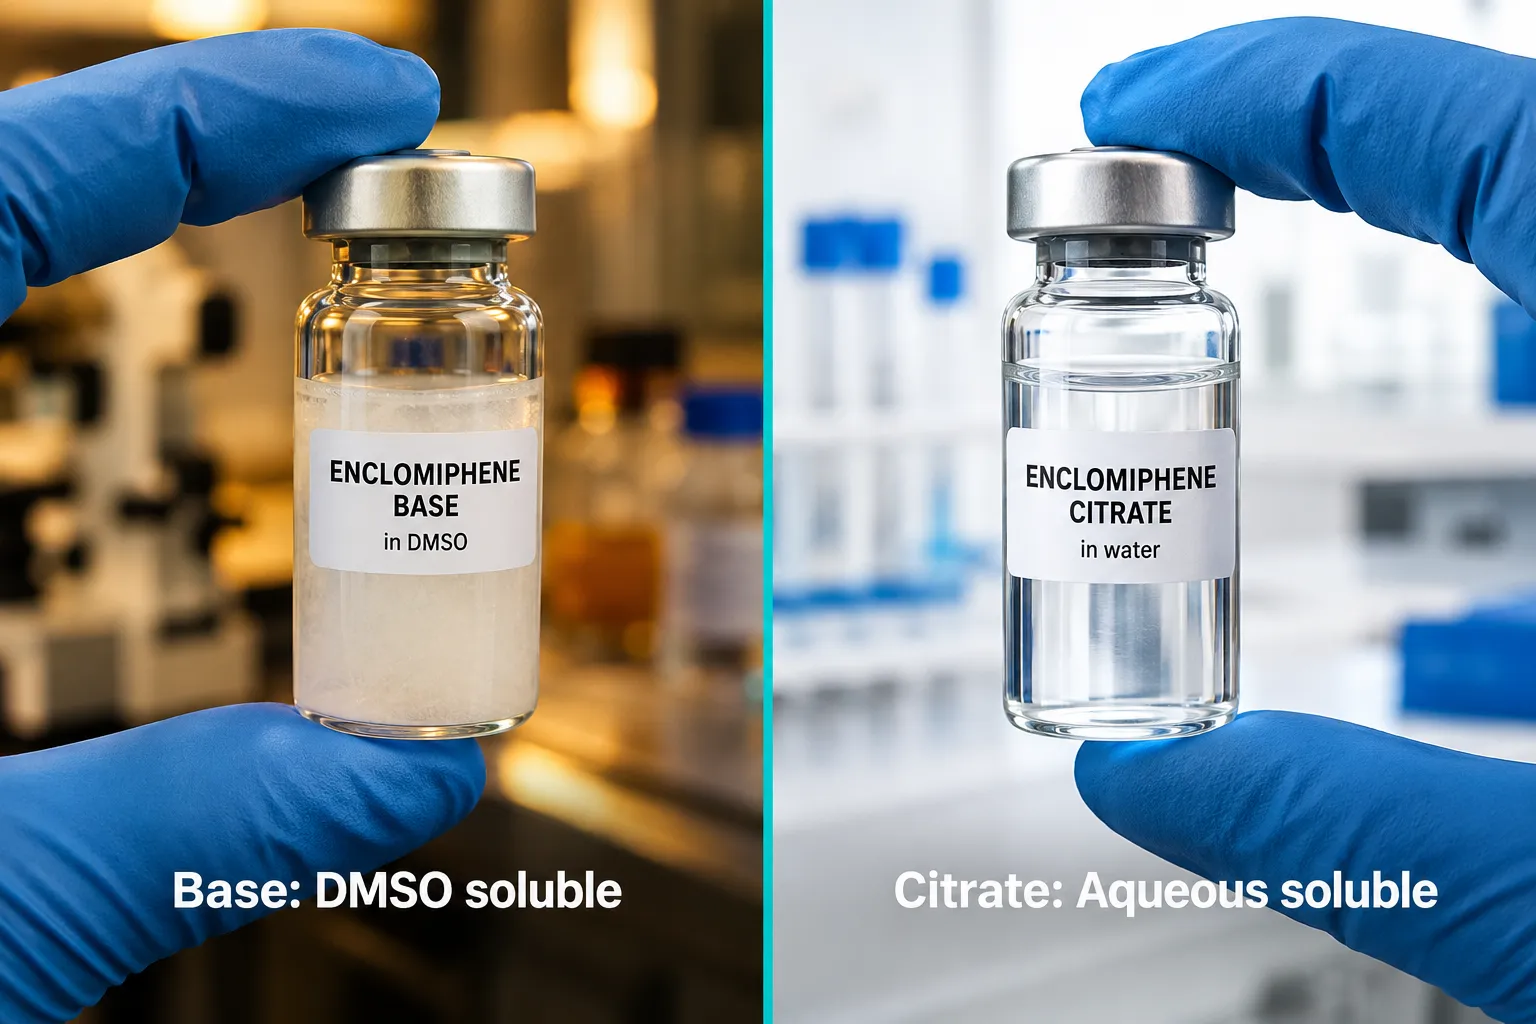
The citrate salt form improves aqueous solubility because the ionic character of the salt increases hydrophilicity. This is consistent with the broader pharmacology of clomiphene citrate, where the citrate counterion has historically been used precisely to improve handling in aqueous media. For researchers designing cell-based assays or receptor binding studies in aqueous buffer systems, enclomiphene citrate is the more practical choice. For organic solvent stock solutions intended for dilution into non-aqueous matrices, the base form is workable.

"Choosing the wrong salt form for an aqueous assay can introduce solubility artifacts that invalidate dose-response data, a problem that is entirely avoidable with upfront documentation review."

Researchers working with other peptides and small molecules that require careful solubility planning, such as those reviewing Bachem and reference standards for building robust peptide benchmarks, will recognize this as a standard quality-control consideration across compound classes.


COA Review: What a High-Quality Document Must Contain

COA Review: What a High-Quality Document Must Contain

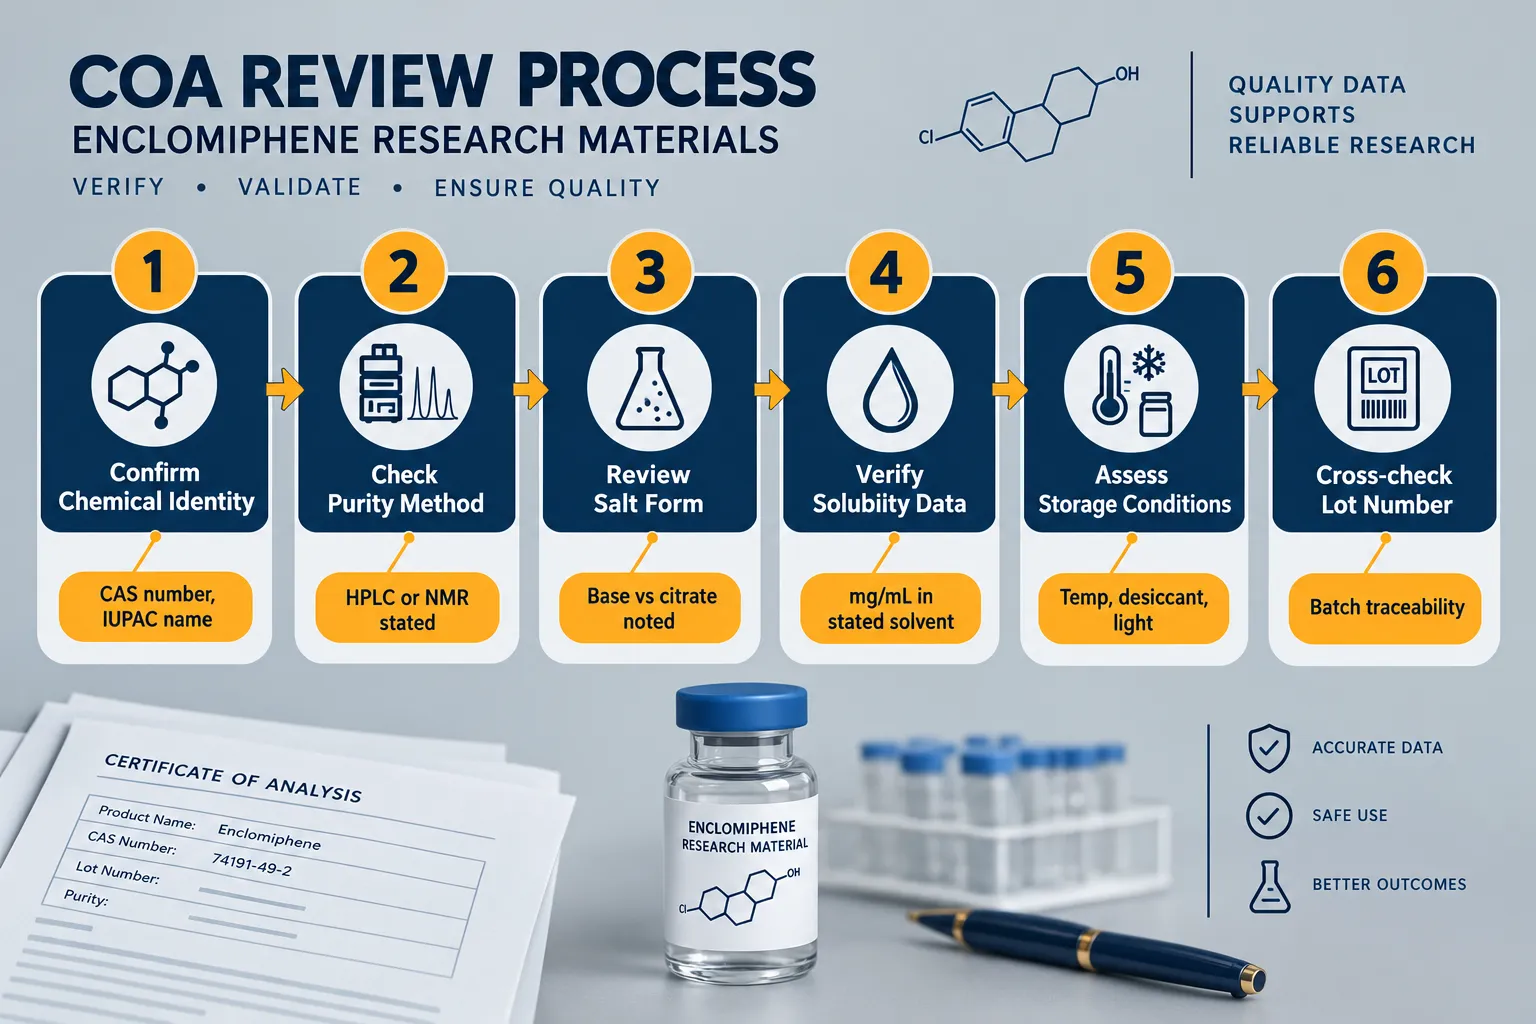
A Certificate of Analysis (COA) is not simply a purity number on a page. For enclomiphene research materials, whether base or citrate, a complete COA should contain the following elements, and researchers should decline materials where any of these are absent.

Required COA Elements for Enclomiphene Research Materials

  1. Chemical name and salt form, explicitly stating "enclomiphene citrate" or "enclomiphene free base," not just "enclomiphene"
  2. CAS number, matching the stated form
  3. Molecular formula and molecular weight, allowing the researcher to verify the correct form independently
  4. Purity method, HPLC is the standard; NMR is acceptable as a supplementary identity confirmation
  5. Purity result, expressed as area percentage from HPLC, with the method conditions (column type, mobile phase, wavelength) ideally referenced
  6. Isomeric confirmation, documentation that the material is the trans-isomer (enclomiphene), not the cis-isomer (zuclomiphene) or the racemate
  7. Solubility data, stated solvent, concentration, and whether the solution was clear or required sonication
  8. Lot or batch number, for traceability
  9. Storage conditions, temperature, desiccant requirement, light sensitivity
  10. Manufacturer or testing laboratory identity

As of 2026, enclomiphene citrate appears in some NDC (National Drug Code) listings, but this does not constitute FDA approval of any enclomiphene product. Researchers should not interpret an NDC listing as a regulatory clearance signal. All procurement of enclomiphene in any form remains strictly within research contexts, and COA documentation should be evaluated accordingly.

Researchers familiar with documentation standards for other well-characterized compounds, such as those reviewing SS-31 mechanism and research sourcing considerations, will find the same principles apply: supplier transparency, third-party testing, and explicit lot traceability are non-negotiable.


Formulation Strategies and Assay Planning Considerations

Knowing the form is only the first step. Translating that knowledge into a working formulation requires a few additional decisions.

For enclomiphene citrate in aqueous systems:

  • Prepare stock solutions in sterile water or phosphate-buffered saline
  • Confirm clarity visually and via UV absorbance baseline before use
  • Note that pH can affect solubility, acidic conditions (pH 4-5) generally favor dissolution

For enclomiphene base in organic solvent systems:

  • DMSO stocks at 10 mg/mL are a common starting point
  • Dilute into aqueous media at no more than 0.1% DMSO final concentration to avoid solvent cytotoxicity in cell assays
  • Sonication in a water bath (37°C, 15-30 minutes) can aid dissolution

Researchers sourcing other research-grade materials that require similar formulation planning, including those exploring IPA sermorelin stack research or reviewing tesa dosage considerations, will recognize that solvent compatibility and stock preparation protocols are just as important as compound identity.

For researchers also working with compounds in the aging support category, cross-referencing COA documentation practices across compound classes is a useful habit that strengthens overall laboratory quality standards.


Conclusion

Procuring enclomiphene research materials without first resolving the base-versus-citrate distinction is a preventable source of experimental error. The two forms differ in molecular weight, aqueous solubility, and the documentation that should accompany them. A COA that fails to specify salt form, purity method, or isomeric identity is insufficient for rigorous research use.

Actionable next steps for researchers in 2026:

  • Request full COA documentation before purchase, and verify that salt form and CAS number are explicitly stated
  • Match the form to the solvent system: citrate for aqueous assays, base for organic solvent stocks
  • Cross-check the stated molecular weight against published values for the specific form to catch mislabeling
  • Confirm isomeric purity (trans-enclomiphene vs. cis-zuclomiphene) through HPLC or NMR data on the COA
  • Treat any NDC listing as administrative, not as a regulatory approval signal

Rigorous identity verification and documentation review are the difference between reproducible data and ambiguous results. Applying these standards consistently, across enclomiphene and every other research compound in the laboratory, is the hallmark of credible, defensible research practice.

https://www.puretestedpeptides.com/wp-content/uploads/2026/09/enclomiphene-research-materials-enclomiphene-base-vs-citrate-for-identity-solubi.webp 1024 1536 https://www.puretestedpeptides.com/wp-content/uploads/2026/01/buy-peptides-online.jpg 2026-09-28 13:04:022026-09-28 13:04:02Enclomiphene Research Materials: Enclomiphene Base vs Citrate for Identity, Solubility, and COA Review
Why Peptide Research Results Are Hard to Compare: Sequence Identity, Salt Form, Purity, Vehicle, and Assay Context

Why Peptide Research Results Are Hard to Compare: Sequence Identity, Salt Form, Purity, Vehicle, and Assay Context

September 28, 2026/0 Comments/in Uncategorized/by

Two research teams test what appears to be the same peptide. One reports robust receptor activation at 100 nM. The other sees no significant effect below 1 µM. Neither team made an error. The divergence comes from variables that never appear in the abstract, and understanding those variables is exactly why peptide research results are hard to compare across studies, suppliers, and model systems.

Key Takeaways

  • A peptide sequence name does not fully identify a compound; stereochemistry, terminus modifications, and counterions all alter biological behavior
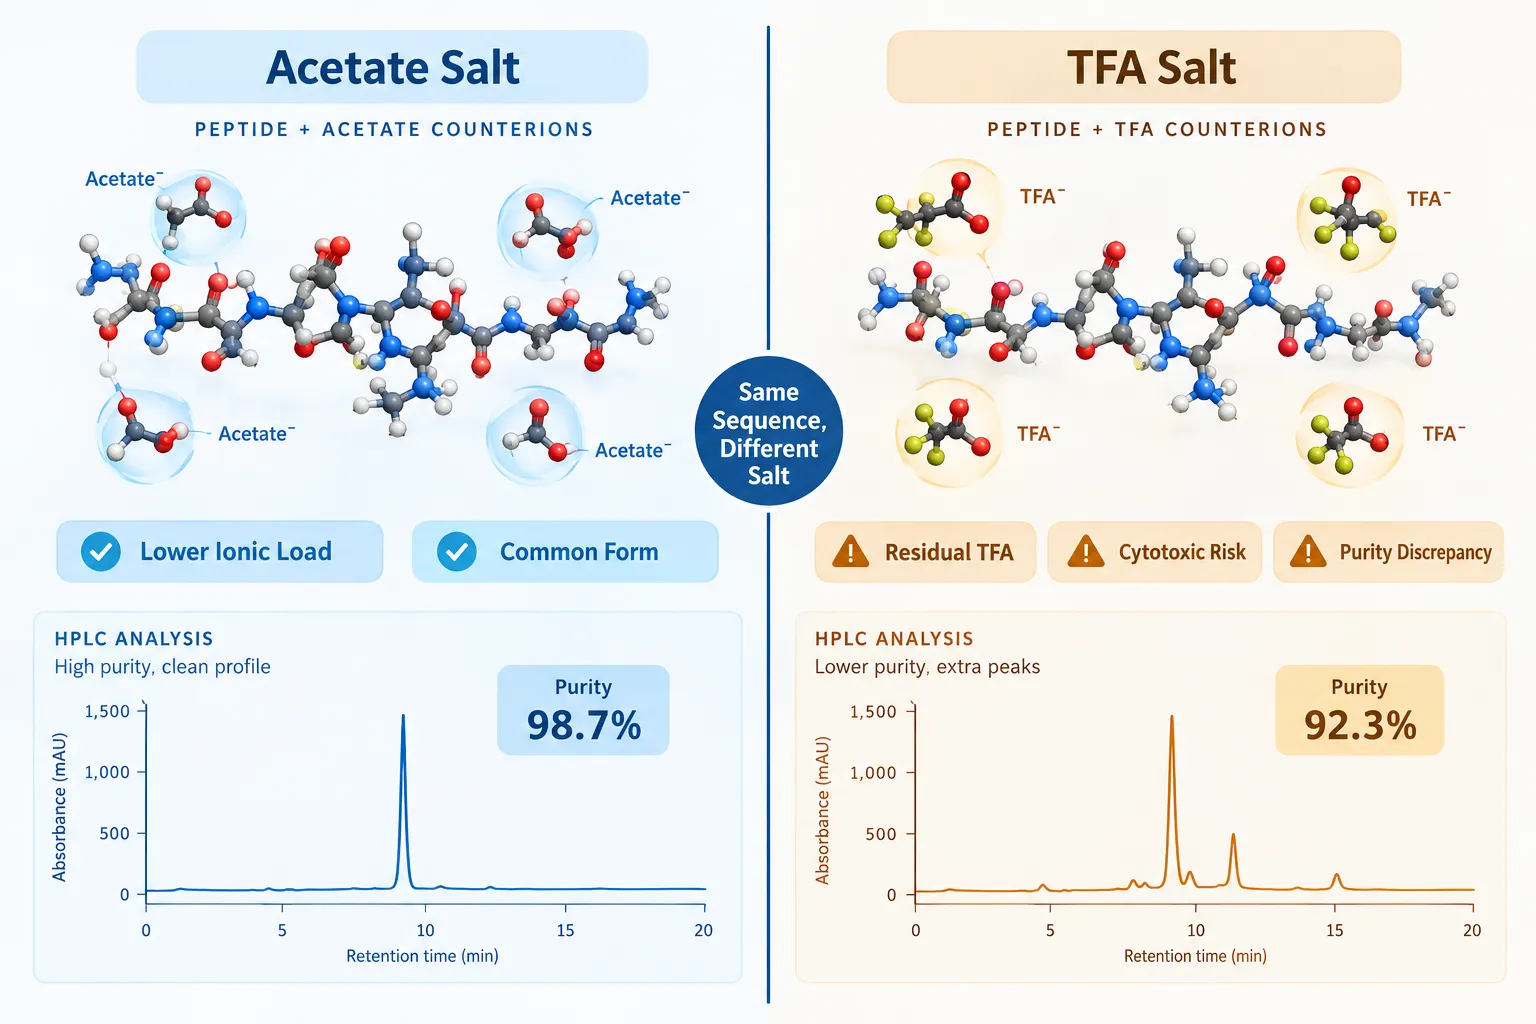
  • Salt form and residual counterions such as trifluoroacetate (TFA) can introduce cytotoxic artifacts that distort assay results
  • Purity figures are only meaningful when the analytical method, instrument platform, and impurity profile are disclosed
  • Vehicle, buffer pH, reconstitution solvent, and handling temperature each shift effective peptide concentration and aggregation state
  • Assay context, species, receptor density, dose normalization basis, and readout method, determines whether two studies are genuinely comparable

Sequence Identity Is Not as Simple as It Looks

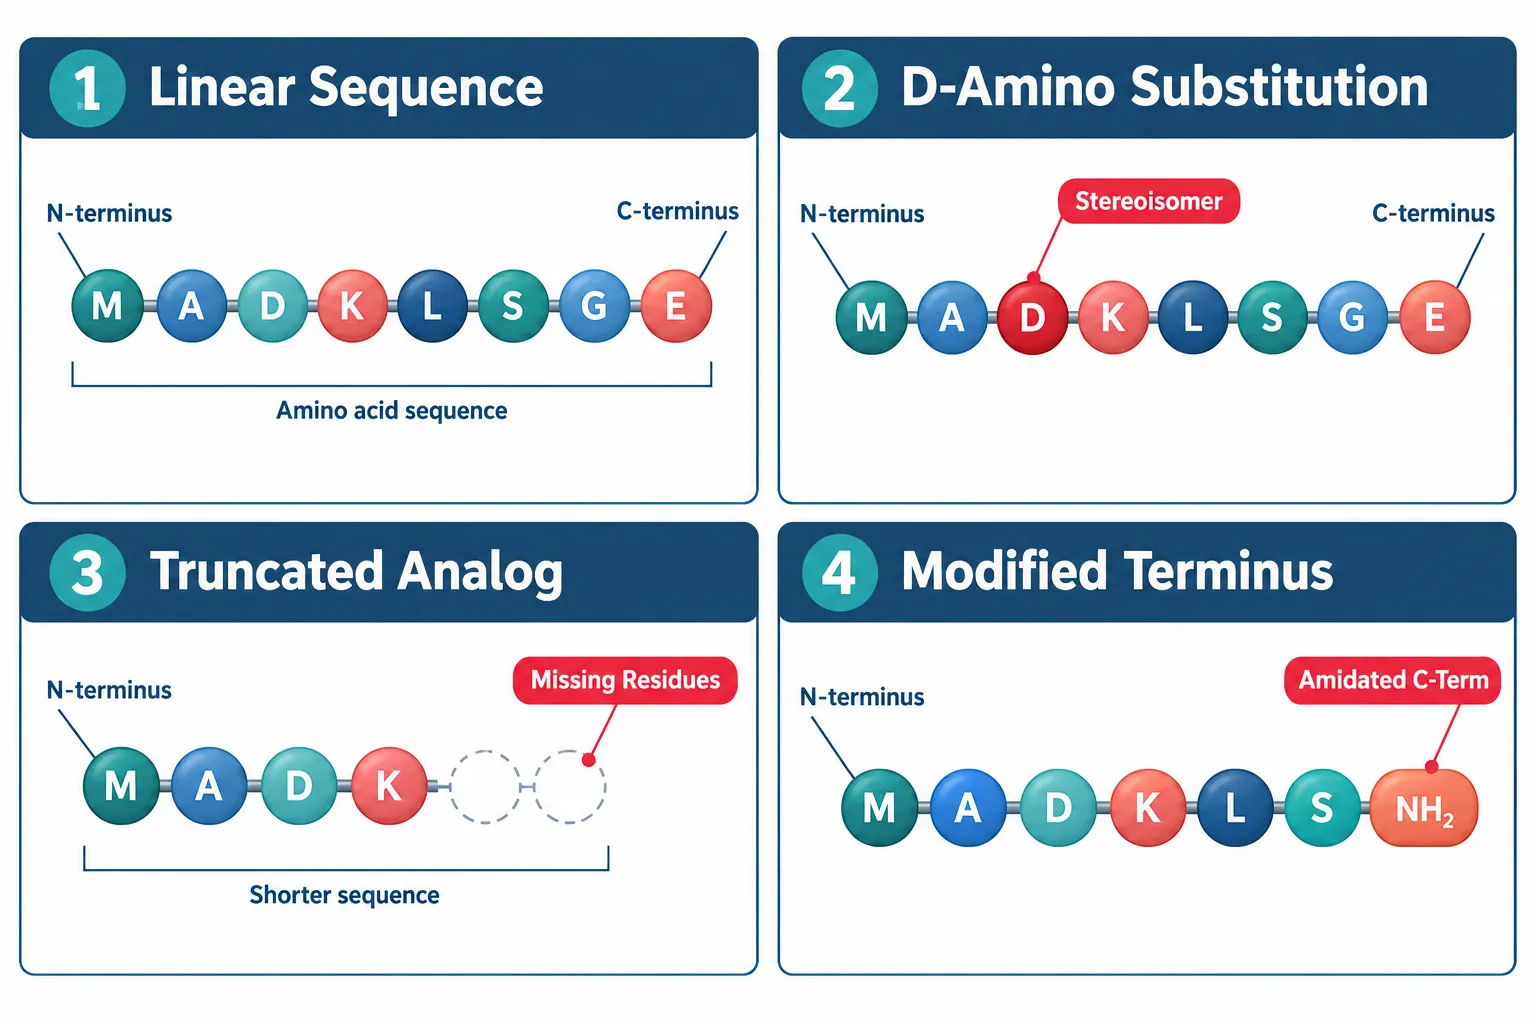
When researchers cite a peptide by its one-letter amino acid string, they are describing connectivity only. That string says nothing about stereochemistry, terminus status, backbone modifications, or cyclic constraints. A peptide containing even one D-amino acid substitution can show dramatically different protease resistance and receptor binding compared to its all-L counterpart, yet both compounds may carry the same sequence notation in a publication.

Sequence Identity Is Not as Simple as It Looks

Terminus modifications compound this problem further. An amidated C-terminus changes the charge distribution across the molecule. An acetylated N-terminus alters hydrogen-bonding capacity. Regulatory guidance effective in 2026 explicitly states that sequence identity alone is insufficient for comparability assessments and requires orthogonal analytical methods to confirm structural equivalence. A 2026 reproducibility framework formalizes this by introducing a six-field specification, sequence, stereochemistry, terminus status, modification type, supplier lot, and certificate data, arguing that a sequence string "defines connectivity only."

Researchers sourcing compounds such as Ipamorelin peptide for sale or GHK-Cu peptide for sale should request full structural confirmation, not just a sequence match, before drawing cross-study comparisons.


Salt Form, Purity, and Why the Numbers Mislead

The Counterion Problem

Most synthetic peptides are supplied as salts. The two most common counterions are acetate and trifluoroacetate (TFA). TFA is a byproduct of standard Fmoc solid-phase synthesis and is not always removed during purification. Residual TFA has documented cytotoxic effects in cell-based assays. A compound reported at 95% purity as a TFA salt and the same compound at 95% purity as an acetate salt are not functionally equivalent, even though the purity figures look identical on paper.

The Counterion Problem

Purity Figures Without Context Are Incomplete

Purity is reported as a percentage, but that number depends entirely on the analytical method used to generate it. Reversed-phase HPLC at 214 nm is the most common approach, but it weights peptide bonds rather than mass. A 2026 researcher's guide positions HPLC combined with mass spectrometry (MS) as the gold standard, noting that purity definitions and vehicle choices are among the leading drivers of inter-study divergence. Without knowing the detection wavelength, column chemistry, gradient conditions, and whether MS confirmation was performed, a purity certificate is difficult to interpret.

This matters especially for structurally complex or modified peptides. Research into compounds like SS-31 peptide or cagrilintide peptide, both of which carry specific structural features, requires purity data tied to orthogonal methods, not a single HPLC trace.

Key insight: “A sequence name is not an identifier unless coupled to supplier, lot, and certificate data.”, 2026 peptide research standards

Vehicle, Assay Context, and Dose Normalization

How Vehicle and Handling Shift Results

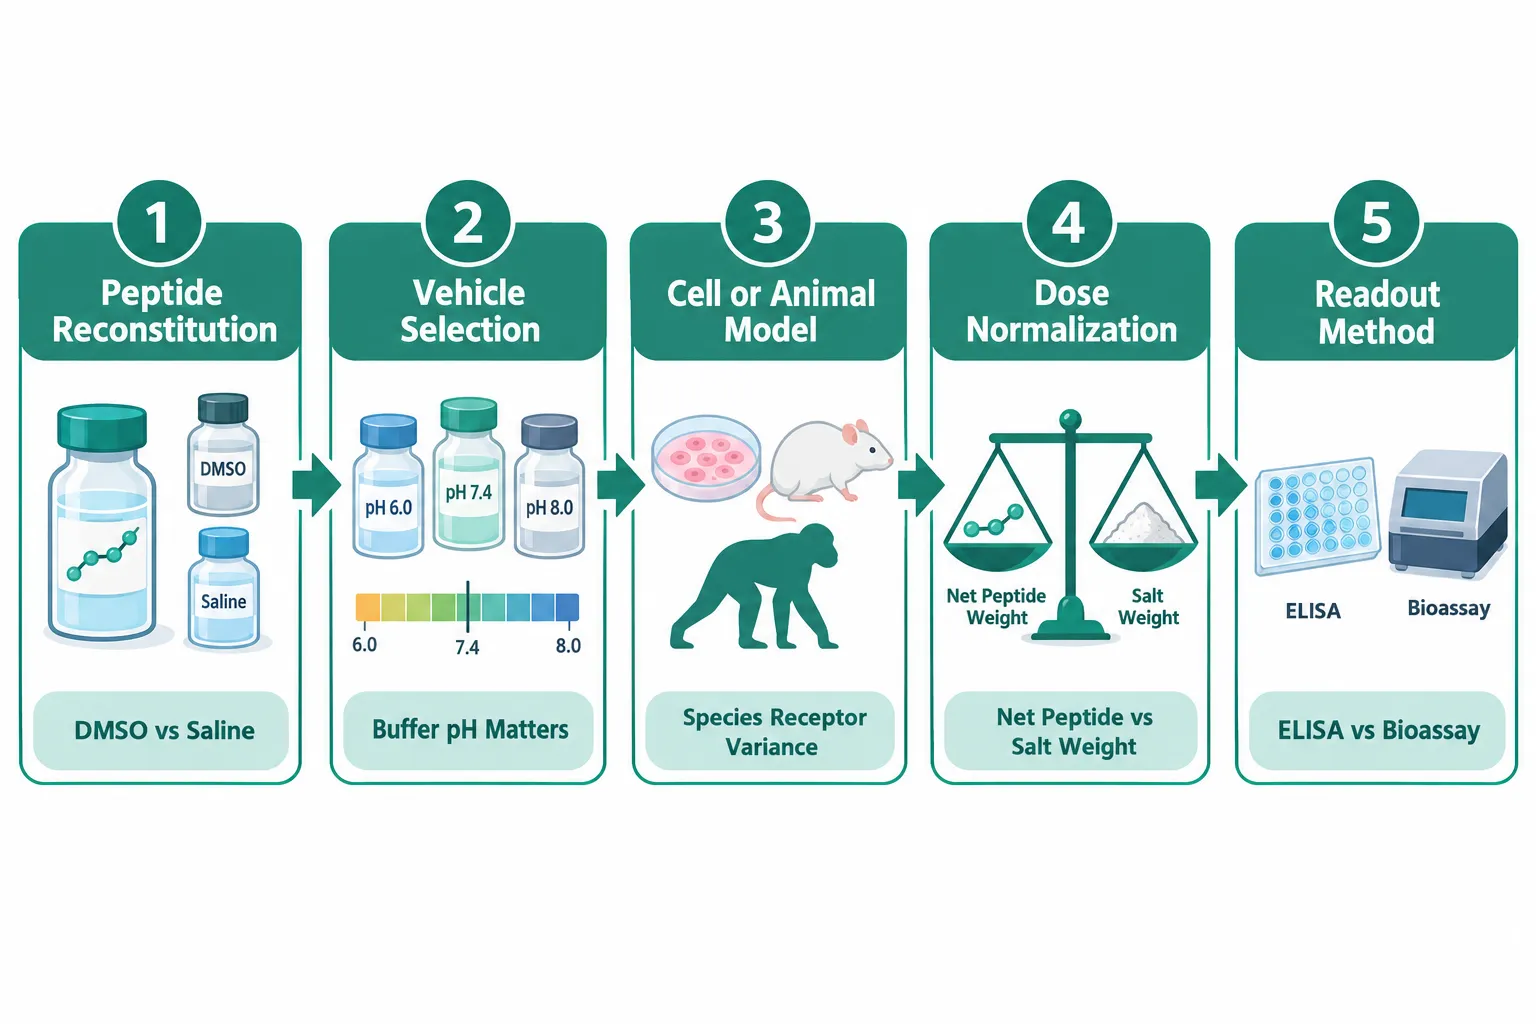
Even a perfectly characterized peptide can behave differently depending on how it is reconstituted and delivered. DMSO, aqueous buffers, saline, and serum-containing media each interact with peptide secondary structure in distinct ways. Some peptides aggregate readily in aqueous solution; others require a co-solvent to achieve true monomeric dispersion. Temperature during reconstitution, freeze-thaw cycles, and storage duration all affect aggregation state and therefore effective concentration at the receptor.

Buffer pH is equally critical. A peptide with multiple ionizable residues will carry a different net charge at pH 7.0 versus pH 7.4. That charge difference alters membrane interaction, receptor docking, and even metabolic stability in cell culture media.

How Vehicle and Handling Shift Results

Dose Normalization: Net Peptide vs. Salt Weight

One of the most overlooked sources of non-comparability is how dose is expressed. When a peptide is supplied as a TFA or acetate salt, the counterion contributes to the total mass. A 1 mg vial of a peptide TFA salt may contain only 0.80-0.88 mg of actual peptide, depending on the molecular weight ratio. If one study doses by salt weight and another by net peptide content, the effective molar doses differ, sometimes by 15-20%, without any note in the methods section.

Researchers working with GLP-3 peptide analogs or visceral fat research models should confirm whether reported doses reflect salt weight or net peptide content before comparing results across publications.

Model System and Readout Method

Species differences in receptor expression, receptor density, and downstream signaling cascades mean that results from a rodent model do not translate directly to human cell lines, and vice versa. An immunogenicity review from mid-2025 highlighted ongoing regulatory uncertainty about "how different is too different" when quality attributes vary across batches or suppliers.

Readout method adds another layer. An ELISA measuring a downstream marker, a radioligand binding assay measuring receptor occupancy, and a functional bioassay measuring cellular response can each produce different apparent potency rankings for the same set of compounds. None of these methods is wrong; they simply measure different things.


Practical Steps for Improving Comparability

Researchers can reduce non-comparability by adopting a structured documentation approach before and after any experiment:

Variable Minimum Disclosure
Sequence Full sequence with stereochemistry and terminus status
Salt form Counterion identity and conversion factor used
Purity Method, instrument, wavelength, and lot number
Vehicle Reconstitution solvent, buffer, pH, and storage conditions
Dose Net peptide content, not salt weight
Assay Species, cell line, receptor density, and readout method

Sourcing from suppliers who provide full analytical packages, including HPLC traces, MS confirmation, and counterion disclosure, is the single most effective way to reduce pre-experimental uncertainty. Platforms that offer wholesale peptides for sale with batch-specific certificates of analysis make this documentation easier to obtain and archive.

For AI-designed or novel peptides entering research pipelines, a July 2026 analysis of computational peptide design identifies physical validation and full contextual reporting as the primary bottleneck to reproducibility, reinforcing that the problem is not unique to commercially sourced compounds.


Conclusion

Why peptide research results are hard to compare comes down to a chain of underreported variables: sequence notation that omits stereochemistry and modifications, counterion identity that affects both mass calculation and cell viability, purity figures that depend on undisclosed analytical conditions, vehicles that alter aggregation and effective concentration, and assay contexts that measure fundamentally different biological endpoints.

Actionable next steps for researchers:

  1. Request and archive full structural specifications, not just sequence strings, for every compound used
  2. Confirm counterion identity and apply the appropriate mass correction factor before calculating molar doses
  3. Report purity with method details, including instrument, column, wavelength, and gradient
  4. Document reconstitution solvent, buffer pH, storage temperature, and freeze-thaw history in the methods section
  5. When comparing across studies, map each variable in the table above before drawing mechanistic conclusions

Adopting these practices does not eliminate all sources of divergence, but it transforms vague disagreements between studies into tractable, resolvable differences, which is the foundation of reproducible science.

https://www.puretestedpeptides.com/wp-content/uploads/2026/09/why-peptide-research-results-are-hard-to-compare-sequence-identity-salt-form-pur.webp 1024 1536 https://www.puretestedpeptides.com/wp-content/uploads/2026/01/buy-peptides-online.jpg 2026-09-28 13:03:392026-09-28 13:03:39Why Peptide Research Results Are Hard to Compare: Sequence Identity, Salt Form, Purity, Vehicle, and Assay Context
Epithalon, Telomerase, and Senescence Assays: Choosing qPCR, Telomere-Length, and Senescence-Associated Readouts

Epithalon, Telomerase, and Senescence Assays: Choosing qPCR, Telomere-Length, and Senescence-Associated Readouts

September 27, 2026/0 Comments/in Uncategorized/by

,

Professional () hero image with 'Epithalon, Telomerase, and Senescence' in crisp white modern on a deep navy

Fewer than 5% of published peptide-aging studies correctly distinguish between telomerase activity, average telomere length, and telomere distribution, yet each endpoint tells a fundamentally different biological story. When studying Epithalon, Telomerase, and Senescence Assays: Choosing qPCR, Telomere-Length, and Senescence-Associated Readouts is not a matter of preference; it is a matter of endpoint validity. Selecting the wrong assay can produce data that looks compelling but answers the wrong question entirely.

Key Takeaways

  • Telomerase activity, average telomere length, and telomere distribution are distinct endpoints that require different assay platforms.
  • Epithalon's documented effects on telomerase are primarily from in vitro cell-culture models; direct human extrapolation remains premature as of 2026.
  • qPCR-based telomere length measurement is cost-effective but reports only a relative average; Flow-FISH and TRF provide distribution and absolute sizing.
  • Senescence-associated readouts (SA-beta-gal, p21, p16, SASP panels) must complement telomere assays to confirm biological aging phenotypes.
  • Assay choice should be driven by the specific research question, not by convenience or cost alone.

Understanding What Each Endpoint Actually Measures

Understanding What Each Endpoint Actually Measures

Before selecting any platform, researchers must clarify which biological event they want to capture. The four major endpoints in Epithalon, Telomerase, and Senescence Assays: Choosing qPCR, Telomere-Length, and Senescence-Associated Readouts work are not interchangeable.

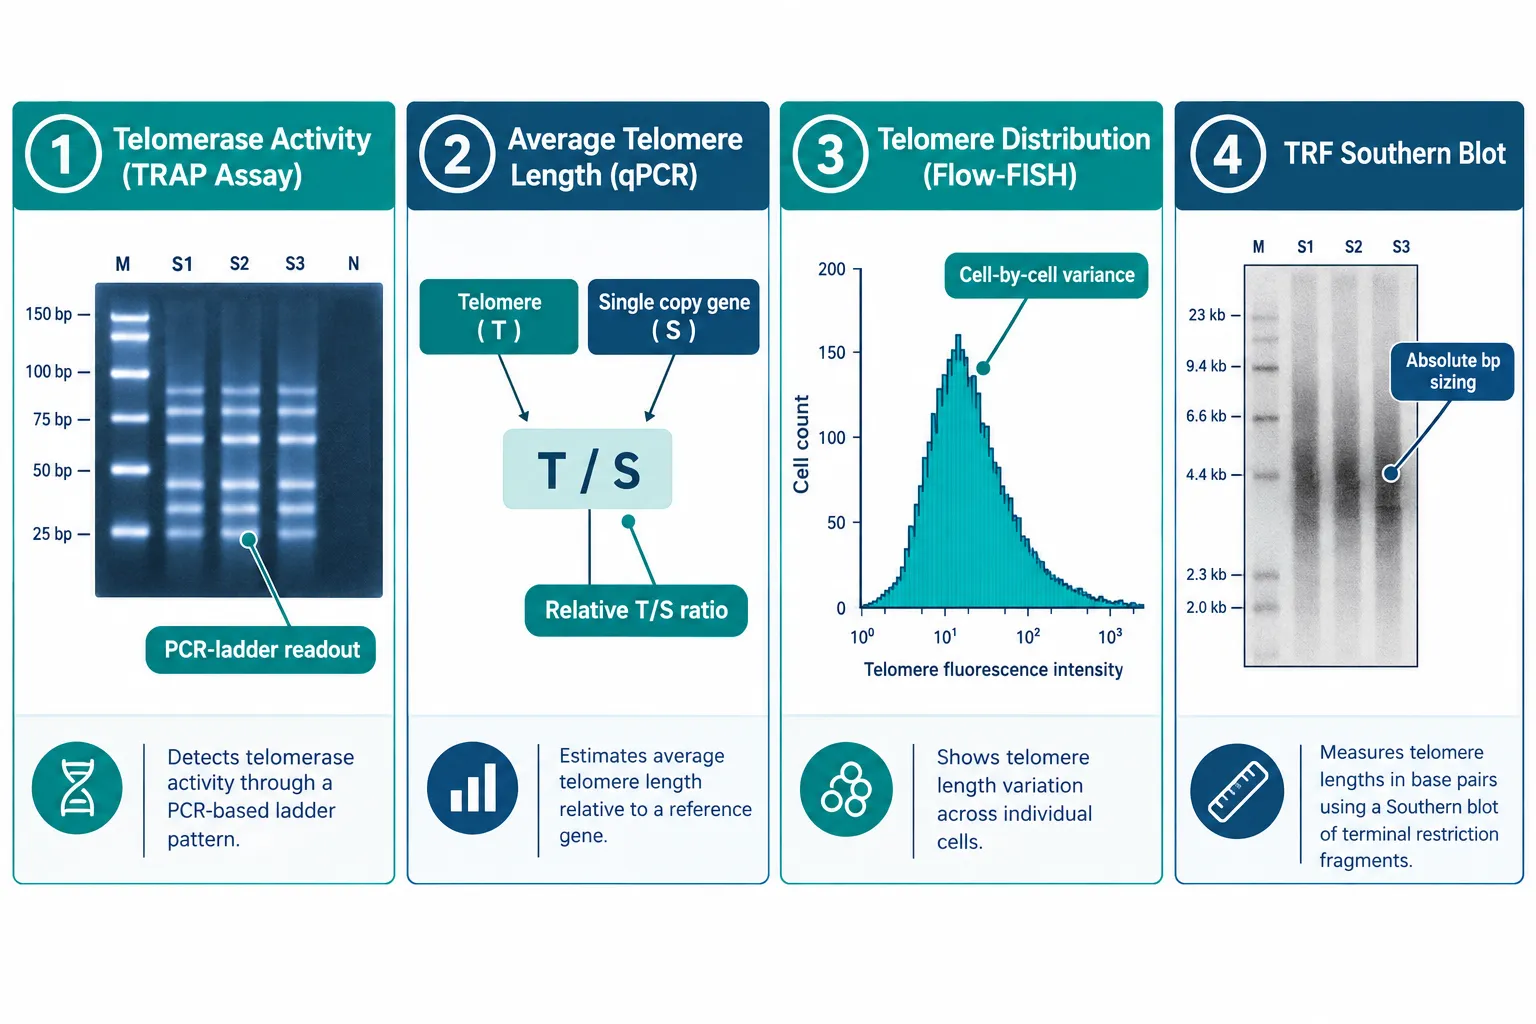
Telomerase Activity measures the enzymatic capacity of the telomerase complex to extend telomere repeats. The gold-standard method is the Telomeric Repeat Amplification Protocol (TRAP assay), which generates a PCR ladder pattern scored by gel densitometry or fluorescence. A positive TRAP result confirms the enzyme is functional, it says nothing about whether telomeres have actually lengthened.

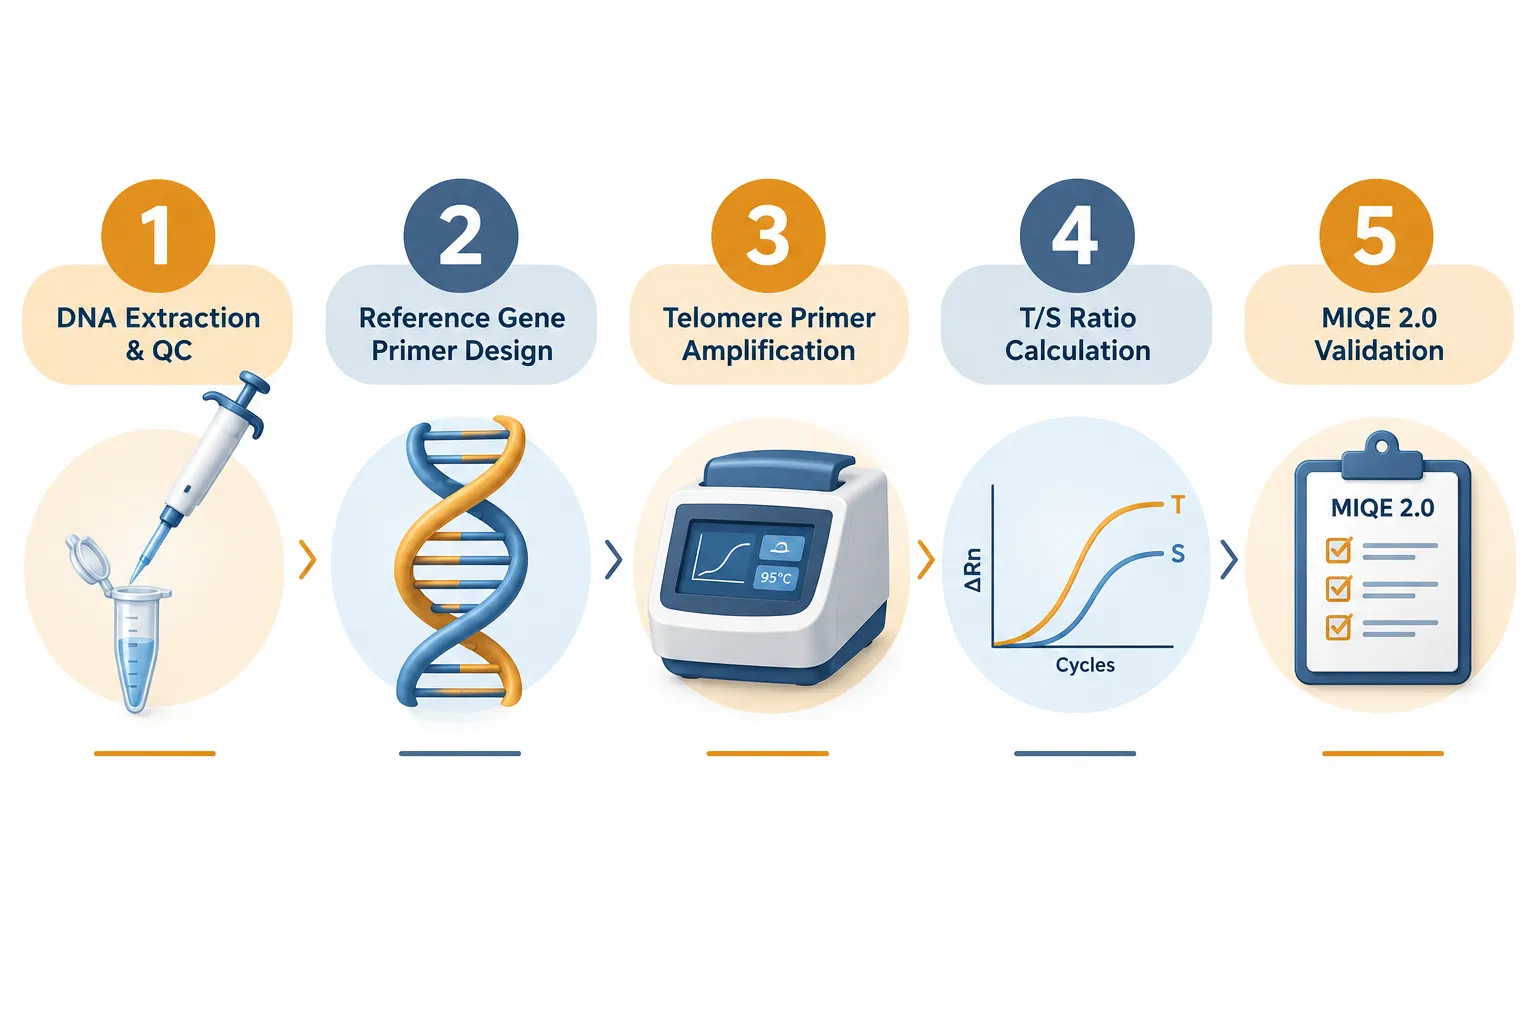
Average Telomere Length captures the mean repeat-count across all chromosomes in a cell population. Quantitative PCR (qPCR) reports this as a T/S ratio, telomere signal normalized to a single-copy reference gene. This is the most scalable method but collapses the entire distribution into one number.

Telomere Length Distribution reveals cell-to-cell and chromosome-to-chromosome variance. Flow-FISH (fluorescence in situ hybridization combined with flow cytometry) and Q-FISH on metaphase spreads provide this granular view. Critically, a cell population with a normal average T/S ratio can still harbor a subset of critically short telomeres driving senescence, information invisible to qPCR alone.

Terminal Restriction Fragment (TRF) Southern Blot remains the reference method for absolute base-pair sizing. It is low-throughput and requires large DNA inputs, but it anchors other assays to a concrete molecular ruler.

Assay Endpoint Throughput Key Limitation
TRAP Telomerase activity Medium Does not measure length
qPCR (T/S ratio) Average telomere length High Relative, not absolute
Flow-FISH Length distribution Medium Requires fresh cells
TRF Southern Blot Absolute length (bp) Low High DNA input needed
Q-FISH Chromosome-specific length Low Labor-intensive

Epithalon's Documented Effects and Assay-Selection Implications

Epithalon's Documented Effects and Assay-Selection Implications

Epithalon (Ala-Glu-Asp-Gly) is a synthetic tetrapeptide studied for its capacity to upregulate telomerase expression in human cell lines. Independent work from Brunel University and subsequent 2026 corrections to earlier datasets confirm that Epithalon can increase TERT (telomerase reverse transcriptase) mRNA levels and TRAP-positive activity in cultured cells. Bovine oocyte maturation studies published in 2025 further demonstrated telomerase activation in a reproductive biology context.

However, a 2026 systematic review concluded that the strongest evidence remains confined to cell culture. Dosing parameters used in vitro do not translate directly to in vivo concentrations, and no peer-reviewed human clinical trial has yet validated the telomere-lengthening claims circulating in popular media.

What this means for assay design:

  • If the goal is to confirm Epithalon's mechanism, a TRAP assay is the correct first-line tool, it directly measures the enzymatic output the peptide is claimed to stimulate.
  • If the goal is to detect downstream telomere elongation, qPCR T/S ratio is appropriate for screening, but positive findings must be confirmed by TRF or Flow-FISH before any mechanistic claim is made.
  • Cell-line studies should report passage number, serum conditions, and peptide concentration with full MIQE 2.0 compliance to allow cross-study comparison.

Researchers interested in related peptides that interact with cellular repair pathways, such as those exploring GHK-Cu peptide for sale options or wound healing peptide research, face similar endpoint-selection challenges when designing aging-biology experiments.

"Telomerase activation and telomere elongation are sequential, not synonymous. Reporting one without the other is an incomplete experiment."


Senescence-Associated Readouts: Completing the Picture

Senescence-Associated Readouts: Completing the Picture

Telomere data alone cannot confirm cellular senescence or its reversal. Senescence-Associated Secretory Phenotype (SASP) markers and classical senescence biomarkers must be layered in to validate any aging-biology claim.

Core senescence readouts to pair with telomere assays:

  • SA-beta-galactosidase (SA-beta-gal): Histochemical staining at pH 6.0; the most widely used senescence marker. Simple but not exclusive to senescence.
  • p21 (CDKN1A) and p16 (CDKN2A): Cyclin-dependent kinase inhibitors upregulated in senescent cells. Measured by Western blot or RT-qPCR. p16 is particularly stable and less influenced by acute stress responses.
  • SASP cytokine panels: IL-6, IL-8, MMP-3, and GDF-15 are frequently elevated. Multiplex ELISA or Luminex platforms allow simultaneous quantification.
  • Gamma-H2AX foci: Marks DNA double-strand breaks, including those at dysfunctional telomeres. Immunofluorescence co-localization with telomere probes (TIF assay) directly links telomere dysfunction to DNA damage signaling.

Combining these with telomere and telomerase readouts creates a multi-dimensional senescence profile. For example, a cell population showing elevated TRAP activity, stable T/S ratio, reduced p16, and decreased SA-beta-gal staining would provide much stronger evidence of senescence reversal than any single marker alone.

Researchers working with mitochondria-targeted peptides such as SS-31 Elamipretide or studying synergy of LL-37 and SS-31 in aging models should apply the same multi-endpoint logic when designing senescence assay panels.

For those sourcing research-grade compounds, verified suppliers offering NAD 500 and related longevity compounds alongside peptides provide a useful reference point for quality benchmarks.


Practical Assay-Selection Framework

Choosing between platforms for Epithalon, Telomerase, and Senescence Assays: Choosing qPCR, Telomere-Length, and Senescence-Associated Readouts projects should follow a tiered logic:

  1. Define the primary question first. Is the study asking whether Epithalon activates telomerase (use TRAP), changes average length (use qPCR), or alters the proportion of senescent cells (use SA-beta-gal + p16)?
  2. Apply MIQE 2.0 standards for all qPCR work. The Telomere Research Network's 2026 absolute telomere length protocol provides an improved step-by-step method that reduces inter-laboratory variability significantly.
  3. Use at least two orthogonal assays. No single platform is sufficient for publication-quality senescence claims.
  4. Report raw Ct values and efficiency data. T/S ratios without amplification efficiency correction are not reproducible across laboratories.
  5. Acknowledge the translational gap explicitly. In vitro Epithalon findings cannot be applied to human dosing without pharmacokinetic bridging studies.

Conclusion

Rigorous research into Epithalon, Telomerase, and Senescence Assays: Choosing qPCR, Telomere-Length, and Senescence-Associated Readouts demands that investigators treat each endpoint as a distinct biological question. TRAP assays confirm enzymatic activity; qPCR T/S ratios screen for average length changes; Flow-FISH and TRF resolve distribution and absolute sizing; and SA-beta-gal, p16, and SASP panels confirm the senescence phenotype.

Actionable next steps for researchers in 2026:

  • Audit existing Epithalon datasets for MIQE 2.0 compliance before drawing mechanistic conclusions.
  • Add at least one senescence marker (p16 or SA-beta-gal) to any telomere-length study to contextualize findings biologically.
  • Pre-register assay selection criteria before data collection to prevent endpoint switching.
  • Treat all in vitro Epithalon findings as hypothesis-generating, not clinically prescriptive, until controlled human studies are available.

The field will advance faster when endpoint selection is treated as a scientific decision, not an afterthought.

https://www.puretestedpeptides.com/wp-content/uploads/2026/09/epithalon-telomerase-and-senescence-assays-choosing-qpcr-telomere-length-and-sen.webp 1024 1536 https://www.puretestedpeptides.com/wp-content/uploads/2026/01/buy-peptides-online.jpg 2026-09-27 13:03:452026-09-27 13:03:45Epithalon, Telomerase, and Senescence Assays: Choosing qPCR, Telomere-Length, and Senescence-Associated Readouts
Advanced Glycation End Products in Peptide Studies: Choosing Fluorescence, RAGE, and Oxidative-Stress Readouts

Advanced Glycation End Products in Peptide Studies: Choosing Fluorescence, RAGE, and Oxidative-Stress Readouts

September 27, 2026/0 Comments/in Uncategorized/by

Roughly 50 distinct molecular species qualify as advanced glycation end products (AGEs), yet most peptide researchers rely on fewer than five assay strategies to detect them, a mismatch that quietly undermines experimental conclusions. Designing a rigorous glycation study requires matching the right detection method to the right AGE species, understanding how RAGE signaling connects to downstream inflammation, and selecting oxidative-stress readouts that complement rather than duplicate fluorescence data. This article on Advanced Glycation End Products in Peptide Studies: Choosing Fluorescence, RAGE, and Oxidative-Stress Readouts walks through each decision point so researchers can build a coherent, reproducible assay panel from the start.

Key Takeaways

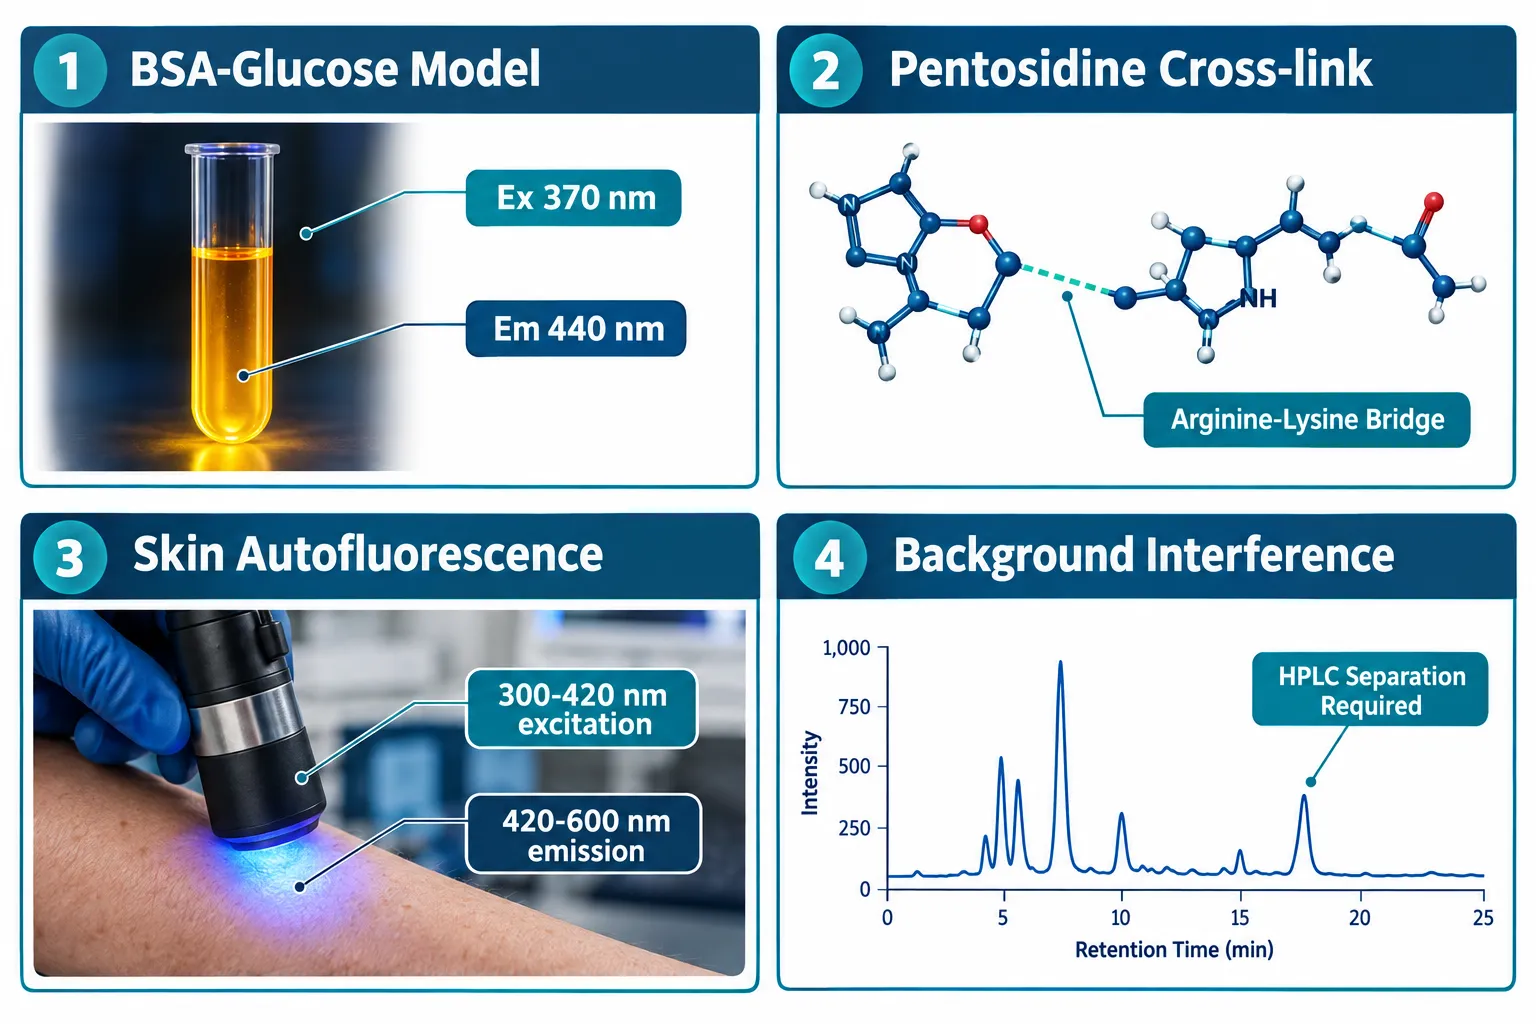
  • Fluorescent AGEs (fAGEs) such as pentosidine and methylglyoxal-lysine dimer (MOLD) are detected at specific excitation/emission windows, but background fluorescence often demands HPLC or immunoassay separation.
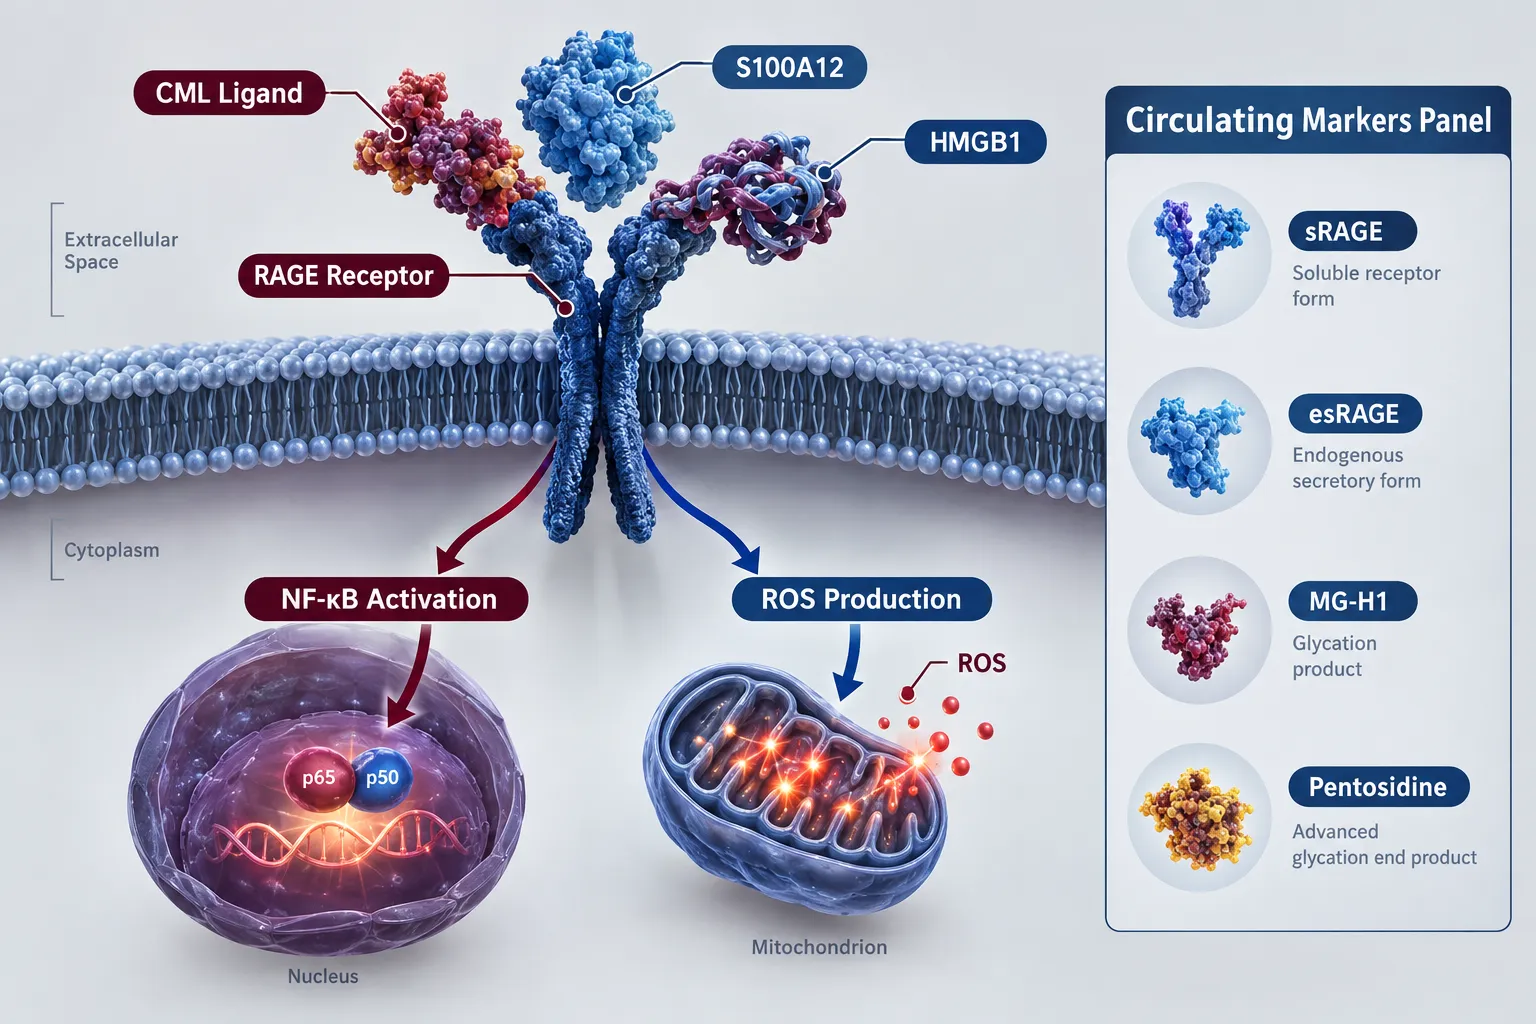
  • The RAGE signaling panel should include at minimum CML, CEL, MG-H1, sRAGE, esRAGE, HMGB1, and S100A12 for a complete picture of receptor-mediated glycation stress.
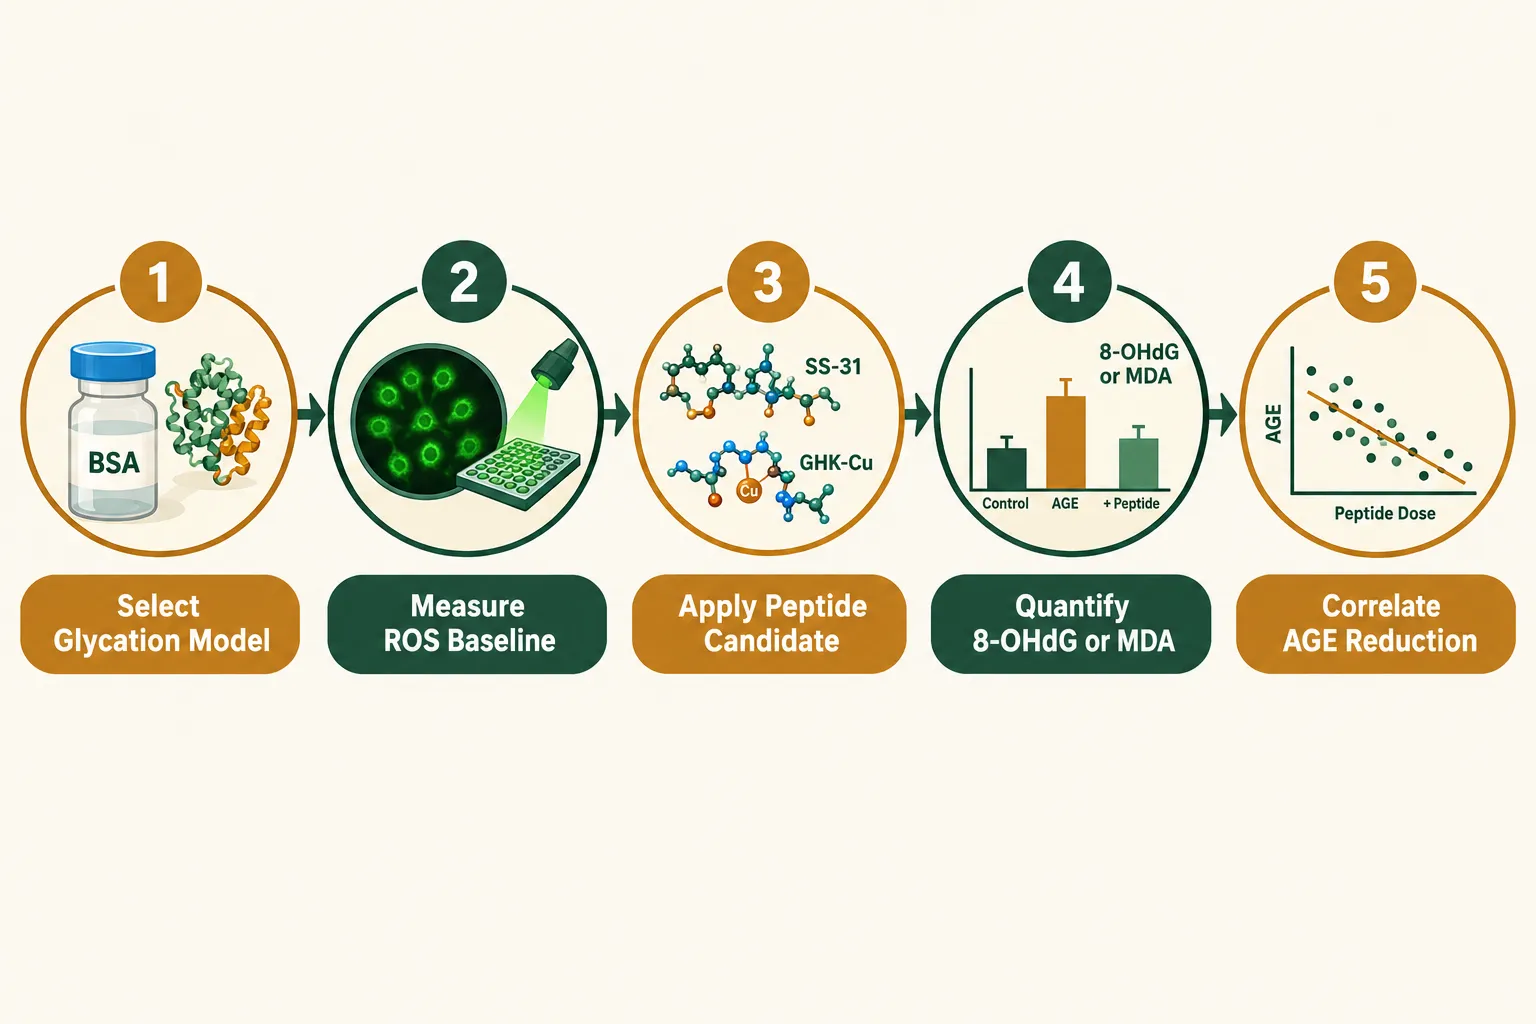
  • Oxidative-stress markers (ROS, 8-OHdG, MDA) serve as orthogonal readouts that confirm AGE-driven cellular damage without redundancy.
  • Peptide candidates such as SS-31 and GHK-Cu are evaluated in glycation models for their potential to modulate these pathways, though causality claims require controlled, multi-readout designs.
  • Choosing the correct glycation model (BSA-glucose, HSA-methylglyoxal, or collagen-ribose) determines which AGE species dominate and therefore which assays are appropriate.

Setting Up the Glycation Model: The Foundation of Every Assay

Before selecting any readout, researchers must define the glycation model. The choice of protein substrate and reducing sugar determines which AGE species accumulate, and that dictates every downstream measurement.

Setting Up the Glycation Model: The Foundation of Every Assay

Three models dominate the literature:

Model Primary AGEs Formed Best Readout
BSA + glucose (37 °C, 4-8 weeks) Pentosidine, CML, MOLD Fluorescence (Ex 370/Em 440 nm)
HSA + methylglyoxal (short incubation) MG-H1, CEL LC-MS/MS or ELISA
Collagen + ribose Cross-linked fAGEs, pentosidine Fluorescence + tensile assay

In a well-characterized in vitro study using the BSA-glucose model, novel peptides were screened for anti-glycation activity by measuring fluorescence at excitation 370 nm and emission 440 nm with a spectrofluorometer. This approach is cost-effective and scalable, but it captures only the fluorescent fraction of total AGEs.

Key point: Non-fluorescent AGEs such as pyrraline and CML will not appear in a standard fluorescence scan. If the research question involves receptor binding or cardiovascular risk markers, a fluorescence-only design is insufficient.


Fluorescence Readouts: Matching Excitation/Emission to the Target AGE

The fluorescence approach to Advanced Glycation End Products in Peptide Studies: Choosing Fluorescence, RAGE, and Oxidative-Stress Readouts is attractive because it requires no antibodies and delivers rapid throughput. However, precision depends on knowing the spectral fingerprint of each target species.

Major fluorescent AGEs and their windows:

  • Pentosidine, the first characterized natural fluorescent cross-link; excitation ~335 nm, emission ~385 nm
  • MOLD (methylglyoxal-lysine dimer), excitation ~370 nm, emission ~440 nm
  • Arg-P, useful for arginine-derived fAGE detection; recent mass spectrometry work has identified new cross-linked structures at arginine residues that extend this category

Cutaneous AGEs exhibit autofluorescence with excitation in the 300-420 nm range and emission between 420-600 nm, enabling non-invasive skin measurements. This principle underlies commercial skin autofluorescence readers used in diabetes monitoring.

"Background fluorescence from other sample components frequently obscures results, necessitating chromatographic or immunoassay-based separation for robust quantification."

A practical solution is the flow injection assay (FIA) integrated with HPLC, which has been validated for quantifying small fluorescent AGE-modified peptides in urine samples. For researchers evaluating skin-relevant peptides, the article on research-grade Glow Blend peptide purity and copper complexes provides useful context on how copper-complexed peptides interact with skin models where autofluorescence is a concern.


RAGE Signaling Panel: Moving Beyond Fluorescence

RAGE Signaling Panel: Moving Beyond Fluorescence

Fluorescence detects AGE accumulation, but RAGE activation is what drives pathological outcomes, NF-kB-mediated inflammation, fibrosis, and cardiomyopathy. A complete panel for Advanced Glycation End Products in Peptide Studies: Choosing Fluorescence, RAGE, and Oxidative-Stress Readouts should include both AGE ligands and RAGE-related circulating measures.

Recommended RAGE panel components:

  • AGE ligands: CML, CEL, MG-H1, pentosidine
  • Receptor variants: total soluble RAGE (sRAGE), endogenous secretory RAGE (esRAGE)
  • Danger-associated ligands: HMGB1, S100A12

The sRAGE/esRAGE ratio is particularly informative: soluble forms act as decoy receptors, sequestering AGE ligands before they engage membrane-bound RAGE. A high sRAGE level generally correlates with reduced signaling intensity.

For peptide studies with a metabolic focus, GLP-1 peptides and related incretin-axis compounds are increasingly studied in contexts where AGE-RAGE signaling intersects with glycemic control. Similarly, mitochondria-targeted peptides like SS-31 (Szeto-Schiller peptide) are evaluated in models where RAGE-driven oxidative stress is the primary endpoint, given their proposed role in mitochondrial membrane stabilization.

Measurement methods by marker:

  • CML, CEL, MG-H1: LC-MS/MS (gold standard) or competitive ELISA
  • sRAGE, esRAGE: sandwich ELISA
  • HMGB1, S100A12: ELISA or multiplex immunoassay

Oxidative-Stress Readouts: The Orthogonal Confirmation Layer

Oxidative-Stress Readouts: The Orthogonal Confirmation Layer

AGE formation and RAGE activation both generate reactive oxygen species (ROS), creating a self-amplifying loop. Oxidative-stress markers serve as orthogonal readouts that confirm biological impact without duplicating fluorescence or ELISA data.

Three-tier oxidative-stress readout strategy:

  1. ROS quantification, DCFH-DA fluorescence assay in cell-based models; captures real-time oxidative burst
  2. Lipid peroxidation, malondialdehyde (MDA) via TBARS assay; reflects membrane-level AGE-driven damage
  3. DNA oxidation, 8-hydroxy-2'-deoxyguanosine (8-OHdG) by ELISA; most specific marker of glycoxidative DNA stress

Anti-glycation agents such as metformin and pyridoxamine reduce fluorescent HSA-AGE emission intensity in HSA-dihydroxyacetone models, and this reduction correlates with decreased ROS output, demonstrating why pairing fluorescence with an ROS assay strengthens mechanistic claims.

Peptides under investigation for aging-related pathways, including those in the aging support category and mitochondria-focused compounds such as the Synergy of LL-37 and SS-31, are evaluated against these markers to assess whether observed effects align with reduced glycoxidative stress. Causal claims, however, require dose-response relationships and appropriate controls before they can be stated with confidence.

Practical tip: Always run a no-peptide glycation control and a non-glycated protein control in parallel. Without these, it is impossible to distinguish peptide-driven AGE reduction from assay variability.


Conclusion

Designing a rigorous AGE study for peptide research comes down to three sequential decisions: choose the right glycation model for the target AGE species, select fluorescence readouts matched to those species' spectral windows, and add RAGE panel markers plus orthogonal oxidative-stress assays to confirm biological relevance. Researchers should resist the temptation to rely on a single fluorescence scan as a complete answer, it captures only the fluorescent fraction and misses non-fluorescent species like CML and pyrraline that drive RAGE signaling.

Actionable next steps for 2026 research teams:

  • Establish the BSA-glucose or HSA-methylglyoxal model before introducing any peptide candidate
  • Run fluorescence scans at Ex 370/Em 440 nm alongside LC-MS/MS for CML and MG-H1
  • Include sRAGE and esRAGE ELISAs to assess receptor-level activity
  • Add at minimum one oxidative-stress readout (MDA or 8-OHdG) per experimental arm
  • Document all purity and concentration data for peptide candidates to ensure reproducibility across labs
https://www.puretestedpeptides.com/wp-content/uploads/2026/09/advanced-glycation-end-products-in-peptide-studies-choosing-fluorescence-rage-an.webp 1024 1536 https://www.puretestedpeptides.com/wp-content/uploads/2026/01/buy-peptides-online.jpg 2026-09-27 13:03:402026-09-27 13:03:40Advanced Glycation End Products in Peptide Studies: Choosing Fluorescence, RAGE, and Oxidative-Stress Readouts
Biologically Effective Dose in Peptide Experiments: Translating Nominal Concentration Into Exposure and Response

Biologically Effective Dose in Peptide Experiments: Translating Nominal Concentration Into Exposure and Response

September 27, 2026/0 Comments/in Uncategorized/by

Fewer than one in five in vitro peptide studies formally account for the gap between the concentration written on a vial label and the concentration that actually reaches a cellular receptor. That gap is not a minor rounding error. It can span an order of magnitude, and it is the central problem that the concept of biologically effective dose in peptide experiments: translating nominal concentration into exposure and response is designed to solve.

Nominal concentration, administered amount, molar concentration, exposure duration, and observed biological response are five distinct measurements. Treating them as interchangeable is one of the most common sources of irreproducible results in peptide research.

Key Takeaways

  • Nominal concentration is a calculated convenience metric, not a direct measure of what reaches the target site.
  • Protein binding, plastic adsorption, and cell-surface interactions can dramatically reduce the bioavailable fraction of a peptide in an assay.
  • The freely dissolved concentration (C_free) in the medium is a far better proxy for biologically effective dose than the nominal value.
  • Mass-balance and PBPK models can translate nominal doses into target-site exposure estimates when direct measurement is unavailable.
  • Exposure duration and time-dependent concentration profiles matter as much as peak concentration for predicting biological response.

Why Nominal Concentration Is Not the Same as Biologically Effective Dose

Why Nominal Concentration Is Not the Same as Biologically Effective Dose

When a researcher dissolves a peptide in cell culture medium and records "100 nM," that number describes what was added to the well, not what is available to the cell. Regulatory and scientific guidance is explicit: biologically effective dose (BED) is the amount of a compound at the organ, cell, or macromolecular target that is available to interact and cause a biological effect.

Several physical and chemical processes erode the nominal concentration before any peptide molecule encounters a receptor:

  • Serum protein binding – A significant fraction of added peptide binds to albumin and other serum proteins, removing it from the freely dissolved pool.
  • Plastic adsorption – Polystyrene plates and tubing can adsorb hydrophobic or amphipathic peptides, reducing the medium concentration over time.
  • Cell-surface sequestration – Cationic peptides, including mitochondria-targeted sequences like those found in SS31 peptide research, can associate with negatively charged membrane phospholipids before reaching their intended intracellular target.
  • Evaporation and degradation – Volatile solvents and enzymatic cleavage further reduce the effective concentration during extended incubations.

The result is that nominal concentration systematically overestimates in vitro potency relative to free concentration. Studies comparing dose-response curves built on nominal versus free concentrations consistently show that free concentration yields more consistent results across assay conditions and better predicts in vivo response.

"The freely dissolved, unbound concentration in the medium is generally a better proxy for biologically effective dose than the nominal concentration added to the well."

For peptides like those explored in peptide dosing research, this distinction has direct consequences for how minimum effective doses and therapeutic windows are interpreted.


A Framework for Translating Nominal Concentration Into Exposure and Response

A Framework for Translating Nominal Concentration Into Exposure and Response

Understanding the problem is only the first step. A practical framework for biologically effective dose in peptide experiments: translating nominal concentration into exposure and response involves a hierarchy of dose metrics, each closer to the actual site of action.

The Dose Metric Hierarchy

Dose Metric Definition Proximity to BED
Nominal concentration Added mass divided by medium volume Lowest
Loaded/released dose Amount released from formulation or carrier Moderate
C_free (freely dissolved) Unbound concentration in aqueous medium High
Cell-associated concentration Peptide measured in or on cells Very high
Target-site concentration Concentration at receptor or organelle Highest (true BED)

When direct measurement of C_free or cell-associated concentrations is unavailable, current scientific guidance requires that researchers either use dynamic mass-balance models or explicitly characterize the uncertainty introduced by relying on nominal values.

Applying Mass-Balance Models

Dynamic dosimetry models estimate medium and intracellular BED from a peptide's physicochemical properties: molecular weight, log P, protein binding fraction, and assay geometry. These in silico approaches allow researchers to predict how much active peptide remains in solution over time, accounting for partitioning into plastics and proteins.

For peptides such as those studied in GLP-3 peptide research or RETA peptide experiments, where receptor binding kinetics are central to the dose-response relationship, these corrections can shift the apparent EC50 substantially.

Time-Dependent Exposure Matters

A single nominal concentration value collapses a dynamic process into a static number. Quantitative in vitro-to-in vivo extrapolation (QIVIVE) frameworks emphasize that time-dependent concentration-response relationships are more informative than simple endpoint measurements. A peptide that degrades rapidly in serum may produce a high C_free spike followed by near-zero exposure, a profile that a nominal 100 nM label cannot describe.


Practical Steps for Implementing Biologically Effective Dose in Peptide Experiments

Practical Steps for Implementing Biologically Effective Dose in Peptide Experiments

Translating biologically effective dose in peptide experiments: translating nominal concentration into exposure and response from a theoretical concept into laboratory practice involves concrete, sequential actions.

Step 1 – Characterize protein binding. Use equilibrium dialysis or rapid equilibrium dialysis (RED) assay to determine the unbound fraction in the specific medium formulation used. Serum percentage matters: a 10% FBS medium and a 1% FBS medium will yield very different C_free values for the same nominal dose.

Step 2 – Assess plastic adsorption. Measure peptide recovery from wells at multiple time points. Significant losses over 24-48 hours signal adsorption, particularly relevant for amphipathic or cationic sequences.

Step 3 – Apply a mass-balance correction. Use the measured binding and adsorption data to calculate C_free at each time point. For complex peptides, consider PBPK-informed models.

Step 4 – Build time-resolved concentration-response curves. Plot response against C_free at the relevant time point, not against nominal concentration at time zero. This approach aligns with QIVIVE best practices and improves cross-study comparability.

Step 5 – Report both metrics. Publish nominal concentration alongside the calculated or measured C_free and any BED estimate. This supports reproducibility and allows other researchers to apply corrections for their own assay conditions.

For researchers working with mitochondria-targeted peptides, the synergy of LL-37 and SS31 provides a relevant case study in how membrane partitioning can dramatically alter the effective intracellular dose relative to the nominal medium concentration. Similarly, resources on tesa peptide benefits illustrate how administered dose and tissue-level exposure diverge in in vivo settings, reinforcing the same principle at a different scale.

When nominal doses are the only available metric, current guidance treats them as a starting point that requires explicit uncertainty characterization, not as a reliable proxy for BED.


Conclusion

The vial concentration is where a peptide experiment begins, not where it ends. Nominal concentration, administered amount, molar concentration, exposure duration, and biological response each occupy a distinct position in the chain of events between a researcher's bench and a cell's receptor. Conflating them produces dose-response curves that cannot be reproduced, translated to in vivo settings, or compared across laboratories.

Actionable next steps for researchers in 2026:

  1. Measure protein binding and plastic adsorption for every new peptide-assay combination before interpreting dose-response data.
  2. Report C_free alongside nominal concentration in all publications and internal records.
  3. Apply mass-balance or PBPK corrections when direct measurement is impractical.
  4. Build time-resolved exposure profiles rather than relying on single-timepoint nominal values.
  5. Treat nominal concentration as a convenience metric with documented uncertainty, not as a synonym for biologically effective dose.

Adopting these practices moves peptide research closer to the standard that regulators and leading toxicology groups now expect: dose-response relationships grounded in actual exposure at the target site.

https://www.puretestedpeptides.com/wp-content/uploads/2026/09/biologically-effective-dose-in-peptide-experiments-translating-nominal-concentra.webp 1024 1536 https://www.puretestedpeptides.com/wp-content/uploads/2026/01/buy-peptides-online.jpg 2026-09-27 13:03:402026-09-27 13:03:40Biologically Effective Dose in Peptide Experiments: Translating Nominal Concentration Into Exposure and Response
ACE Inhibitors and Research Peptides: Designing Blood-Pressure Controls Around Lisinopril and Growth-Hormone Secretagogues

ACE Inhibitors and Research Peptides: Designing Blood-Pressure Controls Around Lisinopril and Growth-Hormone Secretagogues

September 27, 2026/0 Comments/in Uncategorized/by

Nearly one billion adults worldwide live with hypertension, yet a growing number of researchers are simultaneously exploring growth-hormone secretagogue peptides whose hemodynamic effects remain poorly characterized. That overlap creates a real experimental design problem. When studying ACE inhibitors and research peptides, specifically designing blood-pressure controls around lisinopril and growth-hormone secretagogues, researchers must understand how ACE-pathway modulation shapes blood pressure, renal readouts, and fluid balance, and how those changes can confound or clarify CJC-1295, ipamorelin, and tesa experiments.

Key Takeaways

  • Lisinopril is a long-acting, evidence-backed ACE inhibitor with well-defined effects on blood pressure, cardiac events, and kidney function.
  • Growth-hormone secretagogues such as ipamorelin, CJC-1295, and tesa can cause fluid retention and potential blood-pressure elevation, particularly in stage 2 hypertension.
  • No rigorous human study has directly measured blood-pressure changes attributable to ipamorelin alone, creating a significant data gap.
  • ACE-pathway suppression alters aldosterone levels and glomerular filtration, which directly affects how renal endpoints are interpreted in peptide research.
  • Designing valid research protocols requires establishing stable lisinopril dosing before introducing GH-axis peptides, then monitoring BP at every injection-period review.

How the ACE Pathway Controls Blood Pressure and Renal Readouts

The renin-angiotensin-aldosterone system (RAAS) is the body's primary long-term blood-pressure regulator. Angiotensin-converting enzyme (ACE) converts angiotensin I into angiotensin II, a potent vasoconstrictor that also stimulates aldosterone release. Aldosterone drives sodium and water retention, raising blood volume and pressure.

How the ACE Pathway Controls Blood Pressure and Renal Readouts

Lisinopril blocks this conversion step directly. As an oral, long-acting ACE inhibitor, it is indicated for hypertension, heart failure, post-myocardial infarction management, and proteinuric diabetic kidney disease. Its pharmacological footprint extends well beyond simple vasodilation:

Effect Mechanism Research Relevance
Blood-pressure reduction Reduced angiotensin II, lower vascular resistance Establishes hemodynamic baseline
Natriuresis Decreased aldosterone, increased sodium excretion Alters fluid-balance readouts
Reduced GFR acutely Efferent arteriole dilation Affects creatinine and eGFR endpoints
Anti-proteinuric Reduced intraglomerular pressure Confounds albumin-to-creatinine ratio data

For any experiment measuring renal or cardiovascular endpoints, these effects are not background noise, they are active variables. A researcher who introduces a GH secretagogue without first stabilizing ACE inhibitor dosing will be unable to separate peptide-driven changes from ongoing RAAS modulation.


Clinical Evidence Anchoring Lisinopril as the Control Agent

Understanding the evidentiary weight behind lisinopril matters when selecting it as a research control. Its role in ACE inhibitors and research peptides protocols, designing blood-pressure controls around lisinopril and growth-hormone secretagogues, is justified by decades of outcome data, not convention alone.

Post-MI data: In the GISSI-3 trial, nearly 19,400 acute myocardial infarction patients were randomized in a factorial design. Lisinopril-treated patients experienced roughly an 11% lower risk of death at six weeks compared with controls (6.4% versus 7.2%), establishing short-term ACE inhibition as a mortality-reducing intervention after cardiac events.

Heart failure dosing: A study in over 3,100 chronic heart-failure patients followed for a median of 46 months found that high-dose lisinopril produced a 12% risk reduction in the combined endpoint of all-cause mortality and hospitalization, and a 24% reduction in heart-failure hospitalizations specifically, compared with low-dose therapy. This supports titrating toward higher target doses when tolerated.

Renal protection: The VA NEPHRON trial enrolled 1,448 patients with type 2 diabetes, elevated urinary-albumin-to-creatinine ratios, and reduced eGFR (30-89.9 mL/min), randomizing them to lisinopril or placebo on a background of losartan. This underscores lisinopril's role in intensive renal-risk management.

Key point: Because lisinopril independently alters urinary albumin excretion and eGFR, any peptide experiment using renal endpoints must document lisinopril dose stability for at least four to six weeks before baseline measurements are taken.

For researchers exploring peptide fundamentals, the Peptides 101 for Research-Use Only Buyers guide provides useful structural and mechanistic context.

Clinical Evidence Anchoring Lisinopril as the Control Agent


GH Secretagogues, Fluid Balance, and Blood-Pressure Risk

Growth-hormone secretagogues, including ipamorelin, CJC-1295, and tesa, stimulate the pituitary to release growth hormone, which in turn elevates IGF-1. This GH-axis activation carries hemodynamic consequences that directly complicate blood-pressure research design.

The fluid-retention problem: GH promotes sodium and water retention through IGF-1-mediated renal tubular effects. In a subject already on lisinopril, which promotes natriuresis, the opposing forces can mask or amplify fluid shifts, making weight and edema measurements unreliable without careful protocol design.

Blood-pressure uncertainty: No identified human study has directly measured blood-pressure changes attributable to ipamorelin alone. That data gap is critical. Safety reviews in 2026 flag that GH-axis secretagogues can raise blood pressure through both fluid retention and sympathomimetic effects of elevated GH. Specific concern exists at stage 2 hypertension (systolic BP above 160 mmHg), where persistent elevation refractory to standard management is considered a serious adverse event warranting reconsideration of peptide use.

Practical monitoring thresholds:

  • Blood pressure should be checked at every injection-period review
  • Persistent systolic BP above 160 mmHg flags a serious adverse event
  • Patients with cardiovascular disease require cardiologist consultation before GH secretagogue exposure
  • Fluid retention should be tracked via daily weight and ankle circumference measurements

Researchers interested in the IPA Sermorelin stack research protocols will find these monitoring principles directly applicable. For peptide sourcing considerations, the best peptide supplier resource is worth reviewing alongside purity documentation.

GH Secretagogues, Fluid Balance, and Blood-Pressure Risk


Designing a Valid Research Protocol

Translating the above into a workable experimental framework requires sequencing interventions carefully. The core principle in ACE inhibitors and research peptides design, blood-pressure controls around lisinopril and growth-hormone secretagogues, is that the ACE inhibitor must be the stable foundation, not an active variable.

Recommended sequencing:

  1. Establish baseline hemodynamics, Record resting BP, eGFR, urinary albumin-to-creatinine ratio, and body weight before any intervention.
  2. Stabilize lisinopril dose, Allow four to six weeks at target dose with three consecutive BP readings within 10 mmHg of each other before proceeding.
  3. Document renal endpoints at steady state, Creatinine, eGFR, and urinary albumin reflect the lisinopril-stabilized baseline, not a moving target.
  4. Introduce the GH secretagogue, Begin ipamorelin, CJC-1295, or tesa at the lowest research dose.
  5. Monitor BP at every injection period, Flag any systolic reading above 160 mmHg as a protocol-defined serious event.
  6. Track fluid balance independently, Daily weight, edema scoring, and sodium intake logs separate peptide-driven fluid shifts from RAAS modulation.

Researchers studying mitochondrial or cytoprotective peptides alongside cardiovascular endpoints may also find the synergy of LL-37 and SS-31 research relevant, as SS-31 has distinct renal mitochondrial effects that interact with RAAS-modulated tissue. Similarly, SS-31 peptide benefits documentation provides useful comparative context when designing multi-peptide cardiovascular studies.

For researchers sourcing MOTS-c or related metabolic peptides alongside GH secretagogues, the MOTS-c peptide category offers additional product and mechanism information.


Conclusion

Designing rigorous blood-pressure controls in peptide research is not optional, it is the difference between interpretable data and noise. Lisinopril's well-characterized effects on RAAS, fluid balance, and renal endpoints make it a logical anchor for cardiovascular control arms, but only when its dose is stabilized before GH secretagogue introduction. Ipamorelin, CJC-1295, and tesa all carry real, if incompletely quantified, risks of fluid retention and blood-pressure elevation that can obscure experimental signals or create genuine safety events.

Actionable next steps for researchers in 2026:

  • Audit existing protocols to confirm lisinopril dose stability windows are documented before baseline renal measurements
  • Add systolic BP above 160 mmHg as a pre-specified serious adverse event criterion in any GH secretagogue study
  • Track fluid balance with daily weight logs, not just clinical BP readings
  • Consult cardiology input for any subject with pre-existing cardiovascular disease before GH-axis peptide exposure
  • Review purity certificates for all research peptides to ensure experimental variables are limited to pharmacology, not contaminant effects
https://www.puretestedpeptides.com/wp-content/uploads/2026/09/ace-inhibitors-and-research-peptides-designing-blood-pressure-controls-around-li.webp 1024 1536 https://www.puretestedpeptides.com/wp-content/uploads/2026/01/buy-peptides-online.jpg 2026-09-27 13:03:392026-09-27 13:03:39ACE Inhibitors and Research Peptides: Designing Blood-Pressure Controls Around Lisinopril and Growth-Hormone Secretagogues
Cholesterol and Research Peptides: Separating LDL, Triglyceride, and Non-HDL Effects in Metabolic Models

Cholesterol and Research Peptides: Separating LDL, Triglyceride, and Non-HDL Effects in Metabolic Models

September 27, 2026/0 Comments/in Uncategorized/by

Residual cardiovascular risk persists in roughly half of statin-treated patients, not because LDL-cholesterol remains uncontrolled, but because triglycerides, remnant cholesterol, and non-HDL-C continue to drive atherogenesis in the background. This gap is precisely where the science of cholesterol and research peptides: separating LDL, triglyceride, and non-HDL effects in metabolic models has become one of the most active areas of preclinical and translational investigation in 2026.

Understanding how specific peptide-like agents shift individual lipoprotein fractions, rather than the lipid panel as a whole, is essential for any researcher designing or interpreting metabolic studies involving GLP-class compounds, MOTS-c, 5-Amino-1MQ, tesofensine, or growth-hormone-related peptides.

Key Takeaways

  • LDL-C, triglycerides, and non-HDL-C are pharmacologically separable endpoints; different peptide classes move each fraction differently and to different magnitudes.
  • ANGPTL3-targeted agents reduce all three major atherogenic fractions, while apoC-III inhibitors primarily lower triglycerides and remnant cholesterol with minimal LDL-C effect.
  • Diet, fasting state, weight loss magnitude, and background statin exposure are major confounders that must be controlled when interpreting lipid panels in peptide research models.
  • The 2026 ACC/AHA guidelines set LDL-C goals of less than 70 mg/dL for high-risk subjects, providing a clinical threshold against which novel peptide-driven lipid changes should be benchmarked.
  • Non-HDL-C is a practical surrogate for total apoB-containing particle burden and should be reported alongside LDL-C in all metabolic peptide studies.

Why Lipoprotein Fractions Cannot Be Treated as One Endpoint

Why Lipoprotein Fractions Cannot Be Treated as One Endpoint

The standard lipid panel reports four numbers, but those numbers do not respond uniformly to peptide interventions. LDL-C reflects cholesterol carried in low-density particles. Triglycerides reflect the flux of very-low-density lipoprotein (VLDL) and chylomicron remnants. Non-HDL-C captures cholesterol in all atherogenic particles, LDL, VLDL, IDL, and remnants combined, making it a broader measure of apoB-containing burden.

Research into RNA interference (RNAi) and antisense platforms has quantified this separation precisely. ANGPTL3-targeted programs produce mean LDL-C reductions near 13%, while apoC-III-targeted programs show essentially neutral effects on LDL-C (mean difference approximately 0.6%) despite suppressing plasma triglycerides by up to 50%. A 2026 meta-analysis of siRNA dyslipidemia therapies reported a pooled non-HDL-C reduction of nearly 22% versus placebo, a composite result that masked dramatically different contributions from LDL versus triglyceride-rich fractions depending on the molecular target.

For researchers working with polypeptide peptides in cardiometabolic models, this distinction is not academic, it determines which endpoint is the most meaningful readout for a given compound class.

The practical implication: always pre-specify which fraction is the primary endpoint before running a metabolic peptide study. Reporting only total cholesterol or only LDL-C will obscure the mechanism of action.


How GLP-Class, MOTS-c, and Metabolic Peptides Shift Lipid Fractions

How GLP-Class, MOTS-c, and Metabolic Peptides Shift Lipid Fractions

Different peptide classes interact with lipid metabolism through distinct mechanisms, and those mechanisms predict which fraction will move most.

GLP-Class Compounds

GLP-1 receptor agonists and newer dual/triple agonists (including retatrutide and GLP-3 variants) reduce hepatic VLDL secretion and accelerate triglyceride clearance. In metabolic models, the dominant lipid signal is a triglyceride reduction of 15-30%, with modest non-HDL-C improvements that are partly attributable to weight loss rather than direct receptor signaling. LDL-C changes are typically small and sometimes paradoxically increase in early phases due to enhanced lipolysis of VLDL particles. Researchers can explore the mechanistic basis of these differences through the Peptides 101 overview of GLP-3 and related structures.

MOTS-c and Mitochondrial Peptides

MOTS-c is a mitochondria-derived peptide that activates AMPK signaling, improving fatty acid oxidation and reducing ectopic lipid accumulation. In animal models, MOTS-c primarily lowers triglycerides and VLDL-C by enhancing skeletal muscle lipid uptake. Non-HDL-C improvements follow but are secondary. LDL-C is largely unaffected in short-duration studies.

5-Amino-1MQ and Tesofensine

5-Amino-1MQ inhibits NNMT (nicotinamide N-methyltransferase), shifting cellular metabolism toward fat oxidation. Tesofensine acts as a triple monoamine reuptake inhibitor with weight-loss-driven lipid effects. Both compounds primarily reduce triglycerides and non-HDL-C in proportion to visceral fat loss. Research on visceral fat and metabolic endpoints is directly relevant to interpreting these signals.

Growth Hormone-Related Peptides

Sermorelin, ipamorelin, and related secretagogues elevate GH pulsatility, which increases lipolysis and can transiently raise free fatty acids and LDL-C before improving the overall lipoprotein profile. Researchers using these compounds should note that early-timepoint lipid panels may show misleading LDL-C elevations. The IPA Sermorelin stack research overview covers relevant study design considerations.

“In peptide metabolic models, the direction of LDL-C change is often the least informative signal. Triglyceride and non-HDL-C trajectories carry more mechanistic weight.”

Practical Endpoint Guide: Controlling Confounders in Peptide Lipid Studies

Practical Endpoint Guide: Controlling Confounders in Peptide Lipid Studies

Accurate interpretation of cholesterol and research peptides, separating LDL, triglyceride, and non-HDL effects in metabolic models, requires systematic control of four major confounders.

1. Fasting State

Triglycerides are exquisitely sensitive to recent food intake. A non-fasting sample can inflate triglycerides by 30-50 mg/dL, masking a genuine peptide-driven reduction. All lipid panels in metabolic models should be collected after a minimum 10-hour fast. Non-HDL-C is more stable in non-fasting conditions but still benefits from standardized collection.

2. Weight Loss Magnitude

Weight loss itself, independent of any peptide mechanism, reduces triglycerides by approximately 1-2% per kilogram of body weight lost and modestly lowers LDL-C. In studies using GLP-class or tesofensine compounds where body weight changes significantly, researchers must use statistical adjustment or weight-matched controls to isolate the direct lipoprotein effect from the indirect weight-loss effect.

3. Background Statin Exposure

Statins suppress LDL-C by 30-55% depending on dose and agent. In subjects or animal models on background statin therapy, the LDL-C floor effect limits the measurable peptide contribution to LDL lowering. In these settings, non-HDL-C and apoB become the more sensitive endpoints because they capture triglyceride-rich particle changes that statins do not fully address.

4. Diet Composition

High-carbohydrate diets elevate VLDL secretion and triglycerides independently of peptide exposure. Standardizing macronutrient intake across study arms is essential. In rodent models, the choice between chow diet and high-fat diet dramatically changes the baseline lipoprotein profile and the magnitude of peptide-driven changes.

Peptide Class Primary Lipid Signal Key Confounder
GLP-class agonists Triglycerides, VLDL-C Weight loss magnitude
MOTS-c Triglycerides, non-HDL-C Diet carbohydrate load
5-Amino-1MQ Non-HDL-C, triglycerides Visceral fat change
Tesofensine Non-HDL-C, triglycerides Caloric restriction effect
GH secretagogues LDL-C (early, transient) Lipolysis timing

Researchers sourcing compounds for these study designs should ensure purity and batch consistency. Resources on research-grade peptide purity standards and wholesale peptide procurement are relevant starting points for laboratory procurement decisions.


Conclusion

Interpreting lipid panels in peptide metabolic research requires moving beyond the single-number mindset. Cholesterol and research peptides: separating LDL, triglyceride, and non-HDL effects in metabolic models is not a theoretical exercise, it is a prerequisite for generating data that translates meaningfully across study designs and species.

Actionable next steps for researchers:

  • Pre-specify LDL-C, triglycerides, and non-HDL-C as separate co-primary endpoints in study protocols.
  • Standardize fasting duration (minimum 10 hours) and diet composition across all arms.
  • Include weight-matched control groups when studying compounds with significant weight-loss activity.
  • Report apoB alongside non-HDL-C to capture total atherogenic particle burden.
  • Benchmark results against the 2026 ACC/AHA thresholds (LDL-C less than 70 mg/dL for high-risk models) to contextualize the clinical relevance of observed changes.

The field is moving rapidly. ANGPTL3 inhibitors, apoC-III-targeted siRNAs, and gene-editing constructs now demonstrate that all three major atherogenic fractions can be moved simultaneously, or selectively, depending on the molecular target. Peptide researchers who build this fractionation logic into their endpoint selection will generate far more interpretable and publishable data.

https://www.puretestedpeptides.com/wp-content/uploads/2026/09/cholesterol-and-research-peptides-separating-ldl-triglyceride-and-non-hdl-effect.webp 1024 1536 https://www.puretestedpeptides.com/wp-content/uploads/2026/01/buy-peptides-online.jpg 2026-09-27 13:03:312026-09-27 13:03:31Cholesterol and Research Peptides: Separating LDL, Triglyceride, and Non-HDL Effects in Metabolic Models
Page 10 of 81«‹89101112›»
×

Helpful Links

  • My account
  • Cart
  • Checkout
  • Refund and Returns Policy
  • Privacy Policy
  • SMS Privacy Policy
  • Login
  • My Account
  • Logout

USA Made Lab Tested Peptides

All products are sold for research, laboratory, or analytical purposes only, and are not for human consumption


Pure Tested Peptides is a chemical supplier. Pure Tested Peptides is not a compounding / chemical compounding facility as defined under 503A of the Federal Food, Drug, and Cosmetic act. Pure Tested Peptides is not an outsourcing facility as defined under 503B of the Federal Food, Drug, and Cosmetic act.

The statements made within this website have not been evaluated by the US Food and Drug Administration. The products we offer are not intended to diagnose, treat, cure or prevent any disease.

Human/Animal Consumption Prohibited. Laboratory/In-Vitro Experimental Use Only

Scroll to top Scroll to top Scroll to top