Call or Text 727-513-9780
  • Shopping Cart Shopping Cart
    0Shopping Cart
Pure Tested Peptides | America's most trusted Peptides for sale online
  • Peptides for sale
    • Oral Peptides for sale
      • Peptide Capsules for sale
      • BPC 157 Capsules 1000mcg
      • SLU-PP-332 Capsules | 1000 mcg
      • 5-Amino-1MQ 50mg Capsules
      • Tesofensine 500mcg
    • All Peptides for sale
    • Peptide Sprays
      • BPC 157 Nasal Spray Kit
      • BPC-157 TB500 Nasal Spray Kit
      • Semax Nasal Spray 10mg
      • Selank – Nasal Spray Kit – 10mg
      • Epithalon 50MG Nasal Spray Kit
      • Ipamorelin 10mg Nasal Spray
      • Klow Nasal Spray (BPC-157 + TB-500 + GHK-Cu + KPV) | 80mg
      • Hulk Nasal Spray Tesa / Ipa Blend 6/3 MG
      • Klow Nasal Spray
      • NAD + 500 mg Nasal Spray
      • PT-141 Nasal Spray Kit
    • GHRH Peptides
      • Ipa Peptides
      • CJC-1295 Peptides
        • CJC-1295 with DAC 5 mg
        • CJC-1295 without DAC 5 mg
        • CJC-1295 Ipa 10mg
      • Tesa Peptides
        • Tesa Peptide
        • Tesa 20 mg
    • GHK-Cu Peptides
      • All GHK-Cu Peptides
      • GHK-Cu 100mg
      • KLOW Peptide Blend – Buy KLOW blend online
    • BPC Peptides
      • All BPC Peptides
      • BPC-157
      • BPC-157 TB-500
      • BPC 157 capsules 1000mcg
    • SLU-PP-332 Peptides
      • All SLU-PP-332 Peptides
      • SLU-PP-332 5mg
    • GLP3 Peptides
    • PT-141 Peptides
      • PT-141 Peptides for sale
      • PT-141 10mg
      • PT-141 Nasal Spray
    • CAG Peptides
      • Lipo-C Peptide Blend
      • CAG 5mg
      • CAG 10mg
    • MOTS-C Peptides
      • MOTS-C Peptides for sale
      • MOTS-c peptide
      • MOTS-c 10mg *6 pack*
    • 5 Amino 1MQ Peptides
      • 5 Amino 1MQ Peptides for sale
      • 5-Amino-1MQ 50mg Capsules
      • 5-Amino-1MQ 5mg
    • Epithalon Peptides
      • Epithalon Peptides for sale
      • Epithalon 10mg
      • Epithalon 50mg
  • Shop
    • GLPs
      • 5-Amino-1MQ 50mg Capsules
      • 5-Amino-1MQ 5mg
      • L-Carnitine 500mg/ml
      • Tesofensine 500mcg
      • SLU-PP-332 5mg
      • MOTS-c 10mg *6 pack*
    • Epithalon & BPC Peptides
      • Epithalon 10mg
      • Epithalon 50mg
      • BPC-157
      • BPC 157 capsules 1000mcg
      • BPC-157 TB-500
      • BPC-157 TB500 Nasal Spray Kit
      • BPC 157 Nasal Spray Kit
    • BPC TB-500 & NAD+ Peptides
      • NAD+ 500 mg
      • KLOW Peptide Blend – Buy KLOW blend online
      • GLOW Peptide Blend
      • TB 500 5mg
      • BPC 157 capsules 1000mcg – Supplement
      • BPC 157 Nasal Spray Kit
      • BPC-157
      • BPC-157 TB500 Nasal Spray Kit
      • BPC-157 TB-500
      • BPC 157 capsules 1000mcg
    • LL-37 Peptide
      • LL-37 10 mg
    • MOTS-C & Selank
      • MOTS-c peptide
      • Selank 10mg
    • GHK Peptides
      • GHK-Cu 100mg
      • GLOW Peptide Blend
      • KLOW Peptide Blend – Buy KLOW blend online
  • COAs
  • Wholesale
    • Wholesale Peptides for sale
  • PTP FAQ
  • Affiliates
    • Selank Peptide: Advanced Pharmacological Mechanisms Underlying Its Anxiolytic and Nootropic Effects in Research
      • 5-Amino-1MQ Peptide: Detailed Mechanisms of NNMT Inhibition and Its Impact on Cellular Metabolism Research
        • MOTS-C Peptide: Unraveling Its Role in Mitochondrial Dynamics and Energy Metabolism Research
          • Epithalon Peptide and Telomerase Regulation: Investigating Its Impact on Cellular Senescence and Lifespan Research Models
            • GLP2-T vs GLP2 Tirz Peptide: Understanding the Naming, Mechanistic Nuances, and Research Implications for Gut Health
      • Peptides and Polypeptides in Modern Pharmacology: What Research on Metoprolol, Prednisone, and Amlodipine Reveals
        • Polypeptide Peptides vs NSAIDs: What Naproxen and Diclofenac Teach Tissue-Repair Researchers About BPC‑157 and TB‑500
          • Peptides and Polypeptides in Endocrine Pharmacology: How GLP-1, GLP-2, and GLP-3 Retatrutide Differ From Classic Drugs Like Prednisone and Amlodipine
          • 5‑Amino‑1MQ Peptide and NNMT Inhibition: How It Compares With Statins Like Atorvastatin in Adipose and Lipid Metabolism Research
      • Enclomiphene, Estrogen Receptor Signaling, and Luteinizing Phase Biology: What Hormone Researchers Should Measure
        • Mesenchymal Stem Cells, BPC‑157, and GHK‑Cu: How Tissue Repair Peptides Compare With Classic NSAIDs Like Naproxen in Injury Models
          • Peptide Calculator Use Cases Beyond Growth Hormone: Working Through GLP‑3 Retatrutide, MOTS‑c, and BPC‑157 Research Dosing
        • Polypeptide Peptides in Endocrine and Metabolic Pharmacology: Lessons From Amlodipine, Prednisone, and Metoprolol
        • Peptides Calculator for Advanced Blends: Worked Examples for Tesamorelin, CJC‑1295, and Ipamorelin Stacks
          • Peptides and Polypeptides in Human Physiology: How Molecular Size Shapes Research Applications
            • Selank Peptide: Advanced Pharmacological Mechanisms Underlying Its Anxiolytic and Nootropic Effects in Research
          • 5-Amino-1MQ Peptide: Detailed Mechanisms of NNMT Inhibition and Its Impact on Cellular Metabolism Research
            • MOTS-C Peptide: Unraveling Its Role in Mitochondrial Dynamics and Energy Metabolism Research
              • Epithalon Peptide and Telomerase Regulation: Investigating Its Impact on Cellular Senescence and Lifespan Research Models
                • GLP2-T vs GLP2 Tirz Peptide: Understanding the Naming, Mechanistic Nuances, and Research Implications for Gut Health
                  • Peptides and Polypeptides in Endocrine Pharmacology: How GLP-1, GLP-2, and GLP-3 Retatrutide Differ From Classic Drugs Like Prednisone and Amlodipine
                    • Polypeptide Peptides vs NSAIDs: What Naproxen and Diclofenac Teach Tissue-Repair Researchers About BPC‑157 and TB‑500
                      • Peptides and Polypeptides in Modern Pharmacology: What Research on Metoprolol, Prednisone, and Amlodipine Reveals
                        • 5‑Amino‑1MQ Peptide and NNMT Inhibition: How It Compares With Statins Like Atorvastatin in Adipose and Lipid Metabolism Research
                        • Enclomiphene, Estrogen Receptor Signaling, and Luteinizing Phase Biology: What Hormone Researchers Should Measure
                        • Mesenchymal Stem Cells, BPC‑157, and GHK‑Cu: How Tissue Repair Peptides Compare With Classic NSAIDs Like Naproxen in Injury Models
                        • Peptide Calculator Use Cases Beyond Growth Hormone: Working Through GLP‑3 Retatrutide, MOTS‑c, and BPC‑157 Research Dosing
                        • Polypeptide Peptides in Endocrine and Metabolic Pharmacology: Lessons From Amlodipine, Prednisone, and Metoprolol
                        • Peptides Calculator for Advanced Blends: Worked Examples for Tesamorelin, CJC‑1295, and Ipamorelin Stacks
                        • Peptides and Polypeptides in Human Physiology: How Molecular Size Shapes Research Applications
                        • Selank Peptide: Advanced Pharmacological Mechanisms Underlying Its Anxiolytic and Nootropic Effects in Research
                        • MOTS-C Peptide: Unraveling Its Role in Mitochondrial Dynamics and Energy Metabolism Research
                        • Peptides and Polypeptides in Modern Pharmacology: What Research on Metoprolol, Prednisone, and Amlodipine Reveals
                        • Peptides and Polypeptides in Endocrine Pharmacology: How GLP-1, GLP-2, and GLP-3 Retatrutide Differ From Classic Drugs Like Prednisone and Amlodipine
                        • 5-Amino-1MQ Peptide: Detailed Mechanisms of NNMT Inhibition and Its Impact on Cellular Metabolism Research
                        • Mesenchymal Stem Cells, BPC‑157, and GHK‑Cu: How Tissue Repair Peptides Compare With Classic NSAIDs Like Naproxen in Injury Models
                        • Peptide Calculator Use Cases Beyond Growth Hormone: Working Through GLP‑3 Retatrutide, MOTS‑c, and BPC‑157 Research Dosing
                        • GLP2-T vs GLP2 Tirz Peptide: Understanding the Naming, Mechanistic Nuances, and Research Implications for Gut Health
                        • Polypeptide Peptides in Endocrine and Metabolic Pharmacology: Lessons From Amlodipine, Prednisone, and Metoprolol
                        • Polypeptide Peptides vs NSAIDs: What Naproxen and Diclofenac Teach Tissue-Repair Researchers About BPC‑157 and TB‑500
                        • Peptides and Polypeptides in Human Physiology: How Molecular Size Shapes Research Applications
                        • Peptides Calculator for Advanced Blends: Worked Examples for Tesamorelin, CJC‑1295, and Ipamorelin Stacks
                        • 5‑Amino‑1MQ Peptide and NNMT Inhibition: How It Compares With Statins Like Atorvastatin in Adipose and Lipid Metabolism Research
                        • Enclomiphene, Estrogen Receptor Signaling, and Luteinizing Phase Biology: What Hormone Researchers Should Measure
                        • Epithalon Peptide and Telomerase Regulation: Investigating Its Impact on Cellular Senescence and Lifespan Research Models
                        • Best research protocol Klow blend
                        • best time to take BPC-157
                        • best time to take DSIP (Delta Sleep Inducing Peptide)
                        • best time to take CJC-1295
                        • best time to take AOD-9604
                        • best time to take Follistatin 344
                        • best time to take Ipamorelin
                        • best time to take MK-677 (Ibutamoren)
                        • best time to take Ligandrol (LGD-4033) — research compound
                        • best time to take Ostarine (MK-2866) — research compound
                        • best time to take GHK-CU
                        • best time to take TB-500
                        • best time to take MOTS-c
                        • best time to take Semax
                        • best time to take RAD-140 (Testolone) — research compound
                        • best time to take Thymosin Alpha-1
                        • best time to take PEG-MGF
                        • Biolife Plasma, Octapharma Plasma, and Research Peptides: How Plasma Donation Labs Differ From Peptide Suppliers
                        • best time to take YK-11 — research compound
                        • best time to take PT-141 (Bremelanotide)
                        • Best research protocol Klow blend
                        • 5-Amino-1MQ and MOTS-C Synergy: Metabolic Signaling, Mitochondria, and Research Design
                        • BPC-157 and TB-500: Investigating Their Combined Effects on Angiogenesis and Cellular Migration in Tissue Repair Models
                        • BPC-157 Peptide: Gut Barrier Function, Inflammation, and Tissue-Recovery Research
                        • 5‑Amino‑1MQ and MOTS‑c Synergy in Metabolic Research: Designing NNMT and Mitochondrial Biogenesis Stacks
                        • CJC-1295 with DAC vs. Without DAC: Half-Life, Release Kinetics, and Research Implications
                        • CJC‑1295 with DAC vs. Without DAC: Expanding on Half‑Life Differences Using Tesamorelin and Ipamorelin Blend Case Studies
                        • Collagen Biology and Copper‑Binding Peptides: How GHK‑Cu, Glow Blend, and Klow Blend Interact with Skin and Connective Tissue
                        • Collagen Biology and Regenerative Peptides: How GHK‑Cu, Glow Blend, and Klow Blend Affect Extracellular Matrix Research
                    • DNA, Telomeres, and Longevity Peptides: Positioning Epithalon and MOTS‑c in Genetic Aging Research
                      • Enclomiphene Citrate: serm Mechanism, Testosterone Research, and Stack Compatibility
                        • Enclomiphene vs Enclomiphene Citrate: Formulation, Bioavailability, and Research Distinctions
                        • Epithalon Peptide Research: Telomerase Activation, Aging, and Pineal Gland Function
                        • Estrogen Receptor Signaling and Enclomiphene: How Selective Modulators Compare with Classic Polypeptide Hormones
                        • GHK-Cu Peptide: Advanced Mechanisms in Extracellular Matrix Remodeling and Wound Healing Research
                        • GHK-Cu Peptide: Collagen Synthesis, Wound Repair, and Skin-Barrier Research Models
                        • GLP-1 vs GLP-3 vs GLP-2: Peptide Classification and Research Applications
                        • GLP-2 Peptide Research Guide: Gut Barrier Function, Nutrient Absorption, and Intestinal Recovery Models
                        • GLP-3 Retatrutide vs. GLP-1 Drugs: What Triple-Agonist Biology Changes in Research Models
                        • Ipamorelin and Tesamorelin Combination: Synergistic GH Secretagogue Research and Dosing Protocols
                        • GLP2 Tirz Peptide: What It Is, Why the Name Exists, and How Researchers Should Interpret It
                        • Klow Blend Peptide Nasal Spray: What the Formulation Is Trying to Do in Cognitive Research
                        • Mitochondria, NNMT Inhibition, and Peptide Modulators: Where MOTS‑c and 5‑Amino‑1MQ Fit in Cellular Energy Research
                        • MOTS-c Peptide: Mitochondrial Function, Energy Metabolism, and What Researchers Measure
                        • MOTS-c vs. 5-Amino-1MQ: Which Metabolic Research Questions Each Compound Actually Answers
                        • Nasal Spray Peptides: Bioavailability, Administration, and Semax/Selank Research Applications
                        • PT-141 Peptide Research: Mechanism of Action and Melanocortin Receptor Signaling
                        • Retatrutide for Research: Mechanism, Structure, and GLP-1/GLP-3 Dual Action
                        • Retatrutide for Obesity and Type 2 Diabetes: What the Latest Trial Data Suggest
                        • Tesofensine Peptide Research: Mechanism, Appetite Suppression, and Neuropeptide Y Pathways
  • Contact
    • Contact Customer Service
    • Text Customer Support
  • About US
  • Shop all peptides
  • Affiliate Program
    • Affiliate Signup
  • Login / Register Login / Register Page Link Login / Register Page Link
  • Click to open the search input field Click to open the search input field Search
  • Menu Menu
Retatrutide Phase 3 Results in 2026: What the New Obesity and Diabetes Data Changes for Research Protocols

Retatrutide Phase 3 Results in 2026: What the New Obesity and Diabetes Data Changes for Research Protocols

September 24, 2026/0 Comments/in Uncategorized/by

By August 2026, a key obesity Phase 3 study within the TRIUMPH program was officially marked as completed in clinical trial registries, a milestone that is already forcing researchers to rethink how they design, benchmark, and report nonclinical studies involving metabolic peptides. The Retatrutide Phase 3 Results in 2026: What the New Obesity and Diabetes Data Changes for Research Protocols conversation is no longer speculative. The data are in, and they are reshaping the field.

Key Takeaways

  • Retatrutide's TRIUMPH Phase 3 program has produced weight-loss outcomes of up to 30% at 104 weeks, approaching bariatric surgery benchmarks.
  • Dual efficacy on body weight and glycemic control (up to 1.9-point A1c reduction) makes single-endpoint trial designs increasingly inadequate.
  • Conservative titration schedules and improved retention strategies are now a protocol necessity, not an option.
  • Multi-indication Phase 3 data covering knee OA, OSA, MASLD, and cardiovascular outcomes are expanding the scope of required comparator arms.
  • Retatrutide remains investigational as of late 2026, meaning all research use is subject to regulatory-oriented trial design standards.

The TRIUMPH Program: A Phase 3 Snapshot That Changes Benchmarks

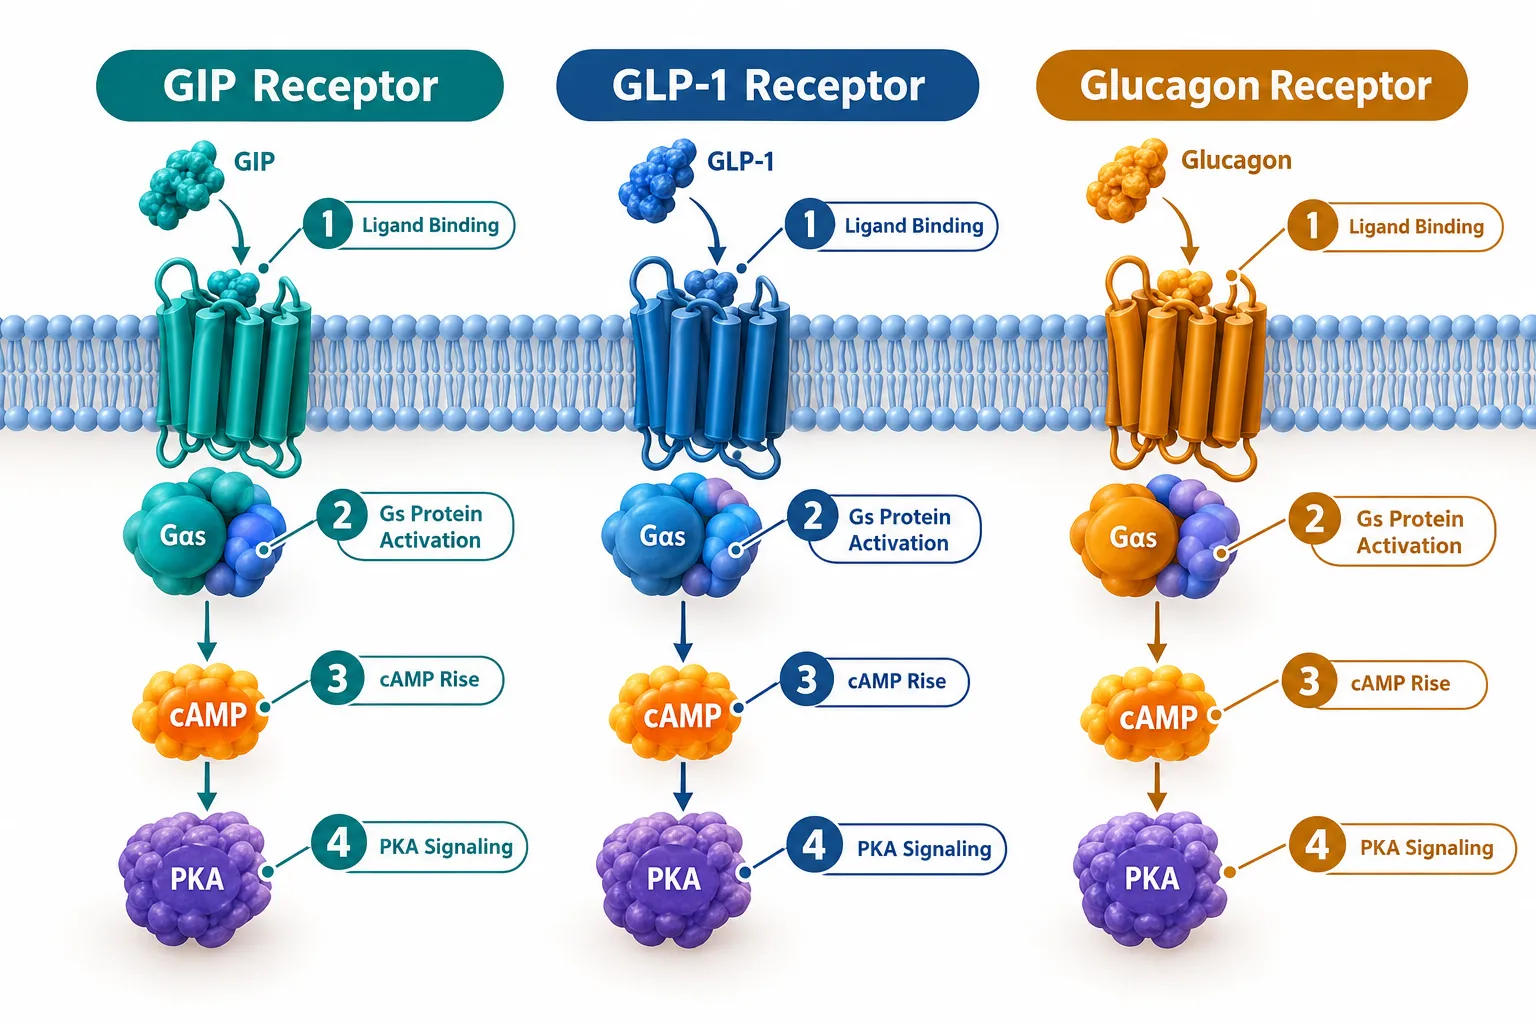
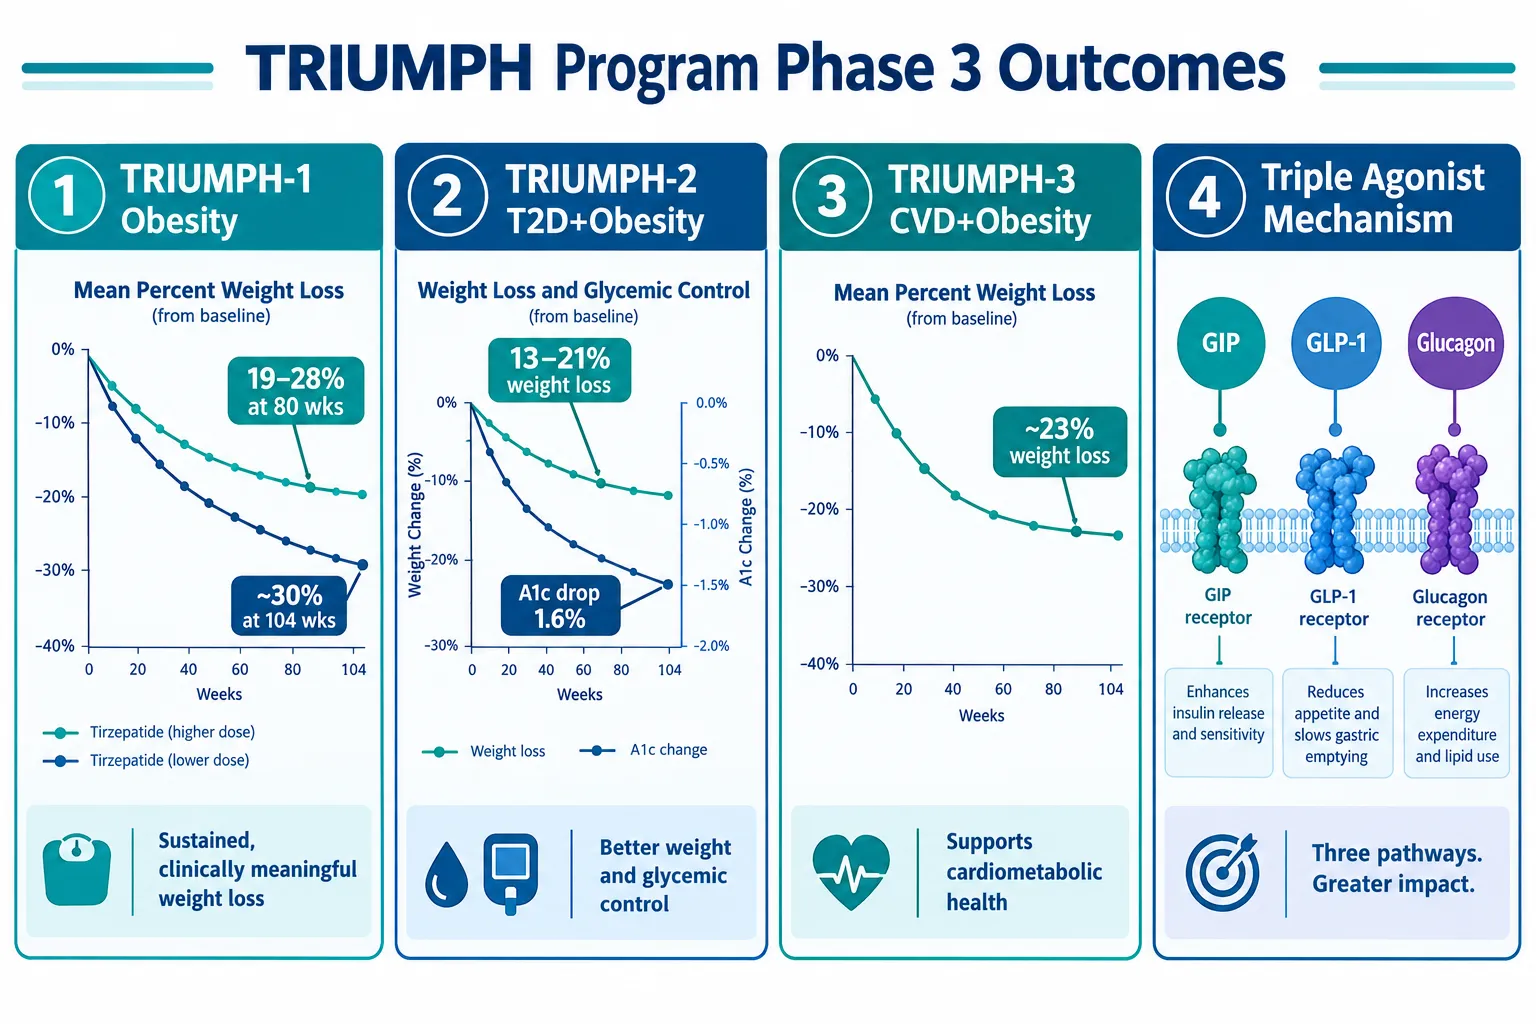
Retatrutide is a first-in-class triple agonist targeting GIP, GLP-1, and glucagon receptors simultaneously. That triple mechanism is what separates it from existing approved therapies and from earlier dual-agonist candidates. For researchers working with retatrutide clinical trial data, the TRIUMPH program now provides the most complete Phase 3 picture available for any triple agonist.
The TRIUMPH Program: A Phase 3 Snapshot That Changes Benchmarks

The headline numbers are striking:

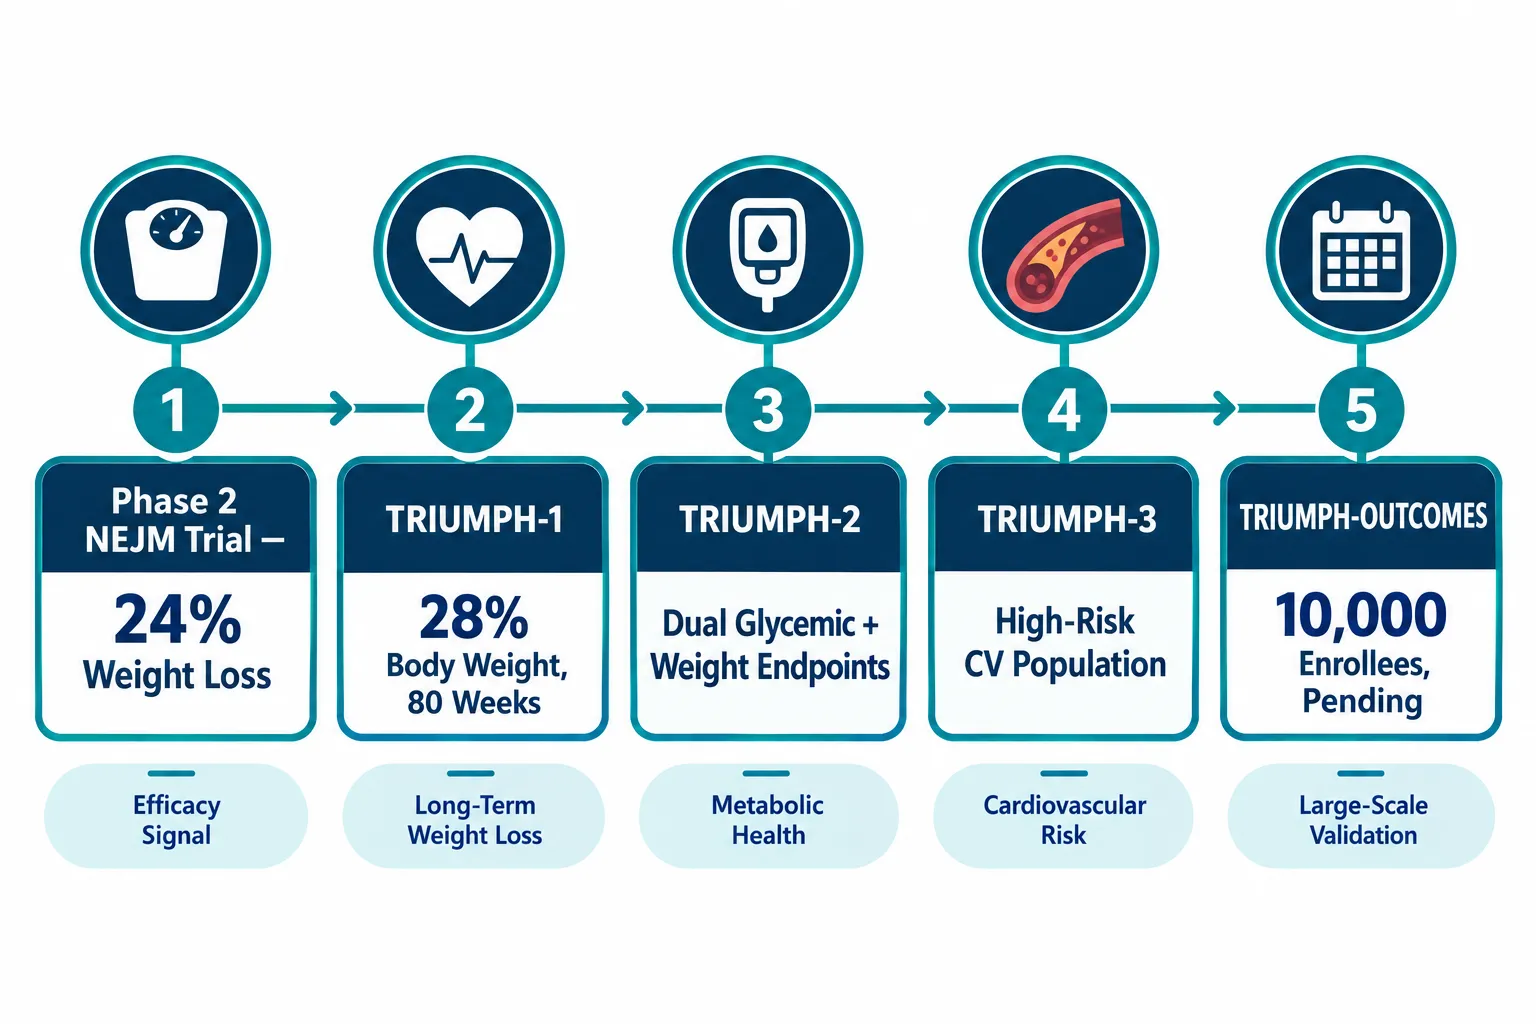
  • TRIUMPH-1 (obesity without diabetes): approximately 19-28% weight loss at 80 weeks, rising to roughly 30% at 104 weeks.
  • TRIUMPH-2 (obesity with type 2 diabetes): 13-21% weight loss plus up to a 1.6% A1c reduction over 80 weeks.
  • TRIUMPH-3 (severe obesity with established cardiovascular disease): approximately 23% weight loss with manageable discontinuation rates.

"Bariatric-like efficacy from a weekly injectable peptide is no longer a theoretical ceiling, TRIUMPH-3 data make it a documented outcome."

These figures introduce what some analysts are calling "de-obesification" endpoints, a term reflecting the normalization of BMI as a primary outcome rather than a secondary marker. For anyone reviewing GLP-1 Reta or GLP-3 Reta research-use compounds, understanding this endpoint shift is essential context.


How the 2026 Obesity and Diabetes Data Rewrites Protocol Design

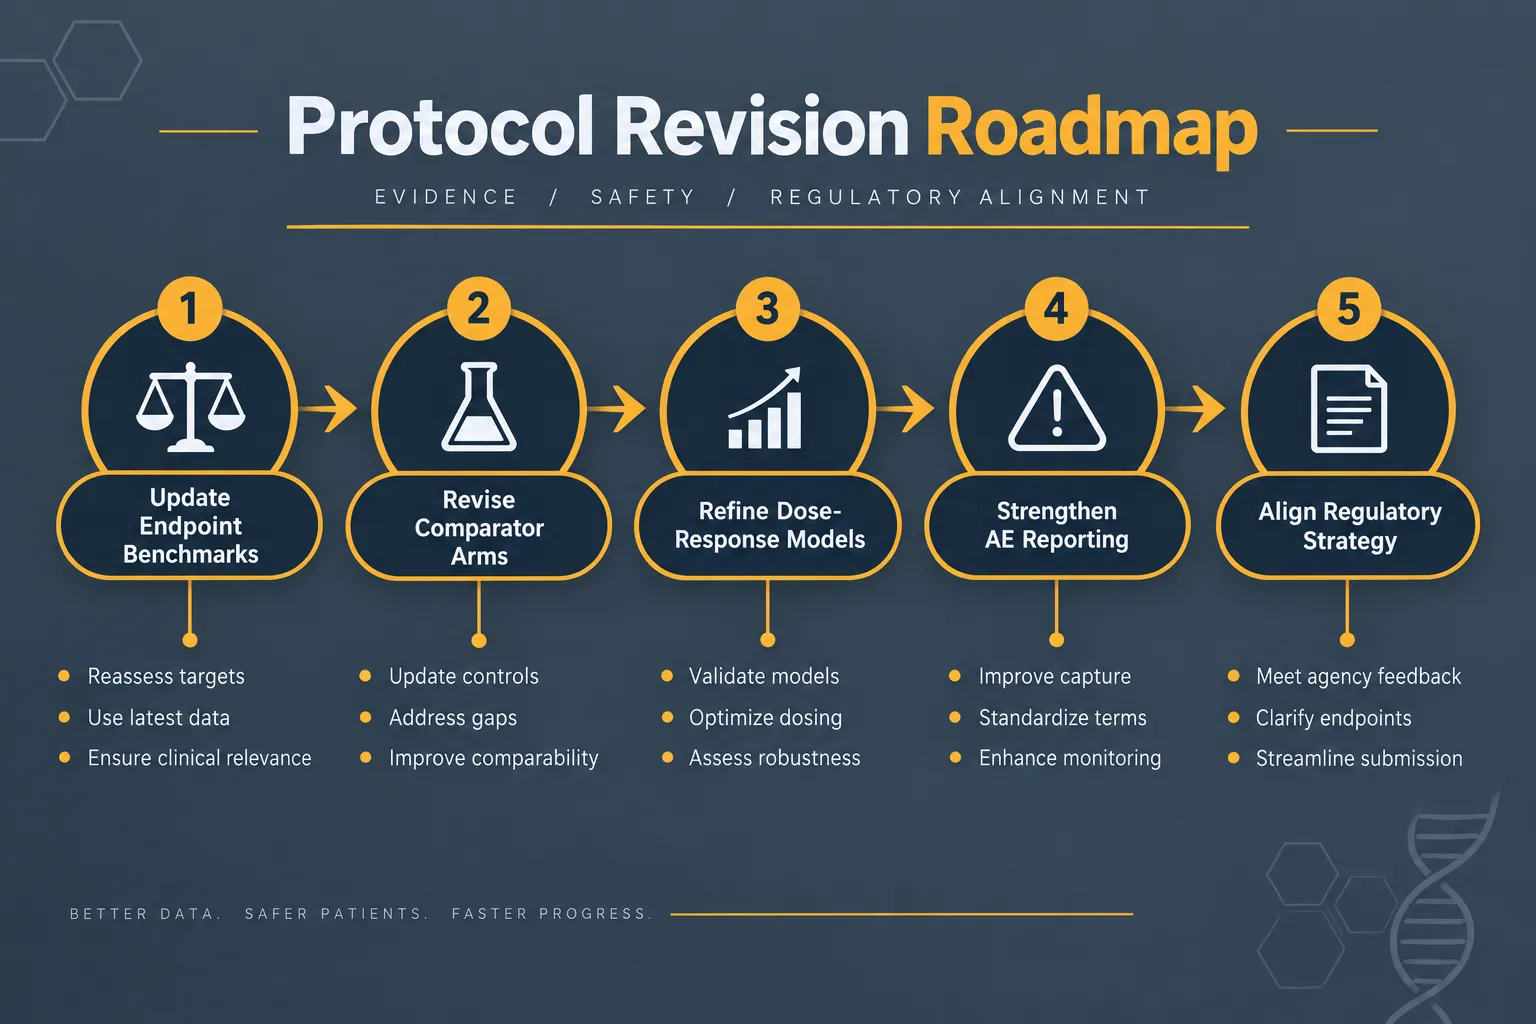
The Retatrutide Phase 3 Results in 2026: What the New Obesity and Diabetes Data Changes for Research Protocols discussion centers on four concrete areas where existing study designs are now outdated.

1. Endpoint Selection

Single-endpoint designs that measure only weight or only glycemic control are no longer sufficient when the reference compound achieves both simultaneously. Researchers should now plan co-primary endpoints that capture:

  • Percent total body weight loss
  • A1c reduction
  • Cardiometabolic markers (blood pressure, lipids, inflammatory markers)
  • BMI normalization rates

2. Comparator Arm Selection

TRIUMPH data push the efficacy bar to near-surgical levels. Using older GLP-1 monotherapies as the sole active comparator now risks underestimating effect size. Protocol designers should consider:

Comparator Type Relevance Post-TRIUMPH
Older GLP-1 monotherapy Insufficient ceiling for effect-size modeling
Dual agonist (e.g., tirzepatide) Appropriate active comparator
Bariatric surgery outcomes Now a legitimate benchmark arm
Placebo only Acceptable but limits translational value

For broader context on how peptide mechanisms interact with metabolic pathways, the Peptides 101 for Research-Use Only Buyers resource provides a useful structural overview.

3. Dose-Response Modeling
3. Dose-Response Modeling

TRIUMPH safety data revealed that aggressive titration schedules drove higher discontinuation rates. This finding is directly actionable for nonclinical protocol design. Dose-response models should now incorporate:

  • Extended low-dose phases before escalation
  • Plateau detection windows to identify responders before maximum dosing
  • Dropout probability curves built from TRIUMPH discontinuation patterns

Researchers using Reta 10mg formulations in nonclinical settings should map titration schedules against TRIUMPH's published escalation timelines to ensure their models remain translatable.

4. Adverse-Event Reporting Standards

The TRIUMPH program's safety profile, primarily gastrointestinal events, has established a new floor for what must be captured and reported. Nonclinical adverse-event frameworks should now include structured tracking for:

  • Nausea and vomiting incidence by dose level
  • Time-to-onset relative to titration step
  • Severity grading aligned with TRIUMPH's published criteria

Expanding Scope: Multi-Indication Data and What Comes Next

The Retatrutide Phase 3 Results in 2026: What the New Obesity and Diabetes Data Changes for Research Protocols story does not end with weight and glycemia. The TRIUMPH program includes at least seven additional Phase 3 datasets expected through 2026-2027, covering knee osteoarthritis, obstructive sleep apnea, metabolic-associated steatotic liver disease (MASLD), chronic pain, and cardiovascular-renal outcomes.

Expanding Scope: Multi-Indication Data and What Comes Next

This multi-indication expansion has two immediate implications for protocol designers:

  1. Organ-specific endpoints (liver stiffness scores, AHI reductions, joint function scales) will need to be incorporated into metabolic research designs that previously focused only on weight.
  2. Comparator arms will need to account for condition-specific active controls, not just metabolic benchmarks.

Researchers working in adjacent areas, such as mitochondrial function studies or growth hormone secretagogue research, should note that Tesamorelin data on visceral fat reduction may serve as a useful secondary comparator in MASLD-adjacent protocols.


Conclusion

The TRIUMPH Phase 3 program has fundamentally changed the reference frame for metabolic research protocols. Researchers who continue using pre-2026 endpoint structures, outdated comparator arms, or aggressive titration schedules will produce data that are difficult to interpret against the current evidence base.

Actionable next steps for protocol teams:

  1. Audit existing endpoint frameworks against TRIUMPH co-primary outcomes and add cardiometabolic markers where absent.
  2. Replace or supplement older GLP-1 monotherapy comparators with dual-agonist or bariatric-surgery benchmarks.
  3. Build conservative titration schedules into dose-response models and document dropout probability curves.
  4. Expand adverse-event capture to include time-to-onset data aligned with TRIUMPH's published safety criteria.
  5. Monitor the seven additional TRIUMPH Phase 3 readouts expected through 2027 and update protocols as each dataset publishes.

Retatrutide remains investigational as of late 2026. All research use must align with regulatory-oriented trial design standards. The data, however, are no longer a moving target, and protocol teams that adapt now will be best positioned when regulatory submissions begin.


https://www.puretestedpeptides.com/wp-content/uploads/2026/09/retatrutide-phase-3-results-in-2026-what-the-new-obesity-and-diabetes-data-chang.webp 1024 1536 https://www.puretestedpeptides.com/wp-content/uploads/2026/01/buy-peptides-online.jpg 2026-09-24 13:05:072026-09-24 13:05:07Retatrutide Phase 3 Results in 2026: What the New Obesity and Diabetes Data Changes for Research Protocols
Peptide Research Safety Monitoring: Hemoglobin, Hematocrit, Liver Enzymes, Glucose, and Blood-Pressure Readouts

Peptide Research Safety Monitoring: Hemoglobin, Hematocrit, Liver Enzymes, Glucose, and Blood-Pressure Readouts

September 24, 2026/0 Comments/in Uncategorized/by

{"cover":"Professional landscape format (1536×1024) hero image with bold text overlay 'Peptide Research Safety Monitoring' in crisp white sans-serif on a deep navy semi-transparent overlay panel, centered with 8% safe margins from every edge. Background: editorial close-up of a clinical laboratory setting showing glass vials of clear peptide solution, a digital blood pressure monitor, and printed lab reports with highlighted values for hemoglobin, liver enzymes, and glucose, clean, bright studio lighting with cool teal and navy color palette, magazine-cover polish, high contrast, no dark moody tones.","content":["Four-panel labelled infographic diagram (1536×1024) titled 'Core Safety Markers in Peptide Research' on a clean white background with teal-and-navy palette. Panel 1: illustrated red blood cell cluster labeled 'Hemoglobin g/dL' with callout 'Normal: 12-17 g/dL'. Panel 2: hematocrit percentage bar chart labeled 'Hematocrit %' with callout 'Watch >52% threshold'. Panel 3: liver enzyme vial labeled 'ALT / AST Units/L' with callout 'Stop rule: 3x ULN'. Panel 4: glucose meter labeled 'Fasting Glucose mg/dL' with callout 'HbA1c baseline flag'. Thin callout lines, short bullet labels 1-5 words each, editorial medical-guide style, bright studio lighting.","Annotated step-by-step numbered flow diagram (1536×1024) showing peptide research monitoring timeline on a pale blue background with charcoal typography. Step 1 card: 'Baseline Labs, Week 0' with icons for CBC and CMP. Step 2 card: 'Mid-Protocol Check, Week 4' with blood pressure cuff icon. Step 3 card: 'Post-Cycle Panel, Week 8' with liver enzyme flask icon. Step 4 card: 'Quarterly Follow-Up' with glucose meter icon. Each step connected by a bold arrow, short 2-5 word labels per card, callout lines pointing to specific marker names, clean infographic style, teal accent color, high editorial clarity.","Split-screen editorial comparison image (1536×1024): left half shows a warm-lit researcher's desk with a printed CBC report highlighting hemoglobin and hematocrit rows, a stethoscope, and handwritten stop-rule notes; right half shows a digital dashboard mockup displaying liver enzyme trend lines (ALT/AST), a fasting glucose graph, and a blood pressure reading widget in a modern dark-mode interface. Sharp dividing line down the center, short labels 'Wet Lab Markers' on left and 'Digital Monitoring Dashboard' on right, high-contrast magazine composition, cool blue and warm amber palette contrast, editorial quality."]

Professional landscape hero image () with a reading "Peptide Research Safety Monitoring". CRITICAL TYPOGRAPHY RULES: render

Fewer than 40% of researchers who work with bioactive peptides establish a formal lab-monitoring schedule before beginning a protocol, a gap that can turn subtle physiological shifts into serious, undetected problems. Rigorous peptide research safety monitoring: hemoglobin, hematocrit, liver enzymes, glucose, and blood-pressure readouts is not optional bookkeeping; it is the scientific backbone that separates responsible inquiry from guesswork. Whether the focus is tissue-repair peptides, growth-hormone secretagogues, or metabolic analogues, each compound class stresses different organ systems in different ways, and the lab panel must reflect that specificity.

Key Takeaways

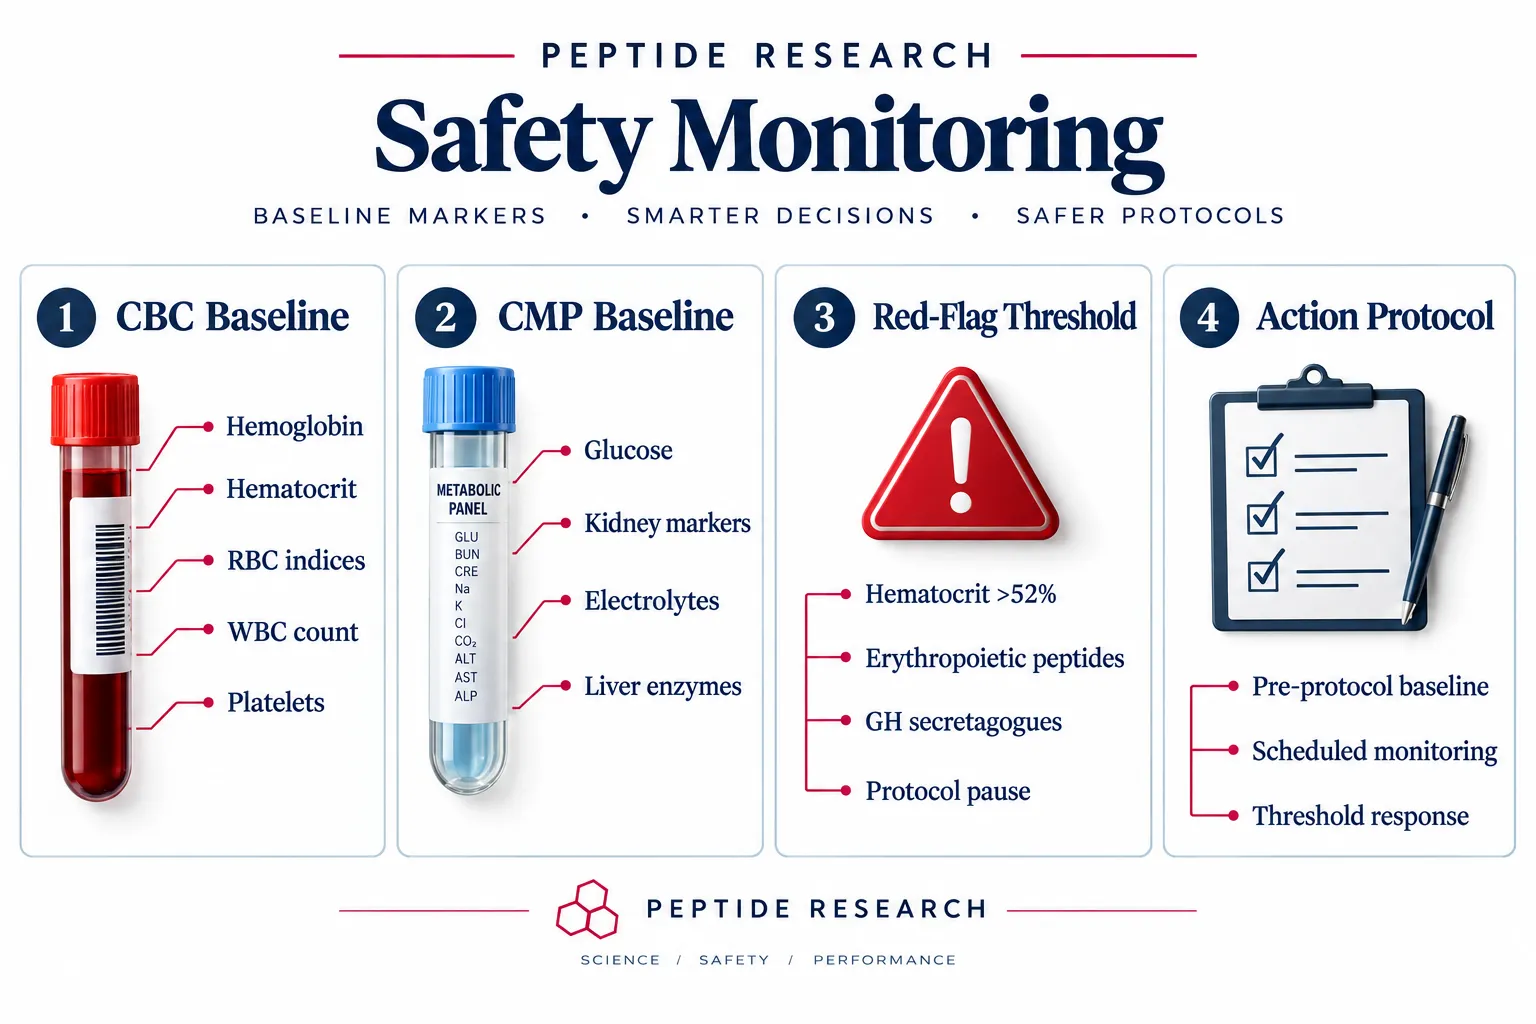
  • A baseline complete blood count (CBC) and comprehensive metabolic panel (CMP) should be established before any peptide protocol begins.
  • Hemoglobin and hematocrit are the primary red-flag markers for erythropoietic peptides and GH secretagogues; a hematocrit above 52% is a widely recognized pause threshold.
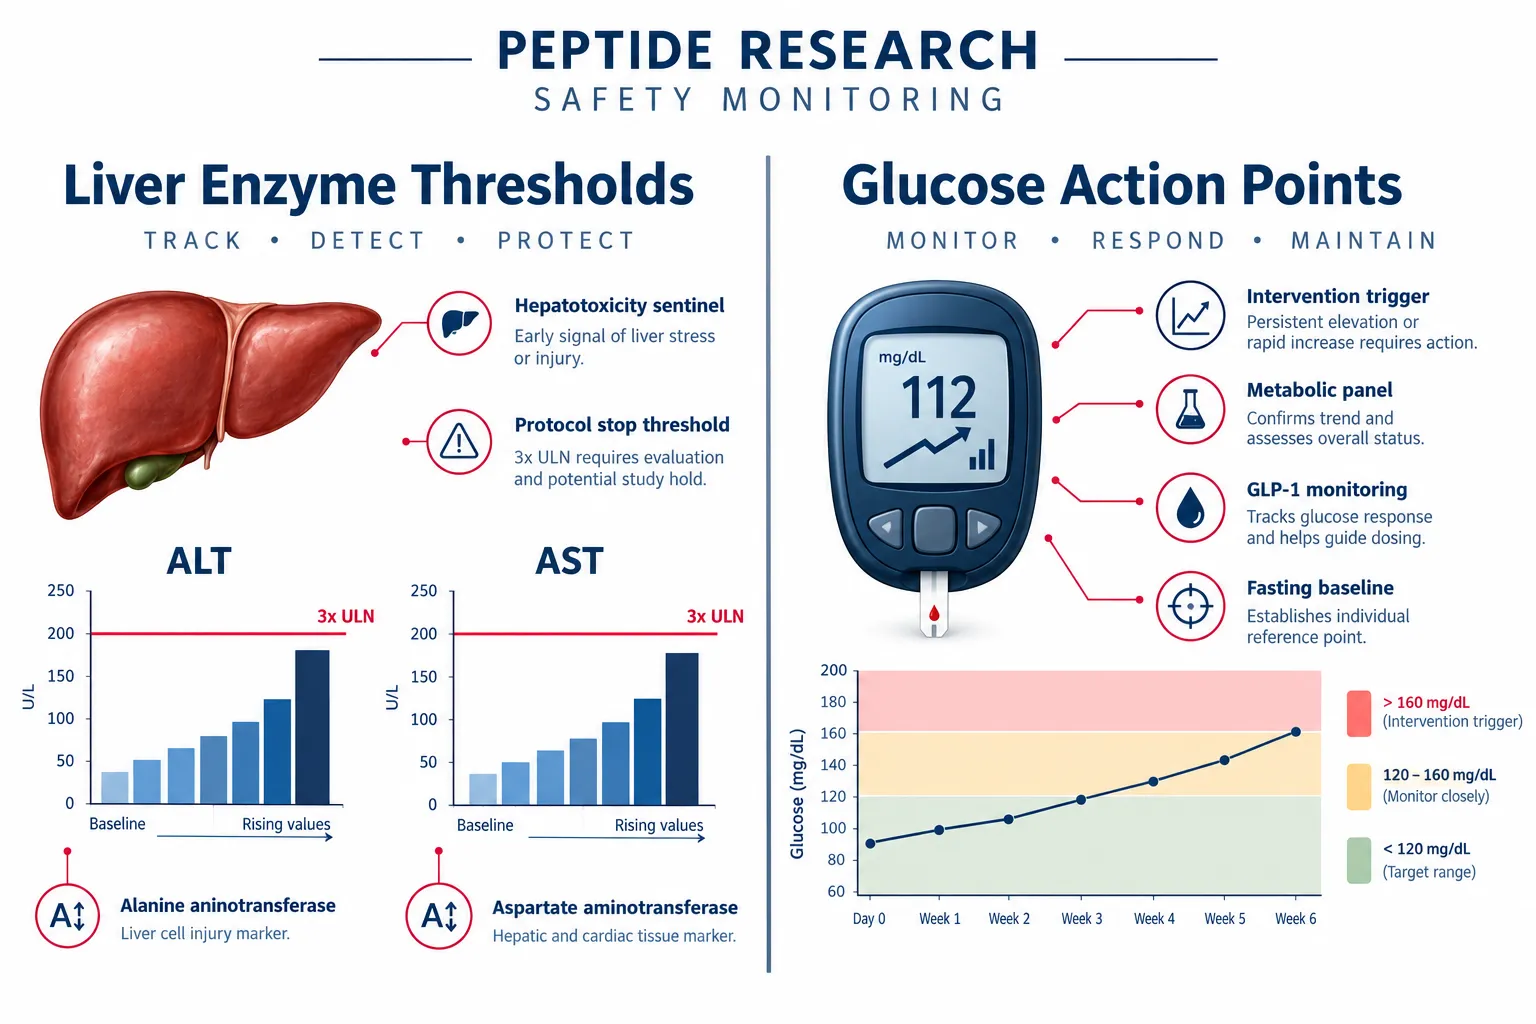
  • ALT and AST elevations above three times the upper limit of normal (3x ULN) represent a standard clinical stop rule for hepatotoxicity.
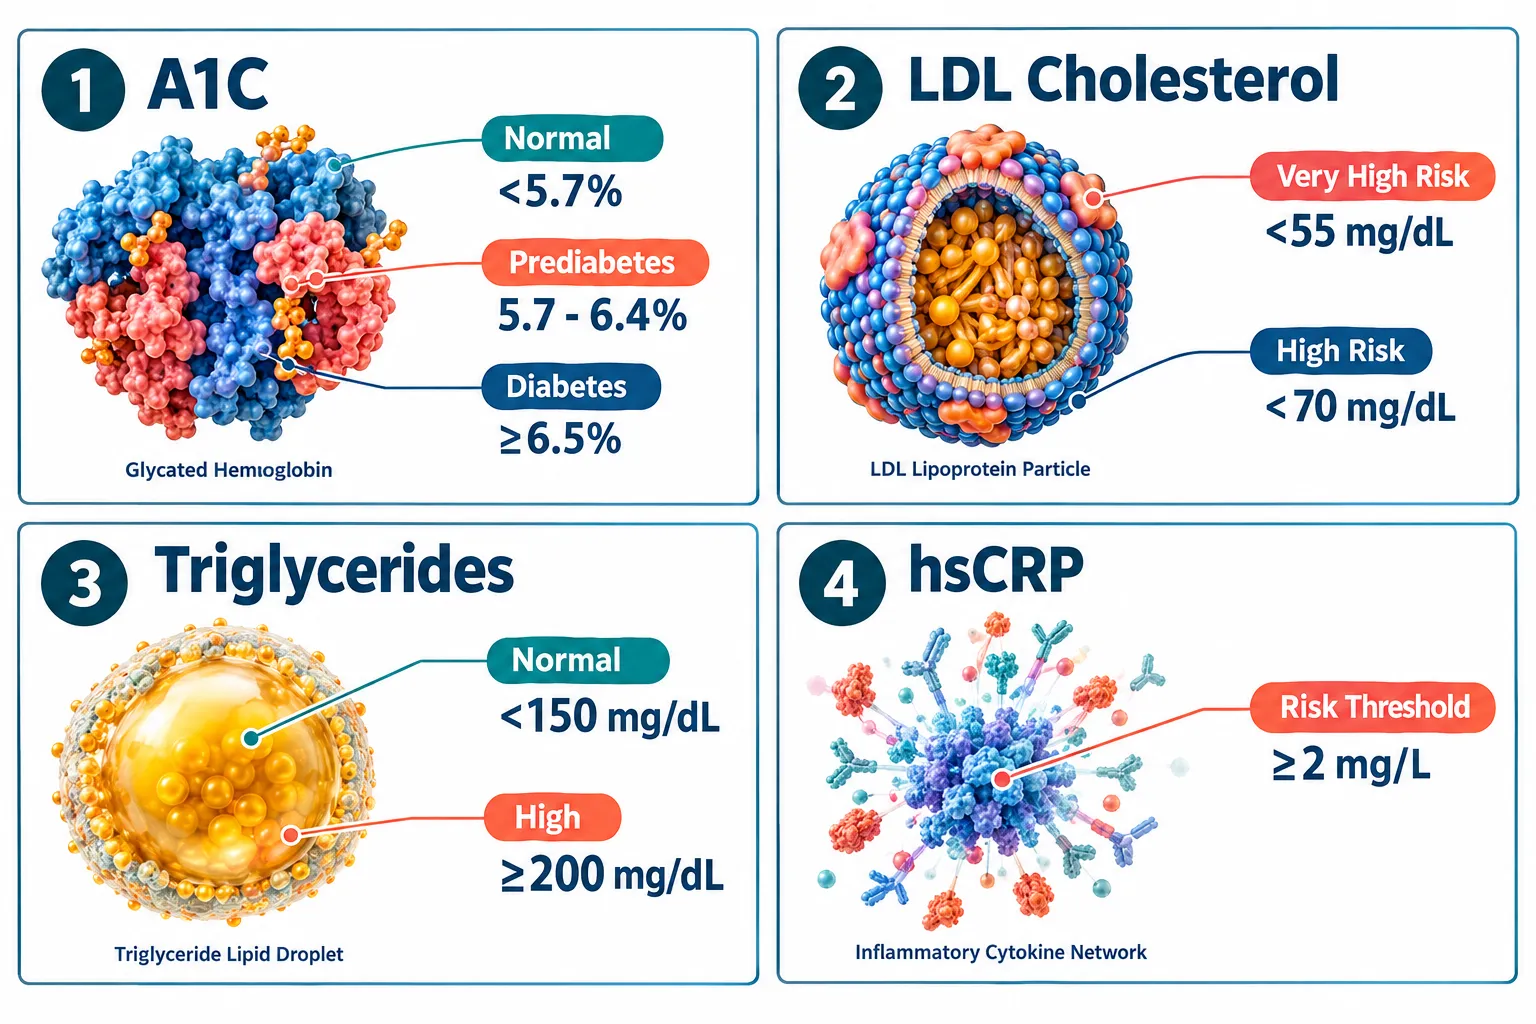
  • Fasting glucose and HbA1c are essential for GLP-1-class and metabolic peptides because baseline insulin resistance can confound interpretation.
  • Blood pressure must be tracked alongside hematocrit because rising red-cell mass directly increases cardiovascular load.

Understanding the Core Lab Panel for Peptide Safety Monitoring

Understanding the Core Lab Panel for Peptide Safety Monitoring

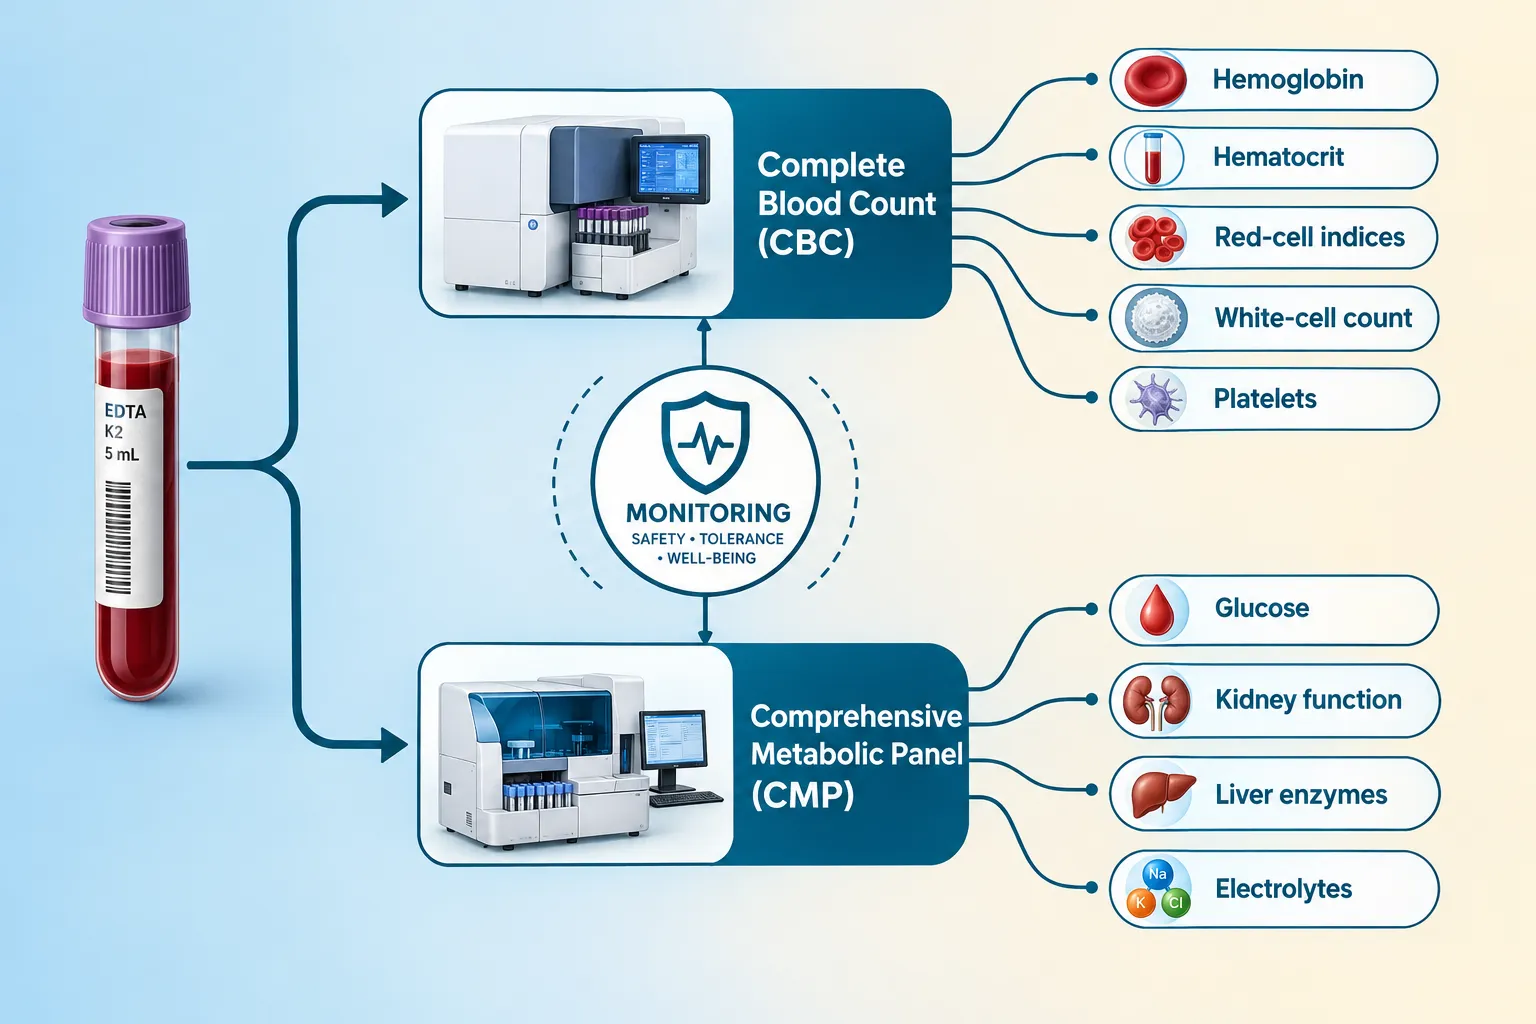
Every responsible monitoring program starts with two foundational tests: a complete blood count (CBC) and a comprehensive metabolic panel (CMP). The CBC captures hemoglobin, hematocrit, red-cell indices, white-cell count, and platelets. The CMP adds glucose, kidney function markers, and the liver enzymes ALT, AST, alkaline phosphatase, and bilirubin. Together, these two panels cover the most common adverse-effect pathways seen across peptide classes.

Hemoglobin measures the oxygen-carrying protein inside red blood cells, expressed in grams per deciliter (g/dL). Normal ranges sit roughly between 12 and 17 g/dL depending on biological sex. Hematocrit is the percentage of blood volume occupied by red cells, with a general healthy range of 36-50%. Growth-hormone secretagogues such as tesa and ipamorelin can stimulate IGF-1 production, which in turn promotes erythropoiesis. Elevated hematocrit thickens blood viscosity and raises clotting risk, which is why most clinicians treating research subjects apply a pause-and-reassess rule when hematocrit exceeds 52%.

Confounding factors matter here. Dehydration artificially inflates hematocrit. Chronic iron deficiency suppresses hemoglobin even when a peptide is actively stimulating red-cell production. Documenting hydration status and iron stores at baseline prevents misreading the data mid-protocol.

"A single out-of-range lab value means little without a baseline. Context is everything in peptide research safety monitoring."

For researchers comparing compounds, resources like the LL-37 versus SS-31 benefits of each peptide overview illustrate how two peptides in the same general category can have very different physiological footprints, reinforcing why class-specific monitoring matters.


Liver Enzymes and Glucose: Action Thresholds in Peptide Research Safety Monitoring

Liver Enzymes and Glucose: Action Thresholds in Peptide Research Safety Monitoring

Liver Enzyme Thresholds

ALT (alanine aminotransferase) and AST (aspartate aminotransferase) are the primary hepatotoxicity sentinels. The 3x ULN rule is the most widely applied stop threshold: if either enzyme rises above three times the laboratory's upper limit of normal, the protocol should pause and the subject should be reassessed. At 5x ULN, most clinical frameworks call for immediate discontinuation.

Several factors can inflate baseline liver enzymes independent of any peptide:

Confounding Factor Effect on ALT/AST
Non-alcoholic fatty liver disease Chronically elevated baseline
Intense resistance training Transient AST elevation (muscle origin)
Alcohol consumption Raises both ALT and AST
Statin medications Can elevate transaminases
Thyroid dysfunction Alters enzyme clearance rates

Because intense exercise raises AST from skeletal muscle, not the liver, researchers should note training intensity in the protocol log. If AST is elevated but ALT is normal and the AST/ALT ratio is above 2:1, muscle origin is the more likely explanation.

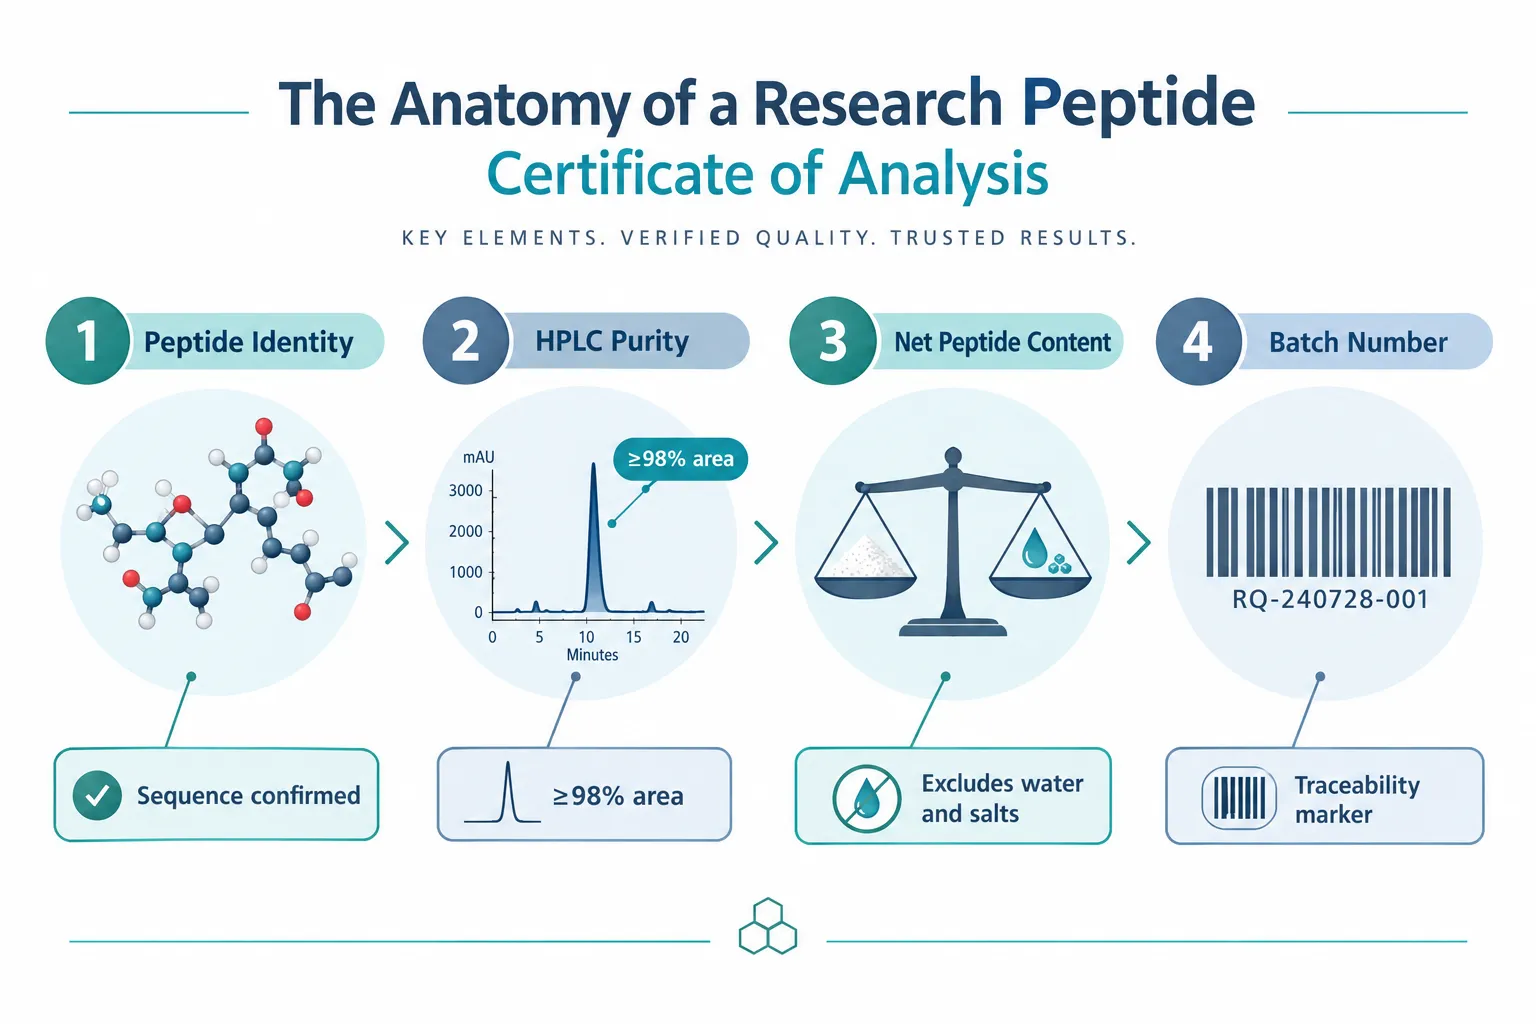
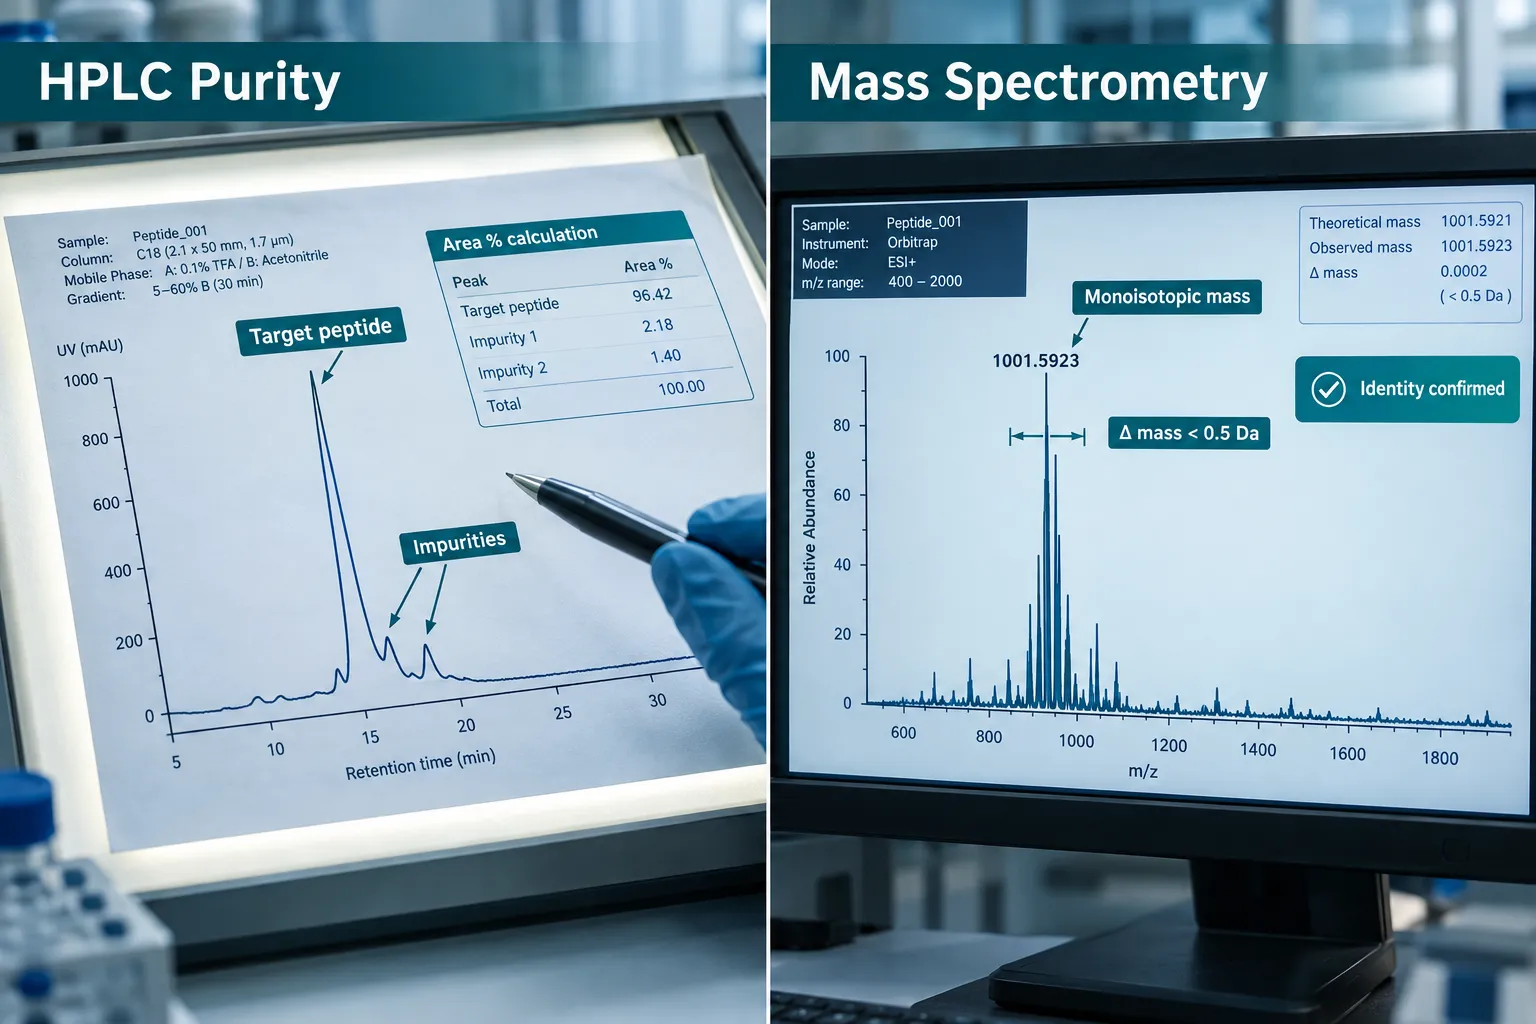
Tissue-repair peptides such as GHK-Cu and BPC-157 have limited formal hepatotoxicity data. Researchers sourcing these compounds should prioritize verified purity, as contaminants in poorly manufactured peptides are a more common cause of enzyme elevation than the peptide itself. Evaluating purity standards, as discussed in the where to buy research-grade Glow Blend peptide: evaluating purity resource, is a direct risk-reduction step.

Glucose and HbA1c Monitoring

Fasting glucose and glycated hemoglobin (HbA1c) are non-negotiable markers for any protocol involving metabolic peptides. GLP-1 receptor agonist analogues, including newer research compounds like those in the GLP-3 R peptide GA3 category, act on insulin secretion pathways. A subject with undiagnosed pre-diabetes will respond very differently than a metabolically healthy subject, making baseline HbA1c essential for accurate interpretation.

The practical monitoring cadence for glucose markers:

  1. Baseline, fasting glucose and HbA1c before protocol initiation
  2. Week 4, fasting glucose repeat, especially for GLP-1 or GH secretagogue protocols
  3. Week 8 or end of protocol, full CMP including glucose
  4. Quarterly, HbA1c if the protocol extends beyond 12 weeks

GH-stimulating peptides can cause transient insulin resistance by elevating free fatty acids. This effect is dose-dependent and typically resolves between doses, but it can push a borderline-glucose subject into a clinically significant range without obvious symptoms.


Blood Pressure, Cardiovascular Risk, and Differentiated Monitoring by Peptide Class

Blood Pressure, Cardiovascular Risk, and Differentiated Monitoring by Peptide Class

Blood pressure is the cardiovascular bridge between hematocrit and metabolic status. Elevated hematocrit increases blood viscosity, which raises peripheral vascular resistance and systolic pressure. Simultaneously, GLP-1-class peptides can modestly reduce blood pressure through natriuretic and vasodilatory mechanisms, a benefit that can become a risk if a subject is already on antihypertensive medication.

Recommended blood pressure monitoring schedule:

  • Baseline reading (seated, after 5 minutes of rest, both arms)
  • Every 2-4 weeks during active protocol
  • At each lab draw visit

A systolic reading consistently above 140 mmHg or a diastolic above 90 mmHg warrants protocol review, particularly when hematocrit is simultaneously trending upward. The two markers together create a compounding cardiovascular risk that neither alone fully captures.

Monitoring by Peptide Class

Different peptide classes stress different systems. The table below summarizes priority markers:

Peptide Class Priority Markers Monitoring Frequency
GH secretagogues (tesa, ipamorelin) Hematocrit, fasting glucose, IGF-1 Every 4-6 weeks
GLP-1 analogues Fasting glucose, HbA1c, blood pressure Every 4 weeks
Tissue-repair peptides (BPC-157, TB-500) ALT/AST, CBC Baseline and 8-week
Mitochondrial peptides (SS-31) CBC, CMP, blood pressure Baseline and 8-week

For researchers working with mitochondrial-targeted compounds, the SS-31 mechanism and research overview provides useful context on the physiological pathways that monitoring should address. Similarly, understanding the safety profile of combined protocols, such as reviewed in is it safe to combine tesa with CJC ipamorelin, directly informs which additional markers to add when stacking compounds.

Evidence gaps remain significant. BPC-157, TB-500, and GHK-Cu lack large randomized controlled trials in humans. Regulatory status for these compounds as research chemicals means that monitoring frameworks are built from preclinical data, case series, and emerging clinical consensus rather than approved prescribing guidelines. This makes diligent lab tracking more important, not less.


Conclusion

Effective peptide research safety monitoring: hemoglobin, hematocrit, liver enzymes, glucose, and blood-pressure readouts requires a structured, class-specific approach rather than a one-size-fits-all panel. The actionable next steps are clear:

  1. Establish a full baseline, CBC, CMP, fasting glucose, HbA1c, and a resting blood pressure reading, before any protocol begins.
  2. Apply recognized stop rules, hematocrit above 52%, liver enzymes above 3x ULN, or sustained blood pressure above 140/90 mmHg each warrant immediate protocol pause.
  3. Account for confounders, document training intensity, hydration, concurrent medications, and baseline metabolic health to avoid misreading data.
  4. Match monitoring frequency to compound class, GH secretagogues and GLP-1 analogues require more frequent glucose and cardiovascular checks than tissue-repair peptides.
  5. Source verified compounds, contaminant-driven enzyme elevations are preventable; working with suppliers who provide third-party purity testing is a direct safety measure.

As the research landscape in 2026 continues to evolve, risk-stratified monitoring protocols are becoming the emerging standard. Researchers who build these habits early will generate cleaner data, protect subject welfare, and contribute more credibly to the growing body of peptide science.

https://www.puretestedpeptides.com/wp-content/uploads/2026/09/peptide-research-safety-monitoring-hemoglobin-hematocrit-liver-enzymes-glucose-a.webp 1024 1536 https://www.puretestedpeptides.com/wp-content/uploads/2026/01/buy-peptides-online.jpg 2026-09-24 13:04:592026-09-24 13:04:59Peptide Research Safety Monitoring: Hemoglobin, Hematocrit, Liver Enzymes, Glucose, and Blood-Pressure Readouts
Retatrutide’s Triple-Agonist Data and Cardiometabolic Endpoints: Interpreting Weight, A1C, Lipids, Blood Pressure, and hsCRP Together

Retatrutide’s Triple-Agonist Data and Cardiometabolic Endpoints: Interpreting Weight, A1C, Lipids, Blood Pressure, and hsCRP Together

September 24, 2026/0 Comments/in Uncategorized/by

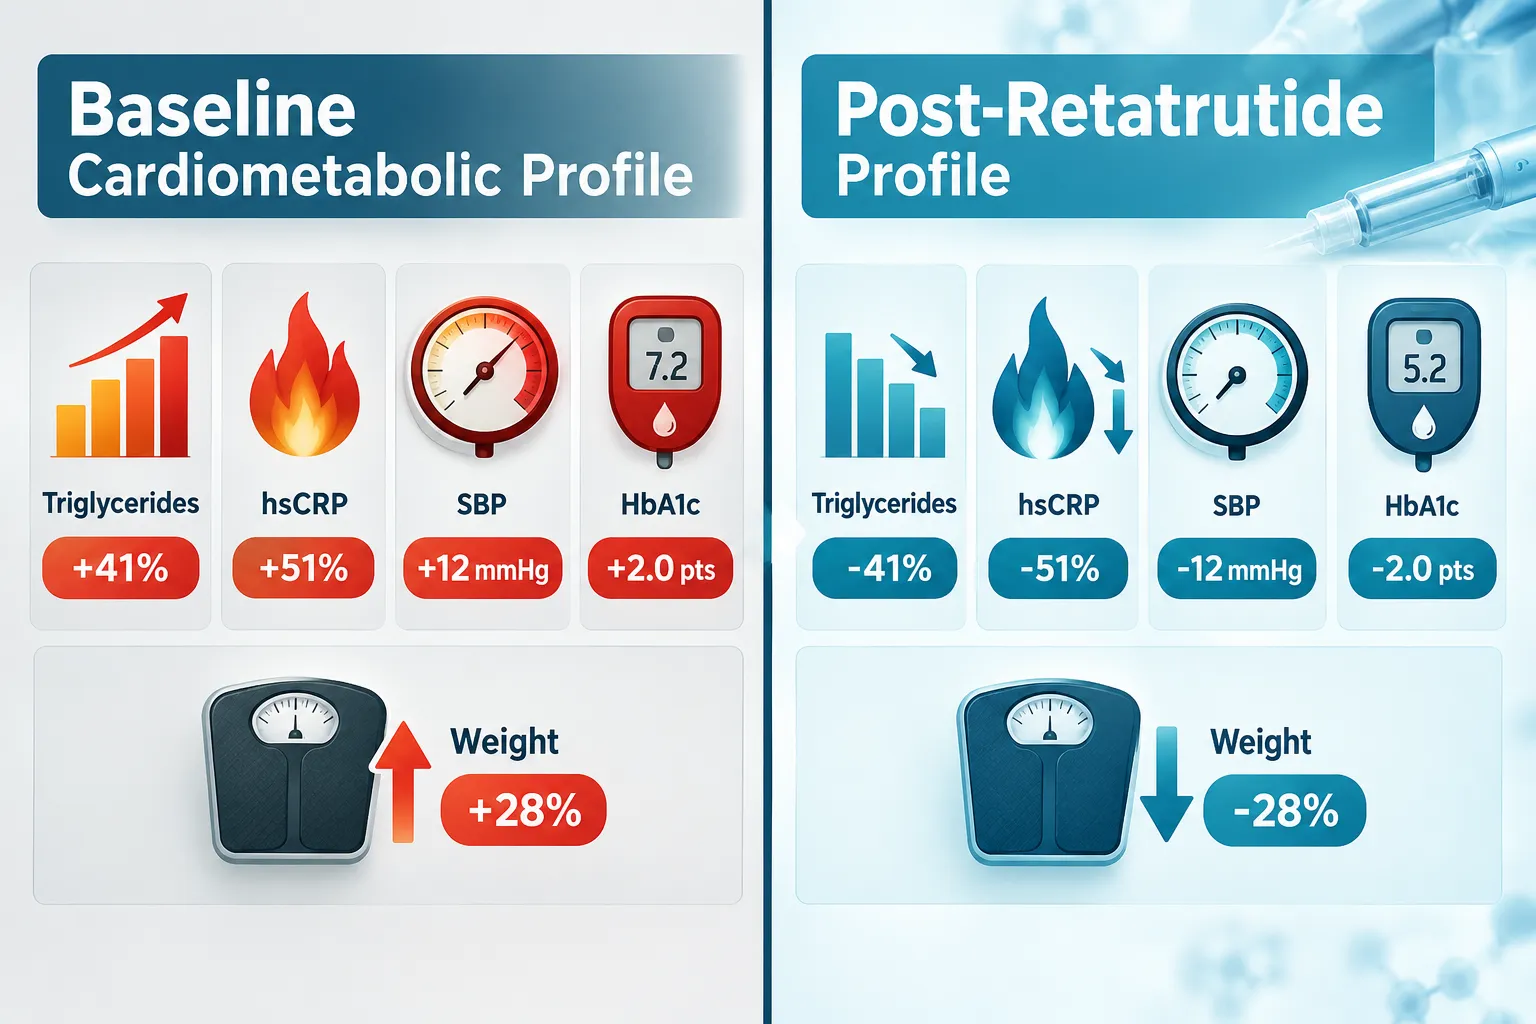
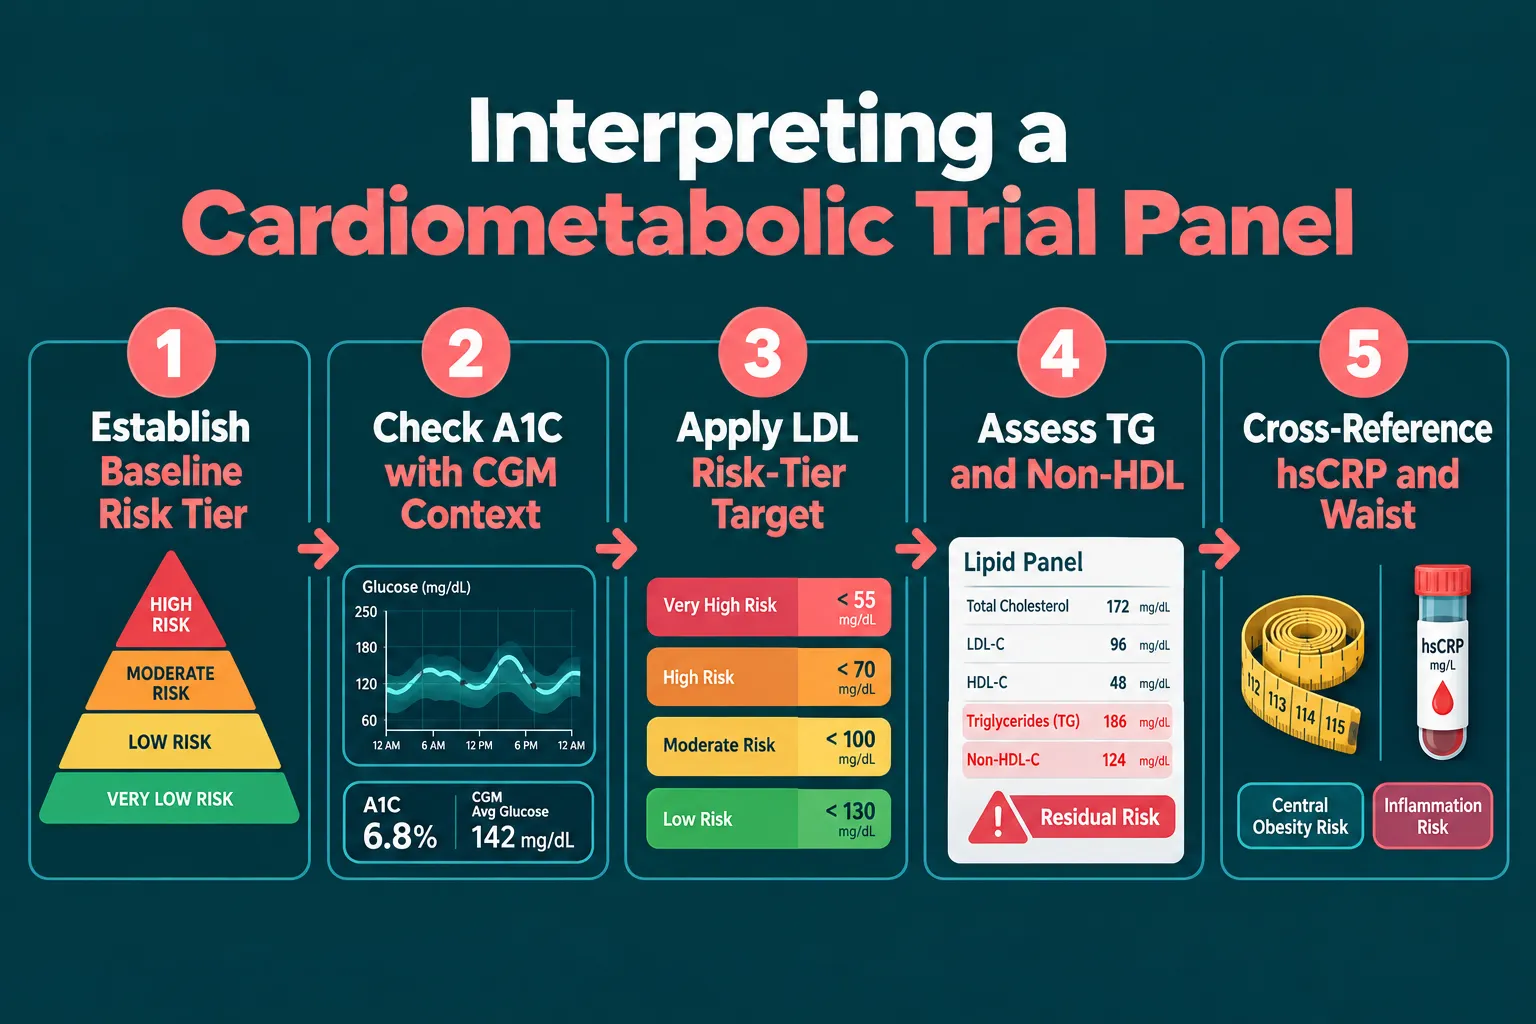
A single drug reducing body weight by nearly 28%, cutting triglycerides by 41%, lowering systolic blood pressure by more than 12 mmHg, and slashing an inflammatory marker by over 50%, all in the same trial, is not a routine clinical finding. That is the emerging picture from retatrutide's Phase 3 program, and it is reshaping how clinicians think about treating obesity-driven cardiometabolic disease. Understanding retatrutide's triple-agonist data and cardiometabolic endpoints means interpreting weight, A1C, lipids, blood pressure, and hsCRP together, not as separate outcomes, but as a coordinated metabolic signal.

Key Takeaways

  • Retatrutide simultaneously activates GLP-1, GIP, and glucagon receptors, producing weight loss that substantially exceeds typical GLP-1 monotherapy.
  • Phase 3 trials report concurrent improvements in triglycerides, non-HDL cholesterol, systolic blood pressure, HbA1c, and hsCRP, suggesting system-wide metabolic remodeling.
  • An hsCRP reduction of roughly 51% at higher doses points to meaningful attenuation of systemic inflammation, a key driver of residual cardiovascular risk.
  • Hard cardiovascular outcome data remain pending from the TRIUMPH-OUTCOMES trial; current cardiometabolic benefits are surrogate endpoints, not confirmed event reductions.
  • The favorable data profile applies specifically to the regulated investigational compound; off-label, unregulated use carries serious safety risks.

How Triple Agonism Drives Broad Cardiometabolic Effects

How Triple Agonism Drives Broad Cardiometabolic Effects

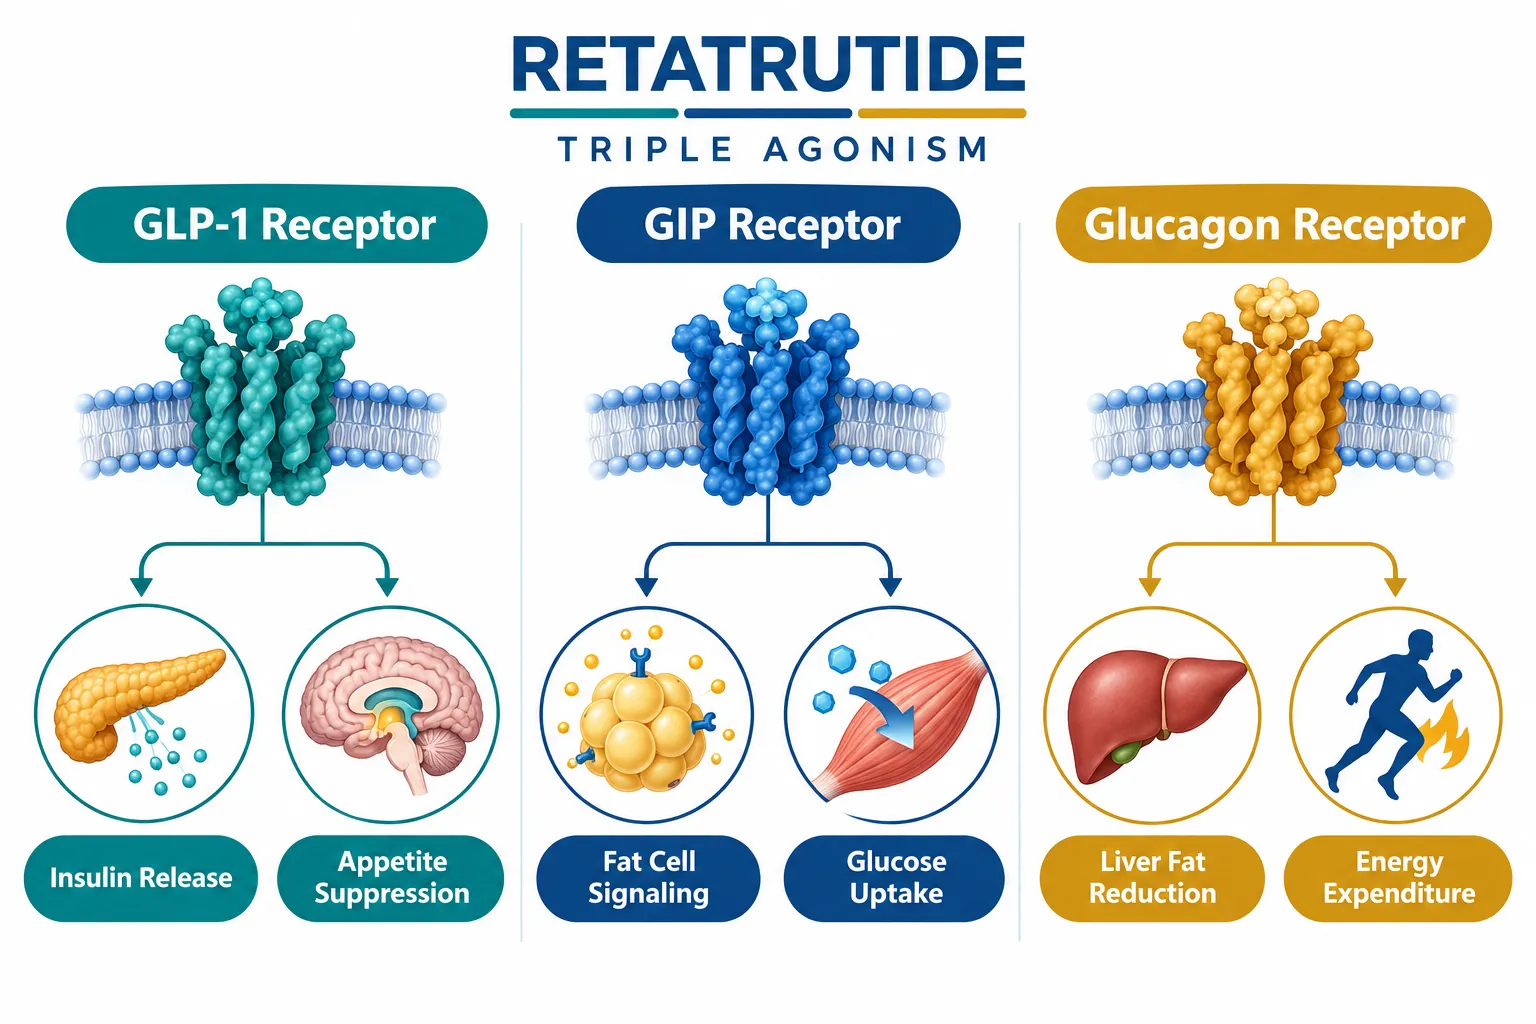
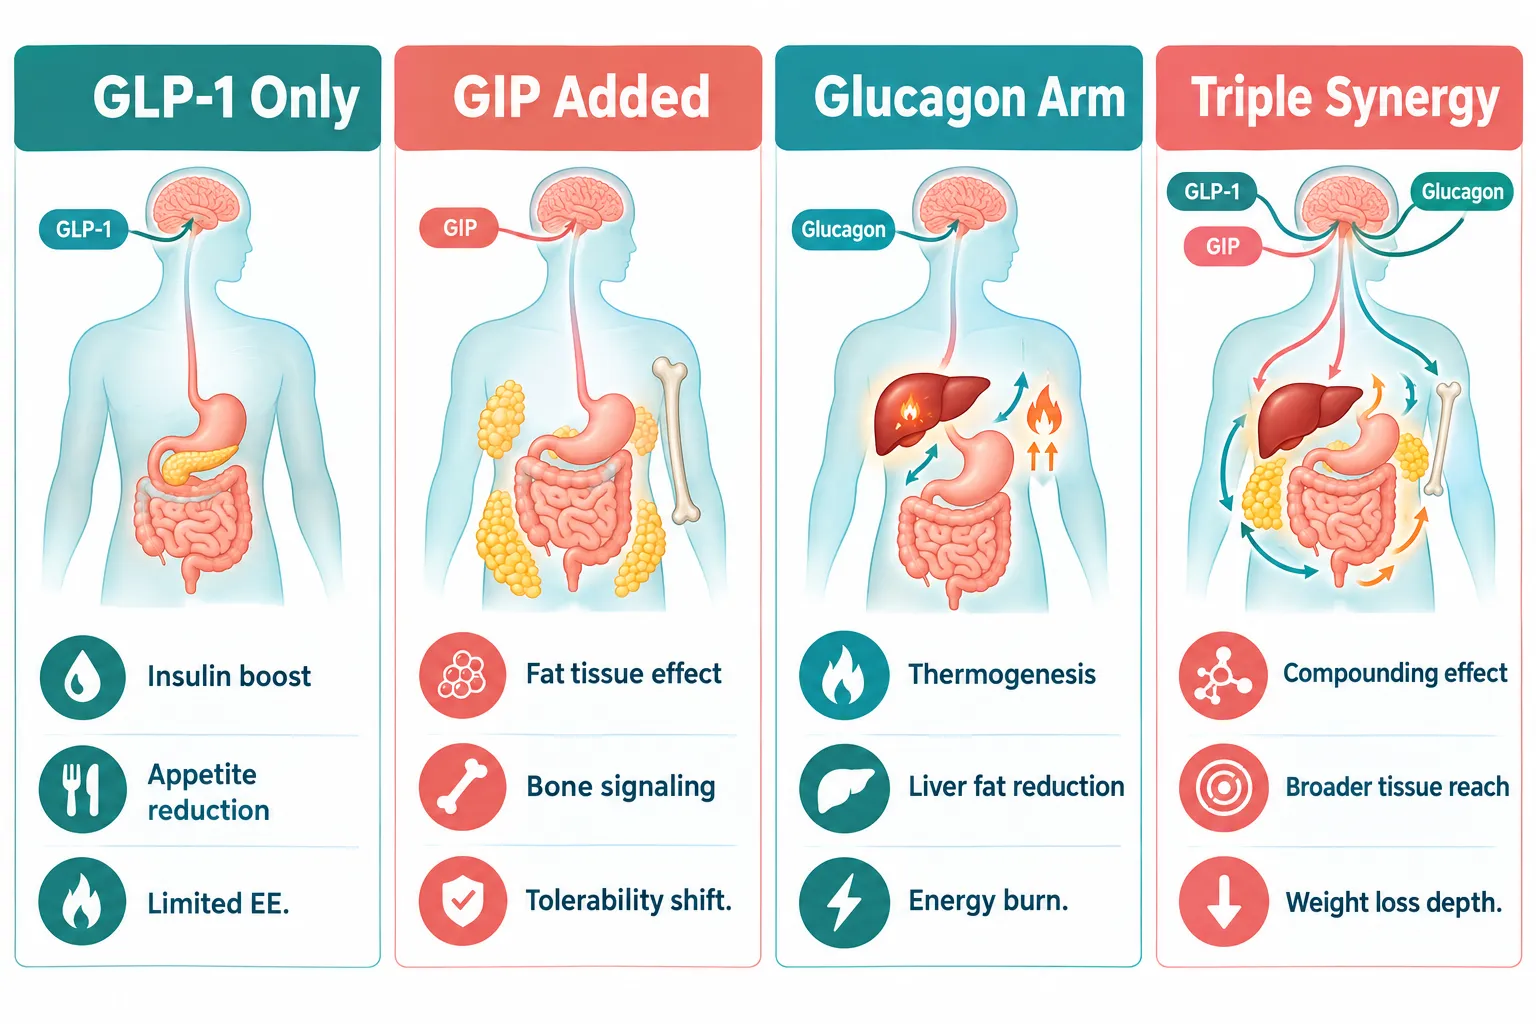
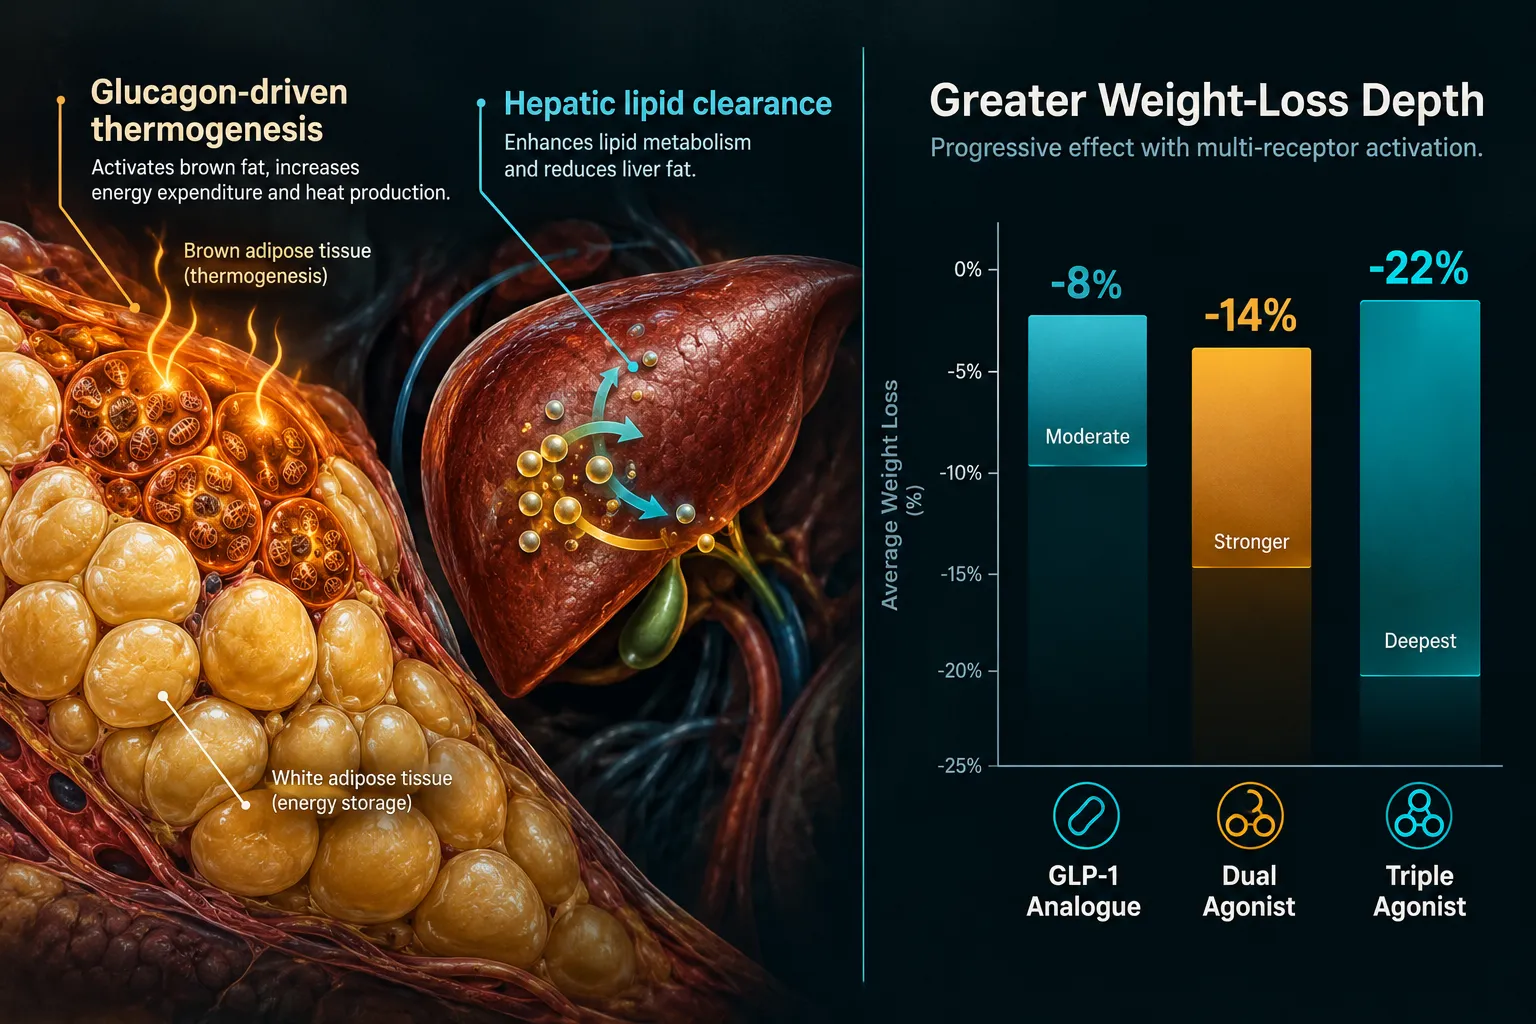
Retatrutide is a once-weekly injectable peptide that activates three hormone receptors at once: GLP-1 (glucagon-like peptide-1), GIP (glucose-dependent insulinotropic polypeptide), and glucagon receptors. Most incretin-based drugs target one or two of these pathways. Adding glucagon receptor agonism is the key differentiator, because glucagon signaling increases energy expenditure in the liver and adipose tissue, a thermogenic effect that stacks on top of the appetite suppression and insulin sensitization driven by GLP-1 and GIP.

For a broader comparison of how polypeptide agents like retatrutide differ mechanistically from classic small-molecule drugs, see this detailed breakdown of polypeptide peptides in cardiometabolic models.

This three-pathway activation explains why the cardiometabolic effects observed in trials are so broad. Weight loss alone does not fully account for the lipid, blood pressure, and inflammatory improvements seen, the receptors targeted by retatrutide are expressed in the liver, heart, vasculature, and adipose tissue, meaning the drug acts on multiple organ systems simultaneously.

Key receptor targets and their primary metabolic roles:

Receptor Primary Metabolic Role
GLP-1 Appetite suppression, insulin secretion, gastric emptying
GIP Fat cell signaling, glucose uptake, insulin potentiation
Glucagon Hepatic fat oxidation, energy expenditure, lipolysis

Interpreting the Phase 3 Trial Data: Weight, A1C, Lipids, Blood Pressure, and hsCRP Together

Interpreting the Phase 3 Trial Data: Weight, A1C, Lipids, Blood Pressure, and hsCRP Together

The most rigorous way to evaluate retatrutide's triple-agonist data and cardiometabolic endpoints is to read the Phase 3 results as a unified dataset rather than isolated numbers.

TRIUMPH-1: Obesity Without Diabetes

In TRIUMPH-1, participants without type 2 diabetes lost approximately 28% of body weight, roughly 70 lb, over 80 weeks. The cardiometabolic secondary endpoints were equally striking:

  • Triglycerides: reduced by up to 41.0%
  • Non-HDL cholesterol: reduced by 24.2%
  • Systolic blood pressure: reduced by 12.3 mmHg
  • Waist circumference: reduced by 24.1 cm

These are not modest shifts. A 41% triglyceride reduction and a 24% non-HDL reduction represent clinically meaningful movement in atherogenic lipid burden.

TRIUMPH-2 and TRANSCEND-T2D-1: Adding Glycemic Control

In TRIUMPH-2 (obesity with type 2 diabetes), participants lost up to 20.8% of body weight while lowering HbA1c by up to 1.6 percentage points. TRANSCEND-T2D-1 showed HbA1c reductions of up to 2.0 percentage points from a mean baseline of 7.9%, alongside improvements in triglycerides, non-HDL cholesterol, blood pressure, and waist circumference.

The critical insight here: retatrutide improved glycemia and adiposity without forcing a trade-off between glucose control and weight loss, a common limitation with older diabetes drugs.

TRIUMPH-3: High-Risk Cardiovascular Population and the hsCRP Signal

TRIUMPH-3 enrolled patients with severe obesity and established cardiovascular disease. At the 12 mg dose, results included:

  • Weight loss: approximately 22-23% (~55 lb) at 80 weeks
  • Triglycerides: reduced by 37.0%
  • Non-HDL cholesterol: reduced by 16.5%
  • Systolic blood pressure: reduced by 9.3 mmHg
  • Waist circumference: reduced by 19.0 cm
  • hsCRP: reduced by 51.2%

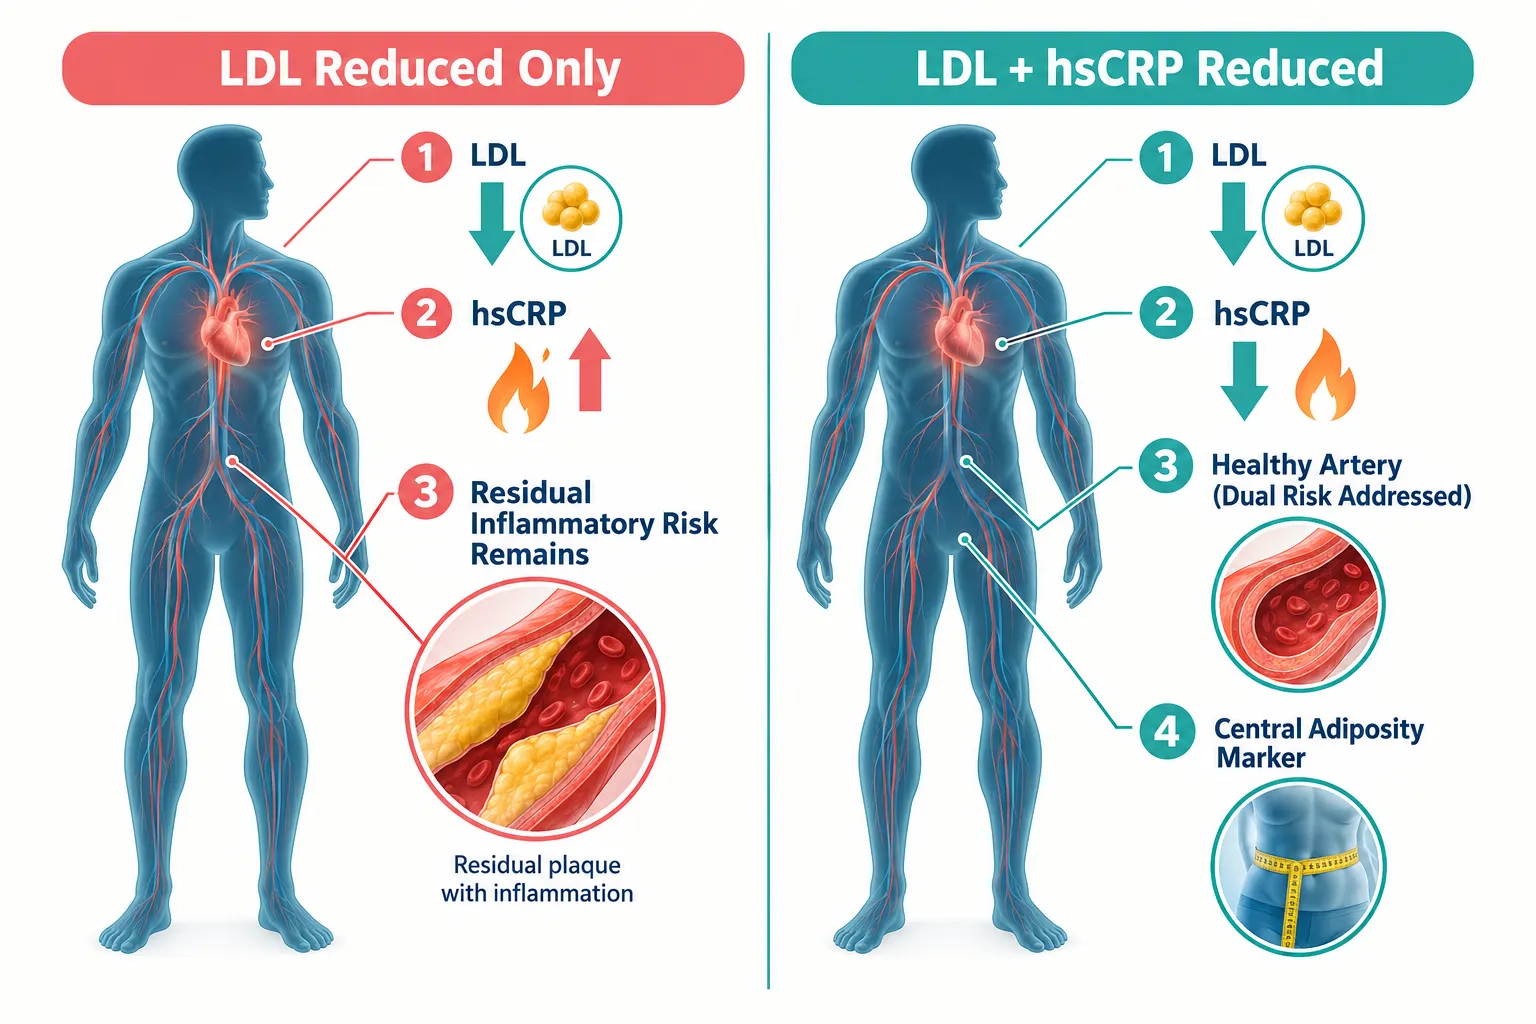
The hsCRP finding deserves special attention. High-sensitivity C-reactive protein is a validated marker of systemic inflammation and an independent predictor of cardiovascular events. A reduction of more than 50% in a high-risk population suggests retatrutide may be addressing inflammatory cardiovascular risk, not just metabolic risk factors. Whether this translates into fewer heart attacks and strokes remains an open question until TRIUMPH-OUTCOMES reports.


What the Data Does, and Does Not, Confirm

What the Data Does, and Does Not, Confirm

Interpreting retatrutide's triple-agonist data and cardiometabolic endpoints together requires a clear distinction between what the trials have proven and what they suggest.

What is established from company-reported clinical data:

  • Large, sustained weight loss across diverse populations
  • Concurrent improvements in atherogenic lipids, glycemic control, blood pressure, and inflammatory markers
  • A safety profile broadly consistent with other incretin-based therapies, with gastrointestinal side effects being the most common

What remains hypothetical:

  • Whether surrogate endpoint improvements will translate into reduced major adverse cardiovascular events (MACE)
  • Long-term durability of cardiometabolic benefits beyond 80 weeks
  • Whether outcomes will match those of bariatric surgery in long-term cardiovascular and microvascular endpoints

The TRIUMPH-OUTCOMES trial, enrolling approximately 10,000 individuals with atherosclerotic cardiovascular disease and/or chronic kidney disease, is designed to answer the MACE question directly. Until those results are available, the combined weight, A1C, lipid, blood pressure, and hsCRP improvements are powerful surrogate signals, not confirmed outcome data.

Eli Lilly has indicated plans to file for obesity approval in 2027, with development extending to sleep apnea, osteoarthritis, chronic low back pain, and metabolic liver disease, reflecting confidence in the breadth of the cardiometabolic profile.

A note on research-use compounds: Intense interest in retatrutide has generated gray-market products marketed under its name. Regulators have documented cases of acute liver toxicity and serious esophageal injury linked to counterfeit peptide use. The favorable cardiometabolic data described throughout this article applies exclusively to the regulated investigational compound used in controlled clinical trials. Those interested in research-grade materials should consult verified sources such as the GLP-3 Reta CAG 10mg product or review available Reta 20mg research options through properly tested suppliers. Additional research compound options are available under buy Reta peptide and GLP-3 Reta listings for laboratory use only.


Conclusion

Retatrutide's Phase 3 data present a coherent cardiometabolic story: weight loss of 20-28%, triglyceride reductions exceeding 37-41%, HbA1c improvements of up to 2 percentage points, systolic blood pressure reductions of 9-12 mmHg, and hsCRP reductions above 50%, all occurring together in the same patients. Reading these endpoints in isolation understates the drug's potential; reading them together reveals a compound that may address multiple drivers of cardiovascular disease simultaneously.

Actionable next steps for clinicians and researchers:

  1. Follow TRIUMPH-OUTCOMES enrollment and interim analyses for MACE data, this is the trial that will confirm or qualify the surrogate endpoint story.
  2. Treat the hsCRP signal as a hypothesis-generating finding, not a proven anti-inflammatory outcome, until mechanistic and outcomes data are available.
  3. Distinguish clearly between company-reported Phase 3 data and extrapolations applicable to research-use compounds, which operate under entirely different regulatory and safety frameworks.
  4. Monitor Eli Lilly's anticipated 2027 regulatory filing for the full label scope, which will clarify approved indications and patient selection criteria.

The convergence of weight, glycemic, lipid, blood pressure, and inflammatory improvements in a single agent is scientifically significant. The next step is confirming that these numbers translate into longer, healthier lives.

https://www.puretestedpeptides.com/wp-content/uploads/2026/09/retatrutides-triple-agonist-data-and-cardiometabolic-endpoints-interpreting-weig.webp 1024 1536 https://www.puretestedpeptides.com/wp-content/uploads/2026/01/buy-peptides-online.jpg 2026-09-24 13:04:422026-09-24 13:04:42Retatrutide’s Triple-Agonist Data and Cardiometabolic Endpoints: Interpreting Weight, A1C, Lipids, Blood Pressure, and hsCRP Together
Tesamorelin Research in 2026: What New Visceral-Fat Evidence Means for Body-Composition Study Design

Tesamorelin Research in 2026: What New Visceral-Fat Evidence Means for Body-Composition Study Design

September 24, 2026/0 Comments/in Uncategorized/by

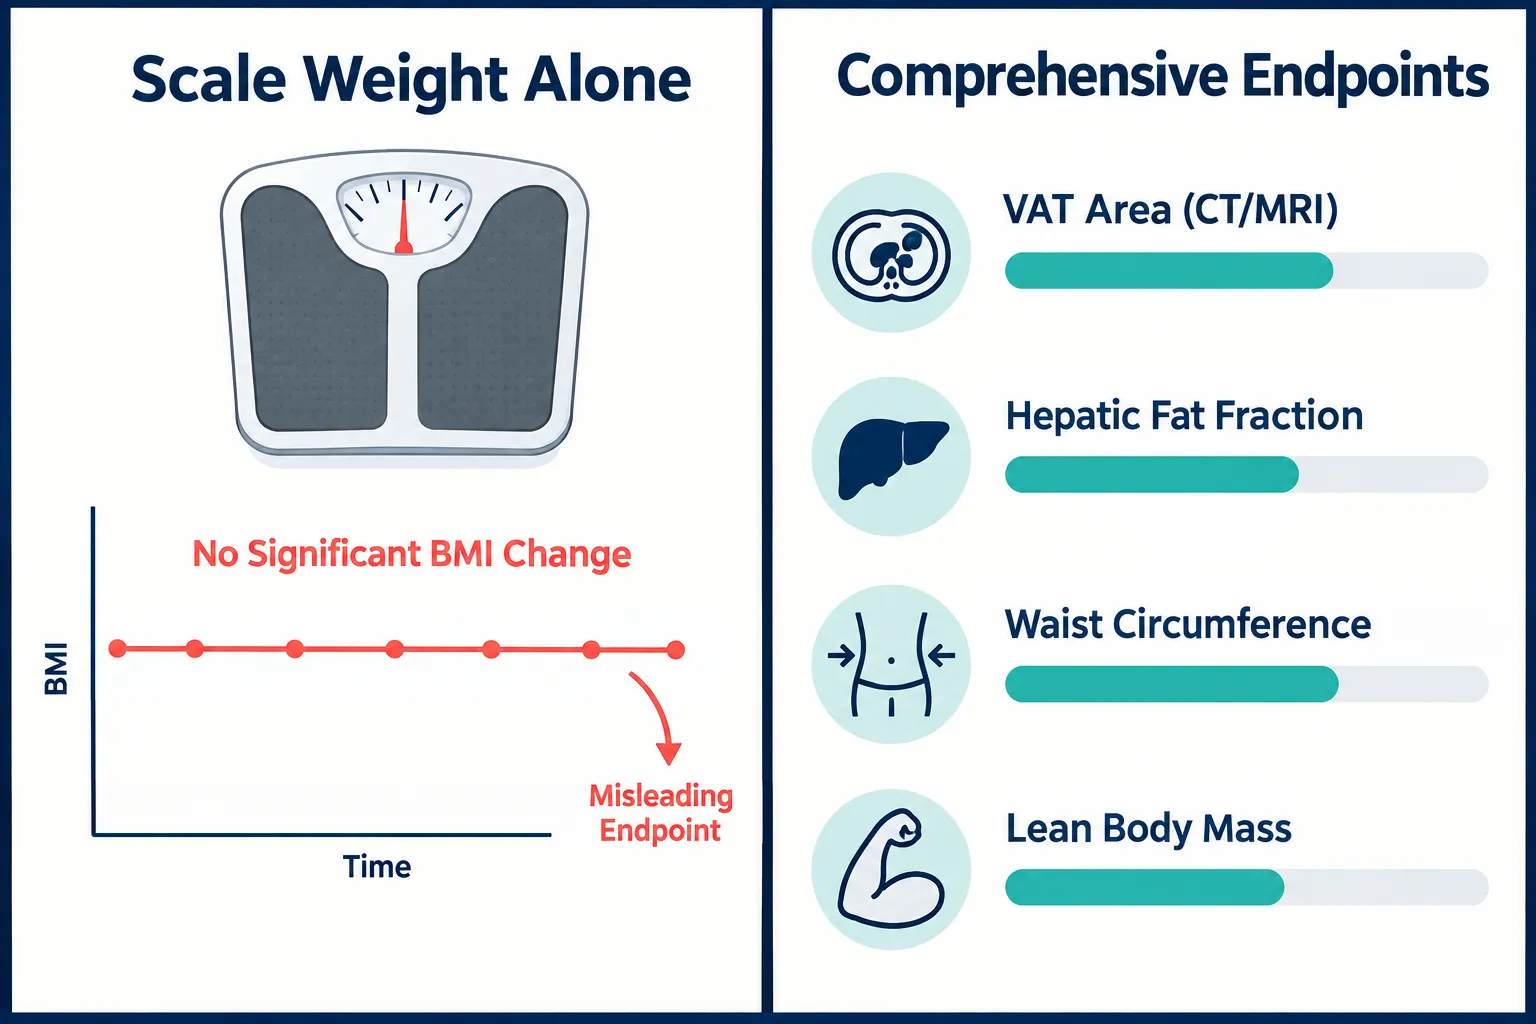
Scale weight has never been a reliable proxy for metabolic health, and the latest evidence on tesa makes that clearer than ever. A 2026 meta-analysis pooling five randomized controlled trials found that tesa reduced visceral adipose tissue by a mean of 27.71 cm² versus placebo, yet produced no significant change in BMI. That single finding reframes how researchers should design body-composition studies and which endpoints actually matter. Tesamorelin Research in 2026: What New Visceral-Fat Evidence Means for Body-Composition Study Design is no longer just a niche HIV pharmacology question, it is a blueprint for the next generation of metabolic trials.

Key Takeaways

  • A 2026 meta-analysis confirms tesa reduces visceral adipose tissue by roughly 27.71 cm² versus placebo with no meaningful BMI change, proving scale weight is an inadequate primary endpoint.
  • Hepatic fat fraction, waist circumference, and lean body mass must be incorporated as secondary endpoints in future body-composition trials.
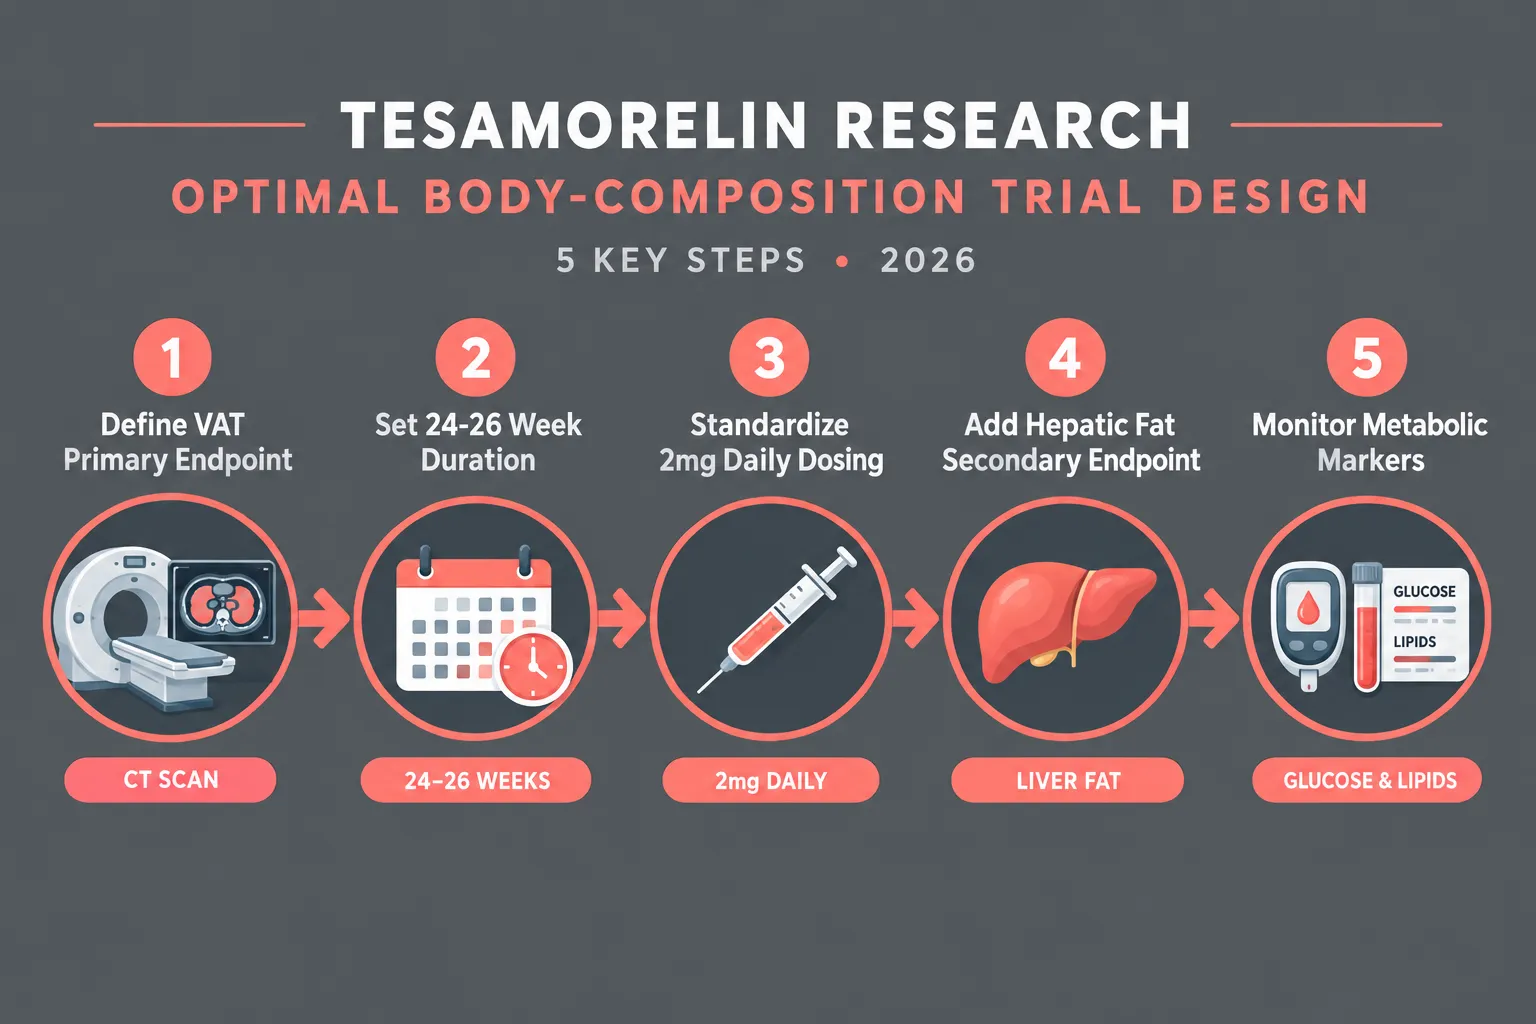
  • Trials should be designed for at least 24 to 26 weeks of active treatment at a standardized 2 mg daily dose to capture clinically meaningful VAT changes.
  • Categorical "responder" endpoints, such as achieving a threshold reduction in visceral fat, add statistical and clinical value beyond mean differences alone.
  • Tesamorelin remains FDA-approved only for HIV-associated lipodystrophy; evidence in non-HIV populations is still emerging, with NAFLD and cardiometabolic risk reduction as the most plausible areas for future label expansion.

How Tesamorelin Acts on Visceral and Ectopic Fat

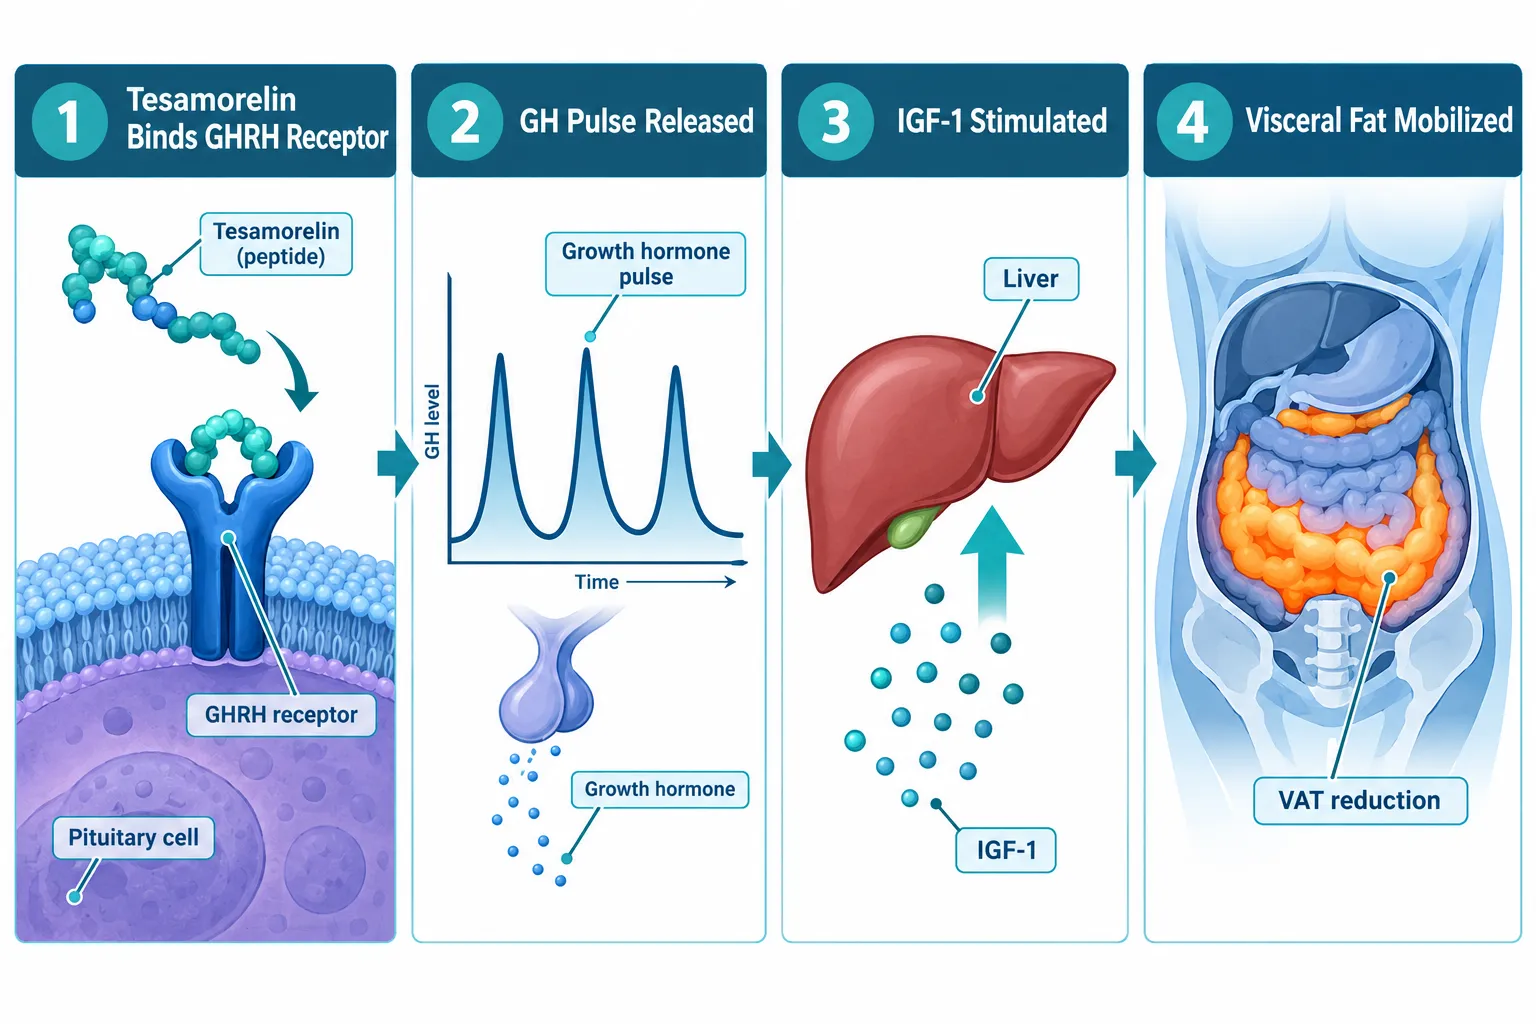
Tesamorelin is a synthetic analogue of growth hormone-releasing hormone (GHRH). It binds to GHRH receptors in the pituitary gland, stimulating pulsatile growth hormone secretion, which in turn elevates insulin-like growth factor 1 (IGF-1). This hormonal cascade preferentially mobilizes visceral adipose tissue, the metabolically active fat surrounding internal organs, rather than subcutaneous fat, which explains why total body weight changes little even when internal fat depots shrink substantially.

How Tesamorelin Acts on Visceral and Ectopic Fat

This selectivity has important implications. Researchers comparing tesa vs ipamorelin note that each peptide operates through related but distinct pathways, producing different body-composition profiles. Understanding tesa's specific mechanism helps justify why imaging-based endpoints, not scale weight, must anchor future study designs.

Key fat depots affected by tesa:

Depot Direction of Change Magnitude (Pooled Data)
Visceral adipose tissue (VAT) Decrease ~15-28 cm² reduction
Hepatic fat fraction Decrease ~4.2-4.28 percentage points
Trunk fat Decrease Moderate
Waist circumference Decrease ~1.61 cm
Lean body mass Increase ~1.42 kg
BMI No significant change —

The liver fat data deserve particular attention. In people with HIV and nonalcoholic fatty liver disease, tesa has been shown to reduce liver fat content and slow progression of liver inflammation and fibrosis. This positions hepatic fat fraction as a critical secondary endpoint in ongoing and future trials, one that carries direct clinical relevance far beyond cosmetic fat reduction.


What the 2026 Evidence Signals for Study Design

Tesamorelin Research in 2026: What New Visceral-Fat Evidence Means for Body-Composition Study Design converges on a clear methodological message: composite, imaging-based endpoint packages outperform single-metric approaches.

The 2026 meta-analysis reported a 4.28 percentage-point reduction in hepatic fat alongside the VAT reduction. A 2024 randomized controlled trial in people with HIV on integrase inhibitor-based antiretroviral therapy added another layer: 67% of tesa recipients achieved the FDA-defined threshold of at least 8% reduction in visceral fat, compared with a much smaller proportion in the placebo group. That categorical "responder" analysis, not just the mean difference, is what translates into clinically actionable findings.

"Trials that report only mean VAT change miss the distribution of response. Knowing that two-thirds of participants crossed a meaningful threshold is far more informative for clinical decision-making."

Earlier phase III data involving approximately 806 participants showed tesa decreased VAT by 15 to 18% over 26 to 52 weeks, while placebo groups saw VAT increase or remain stable. In one pivotal study, VAT fell 15.2% in the tesa arm but rose 5.0% with placebo, with parallel improvements in triglycerides and total/HDL cholesterol ratios. These consistent effect sizes now anchor power calculations for modern study designs.

What the 2026 Evidence Signals for Study Design

Recommended endpoint package for future trials:

  • Primary: VAT area measured by CT or MRI
  • Secondary: Hepatic fat fraction, waist circumference, lean body mass
  • Exploratory: Triglycerides, total/HDL cholesterol ratio, insulin sensitivity markers
  • Categorical: Proportion achieving threshold VAT or hepatic fat reduction

Researchers planning protocols can consult a tesa dosage calculator to standardize dosing parameters, and review tesa dosage for fat loss frameworks when designing intervention arms.


Practical Implications for Future Body-Composition Trials

The operational requirements of tesa research shape what is feasible in study design. Daily subcutaneous injections, medical evaluation, and ongoing metabolic monitoring are non-negotiable components. These constraints favor trials in motivated, closely followed cohorts with clear metabolic indications, not broad, lifestyle-focused samples.

Practical Implications for Future Body-Composition Trials

Minimum design standards supported by current evidence:

  1. Duration: At least 24 to 26 weeks of active treatment; 12-month data from a 404-patient HIV trial confirm that meaningful VAT changes require sustained therapy.
  2. Dosing: Standardized at 2 mg daily subcutaneous injection where regulatory and safety constraints allow.
  3. Imaging: CT or MRI for VAT area and hepatic fat fraction; waist circumference as a low-cost supplement.
  4. Metabolic monitoring: Glucose, insulin, and lipid panels at baseline, midpoint, and endpoint, especially critical in non-HIV populations where safety profiles are less established.
  5. Population clarity: Current evidence base is overwhelmingly from HIV-associated lipodystrophy cohorts; non-HIV trials require conservative inclusion criteria.

Outside HIV, tesa is now being formally tested in obese individuals with NAFLD in ongoing Phase II randomized, double-blind, placebo-controlled trials registered in 2026. These studies use liver fat reduction as the primary endpoint and include cardiovascular and metabolic secondary outcomes, a design philosophy that reflects the broader shift toward organ-specific fat and risk-marker composites rather than weight loss per se.

For researchers exploring combination peptide protocols, the tesa CJC-1295 ipamorelin 12mg blend represents an area of active investigation, though standalone tesa data remain the gold standard for visceral fat endpoint validation. Those seeking foundational context on peptide mechanisms can also review Peptides 101 for research-use only buyers for structural and mechanistic background.

It is equally important to note what the evidence does not support. Authoritative regulatory and fact-check sources in 2026 reiterate that tesa is FDA-approved only for reducing excess abdominal fat in adults with HIV-associated lipodystrophy and is explicitly not indicated for weight loss management. Evidence in non-HIV patients and in general obesity remains minimal, and off-label use for cosmetic or routine weight loss is not supported by current data. Analysts view NAFLD and cardiometabolic risk reduction, not cosmetic obesity, as the most plausible future areas for label expansion, contingent on results from current Phase II trials.


Conclusion

The 2026 visceral-fat evidence base for tesa delivers a direct challenge to body-composition researchers: stop anchoring studies to scale weight and start building endpoint packages that reflect where the metabolic action actually occurs. VAT area, hepatic fat fraction, waist circumference, and lean body mass together tell a story that BMI simply cannot.

Actionable next steps for research teams:

  • Adopt CT or MRI-based VAT measurement as the primary endpoint in any new tesa protocol.
  • Add hepatic fat fraction and lean body mass as pre-specified secondary endpoints.
  • Power trials for at least 24 to 26 weeks with standardized 2 mg daily dosing.
  • Include categorical responder analyses alongside mean-difference statistics.
  • Restrict non-HIV study populations to those with clear metabolic indications and build in rigorous glucose, insulin, and lipid monitoring from the outset.

Tesamorelin Research in 2026: What New Visceral-Fat Evidence Means for Body-Composition Study Design ultimately points toward a more precise, organ-specific, and metabolically meaningful research paradigm, one where the question is not "how much does the patient weigh?" but "where is the fat, how much of it is dangerous, and is it responding?"

https://www.puretestedpeptides.com/wp-content/uploads/2026/09/tesa-research-in-2026-what-new-visceral-fat-evidence-means-for-body-compo.webp 1024 1536 https://www.puretestedpeptides.com/wp-content/uploads/2026/01/buy-peptides-online.jpg 2026-09-24 13:04:422026-09-24 13:04:42Tesamorelin Research in 2026: What New Visceral-Fat Evidence Means for Body-Composition Study Design
Growth-Hormone Secretagogue Research Design: Comparing Tesamorelin, CJC-1295, Ipamorelin, and Sermorelin by Signal Duration

Growth-Hormone Secretagogue Research Design: Comparing Tesamorelin, CJC-1295, Ipamorelin, and Sermorelin by Signal Duration

September 24, 2026/0 Comments/in Uncategorized/by

Fewer than 4% of a subcutaneous tesa dose reaches systemic circulation, yet that brief plasma exposure, peaking in under 10 minutes and clearing within roughly half an hour, is enough to drive measurable reductions in visceral fat in HIV-associated lipodystrophy. That pharmacokinetic reality sits at the core of Growth-Hormone Secretagogue Research Design: Comparing Tesamorelin, CJC-1295, Ipamorelin, and Sermorelin by Signal Duration: the duration of a peptide's plasma signal is not a side note, it is the primary variable that determines assay timing, endpoint selection, and the validity of any IGF-1 interpretation.

Key Takeaways

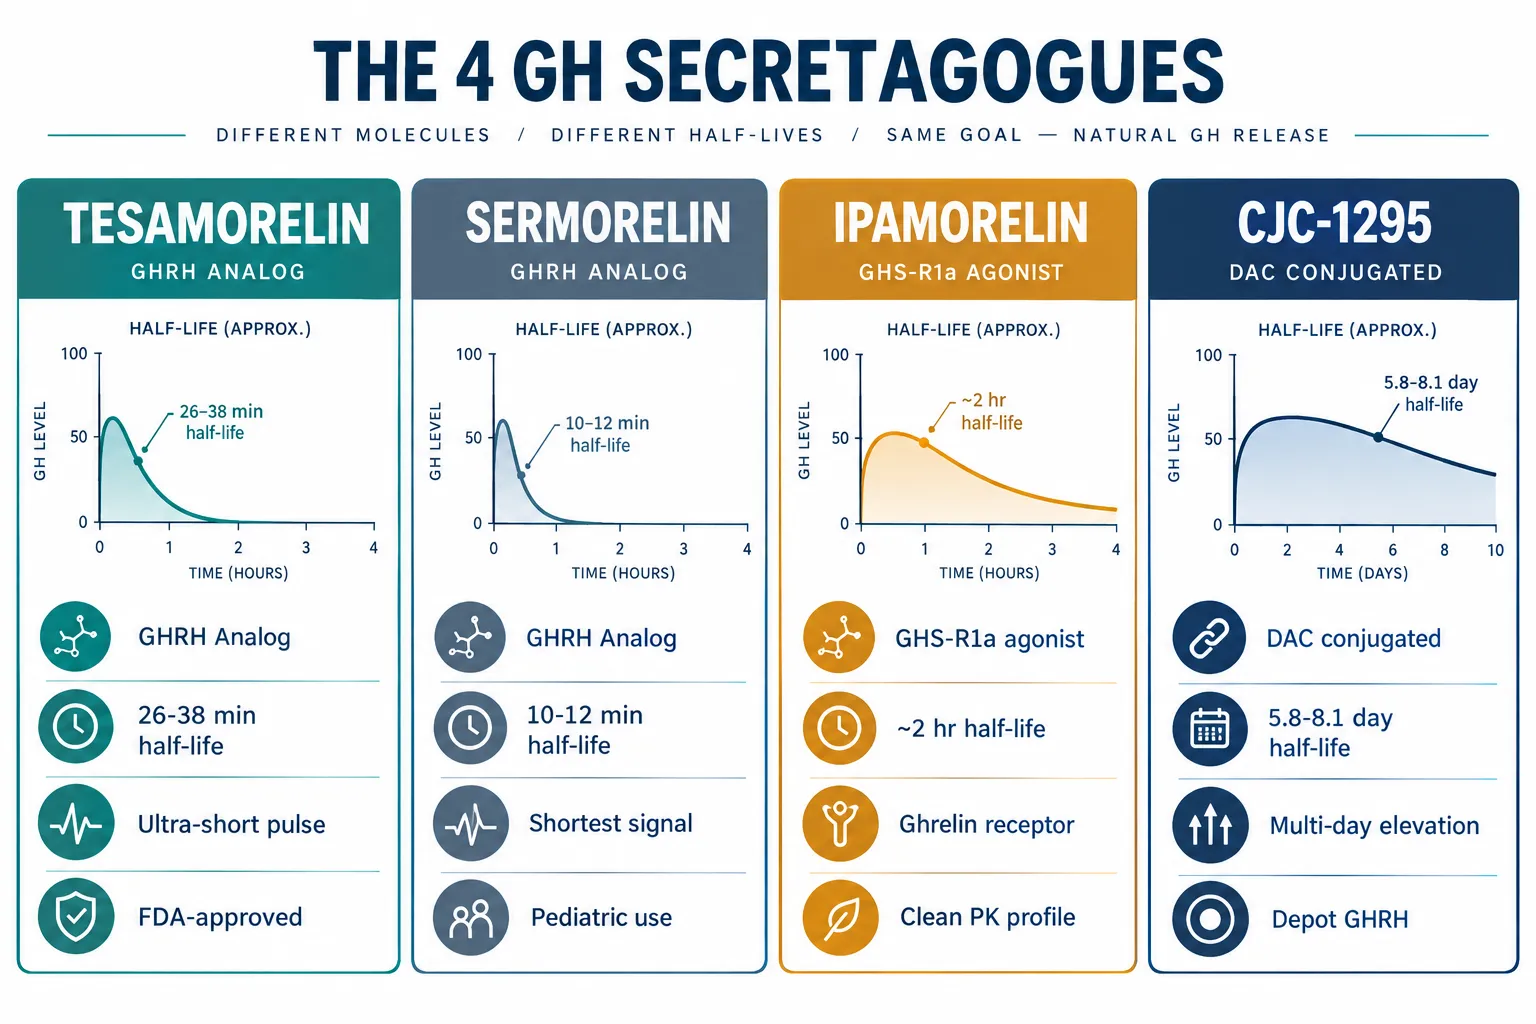
  • Tesamorelin and sermorelin are ultra-short GHRH analogs (half-lives of roughly 11-38 minutes and 10-12 minutes, respectively); assay windows must open within minutes of dosing.
  • Ipamorelin acts at a different receptor (GHS-R1a, not the GHRH receptor), carries an approximately 2-hour half-life, and generates a longer but still transient GH pulse.
  • CJC-1295 with DAC is a depot GHRH analog with a half-life of 5.8-8.1 days; it converts a single injection into a week-long endocrine signal, which fundamentally changes the experimental question.
  • DAC status is a design-level variable for CJC-1295 studies, without DAC, the half-life collapses to minutes; with DAC, it extends to days.
  • No completed human randomized trial has evaluated the CJC-1295 plus ipamorelin combination, so signal-duration synergy claims remain extrapolated from single-agent data.

Pulse Architecture: How Signal Duration Defines the Experiment

Pulse Architecture: How Signal Duration Defines the Experiment

Every GH secretagogue study is, at its foundation, a study of pulse architecture. The hypothalamic-pituitary axis releases GH in discrete bursts. Secretagogues either mimic or amplify those bursts. The key question for research design is: how long does the secretagogue's plasma signal last, and what does that mean for when you measure?

The four agents in this comparison span roughly four orders of magnitude in signal duration:

Agent Receptor Target Approximate Half-Life Signal Category
Sermorelin GHRH receptor 10-12 minutes Ultra-short
Tesamorelin GHRH receptor 11-38 minutes Ultra-short
Ipamorelin GHS-R1a (ghrelin receptor) ~2 hours Short
CJC-1295 with DAC GHRH receptor 5.8-8.1 days Long (depot)

Sermorelin is a truncated GHRH analog. Its plasma half-life of roughly 10-12 minutes means a GH pulse is triggered almost immediately after injection, and the secretagogue itself is largely cleared before most clinical blood draws are even processed. Sermorelin remains primarily used in pediatric growth hormone deficiency contexts and carries no FDA approval for adult indications, which limits the pool of controlled adult trial data.

Tesamorelin, the FDA-approved GHRH analog marketed as EGRIFTA and EGRIFTA WR, has a median time to peak plasma concentration of about 0.15 hours and a mean elimination half-life of 26-38 minutes under repeated dosing. In healthy subjects, that half-life compresses to roughly 11 minutes. Updated prescribing data for the newer EGRIFTA WR formulation confirm that reformulation did not meaningfully extend signal duration, systemic exposure (Cmax and AUC) remained comparable to the original product. For those designing studies around this agent, the science behind tesa provides useful background on its receptor-level mechanism.

"A short plasma signal does not mean a short biological effect, it means the downstream cascade, including GH secretion and IGF-1 synthesis, must be measured on a timeline that respects the signal's architecture."


Receptor-Level Intent and the Ipamorelin Distinction

Receptor-Level Intent and the Ipamorelin Distinction

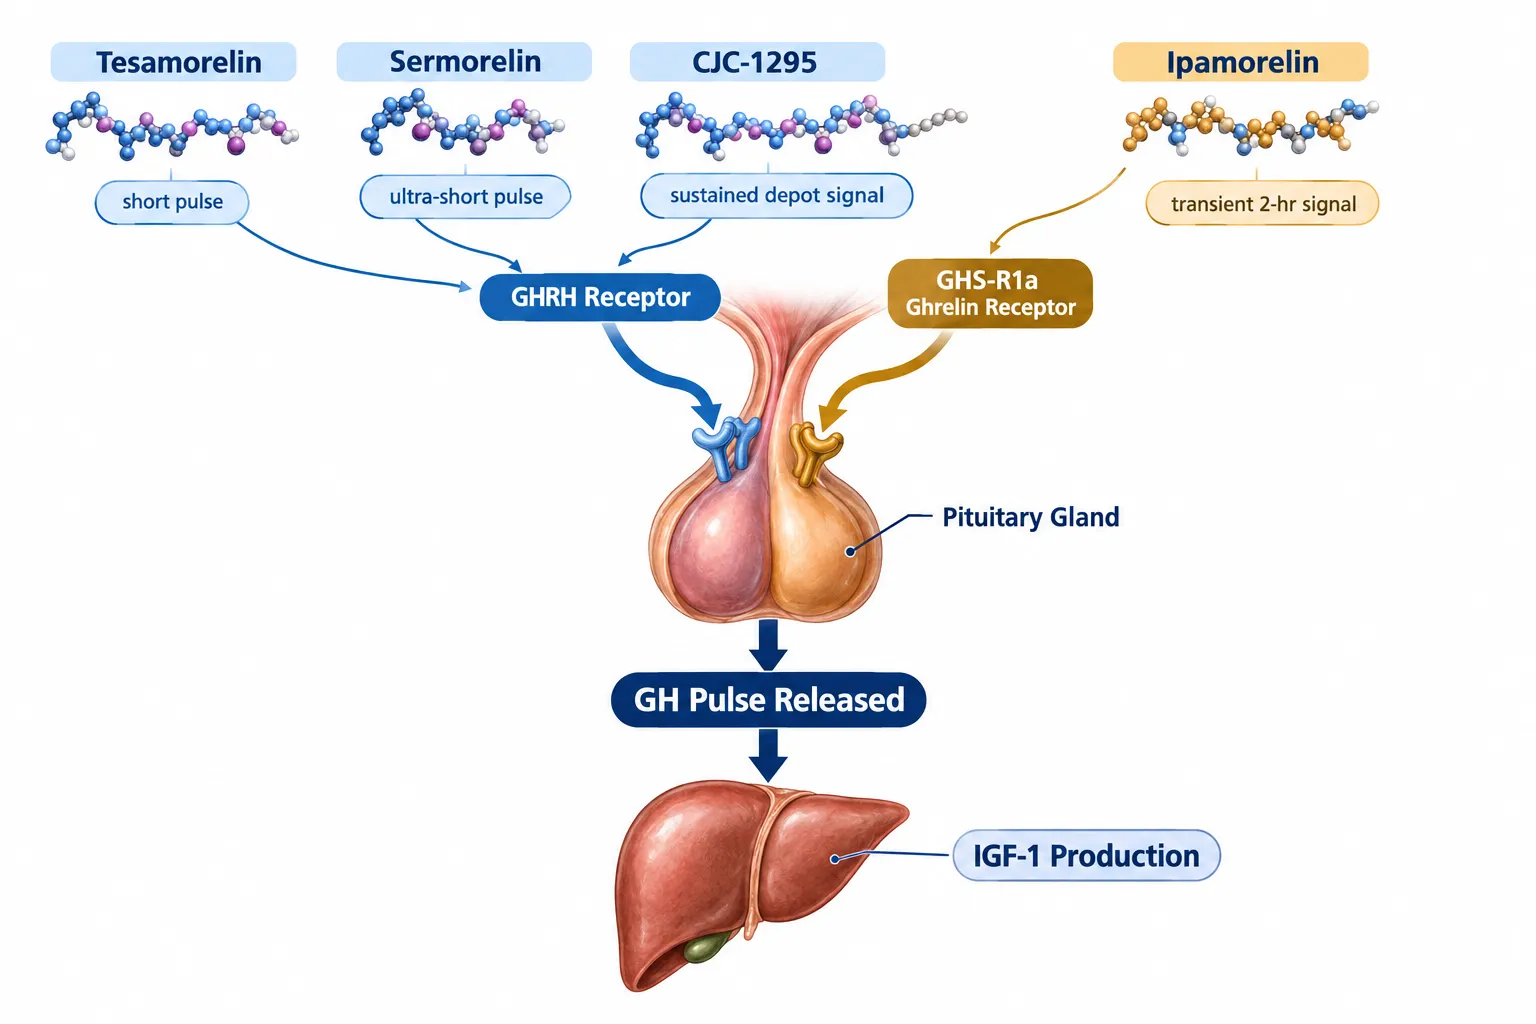
One of the most consequential design errors in secretagogue research is treating ipamorelin as interchangeable with GHRH analogs. It is not. Ipamorelin activates GHS-R1a, the ghrelin receptor, not the GHRH receptor. This receptor-level distinction has direct implications for combination protocols and signal-duration comparisons.

Ipamorelin's PK profile is notably cleaner than that of older GHRPs. Its terminal half-life sits around 2 hours, clearance is approximately 0.078 L/h/kg, and its volume of distribution at steady state is about 0.22 L/kg. The dose-proportional kinetics make it a tractable agent for controlled studies. Researchers interested in sourcing this compound for preclinical work can review options under buy ipamorelin online.

Because ipamorelin works through a separate receptor, combining it with a GHRH analog is theoretically additive, each agent hits a distinct node in the GH-release pathway. However, no completed human randomized controlled trial has tested the CJC-1295 plus ipamorelin stack. Signal-duration synergy claims for this combination are extrapolated from single-agent PK/PD data, not direct combination evidence. Any research protocol treating this combination as established is building on an incomplete evidentiary foundation.

For studies using multi-agent blends, the Sermorelin Ipamorelin CJC-1295 blend page outlines how these agents are commonly combined in research contexts, while the Tesamorelin AOD9604 CJC-1295 Ipamorelin 12mg blend illustrates multi-peptide formulation approaches.


DAC Status, Assay Timing, and IGF-1 Interpretation

DAC Status, Assay Timing, and IGF-1 Interpretation

The DAC (Drug Affinity Complex) modification on CJC-1295 is not a minor formulation detail, it changes the fundamental experimental question. Without DAC, CJC-1295 behaves similarly to sermorelin: a short-acting GHRH analog cleared within minutes. With DAC, the half-life extends to 5.8-8.1 days, and a single subcutaneous injection produces GH elevations of roughly 2- to 10-fold for at least 6 days, with IGF-1 increases of approximately 1.5- to 3-fold persisting for 9-11 days.

This transforms the research design in three ways:

  1. Dosing frequency shifts from daily to weekly or biweekly.
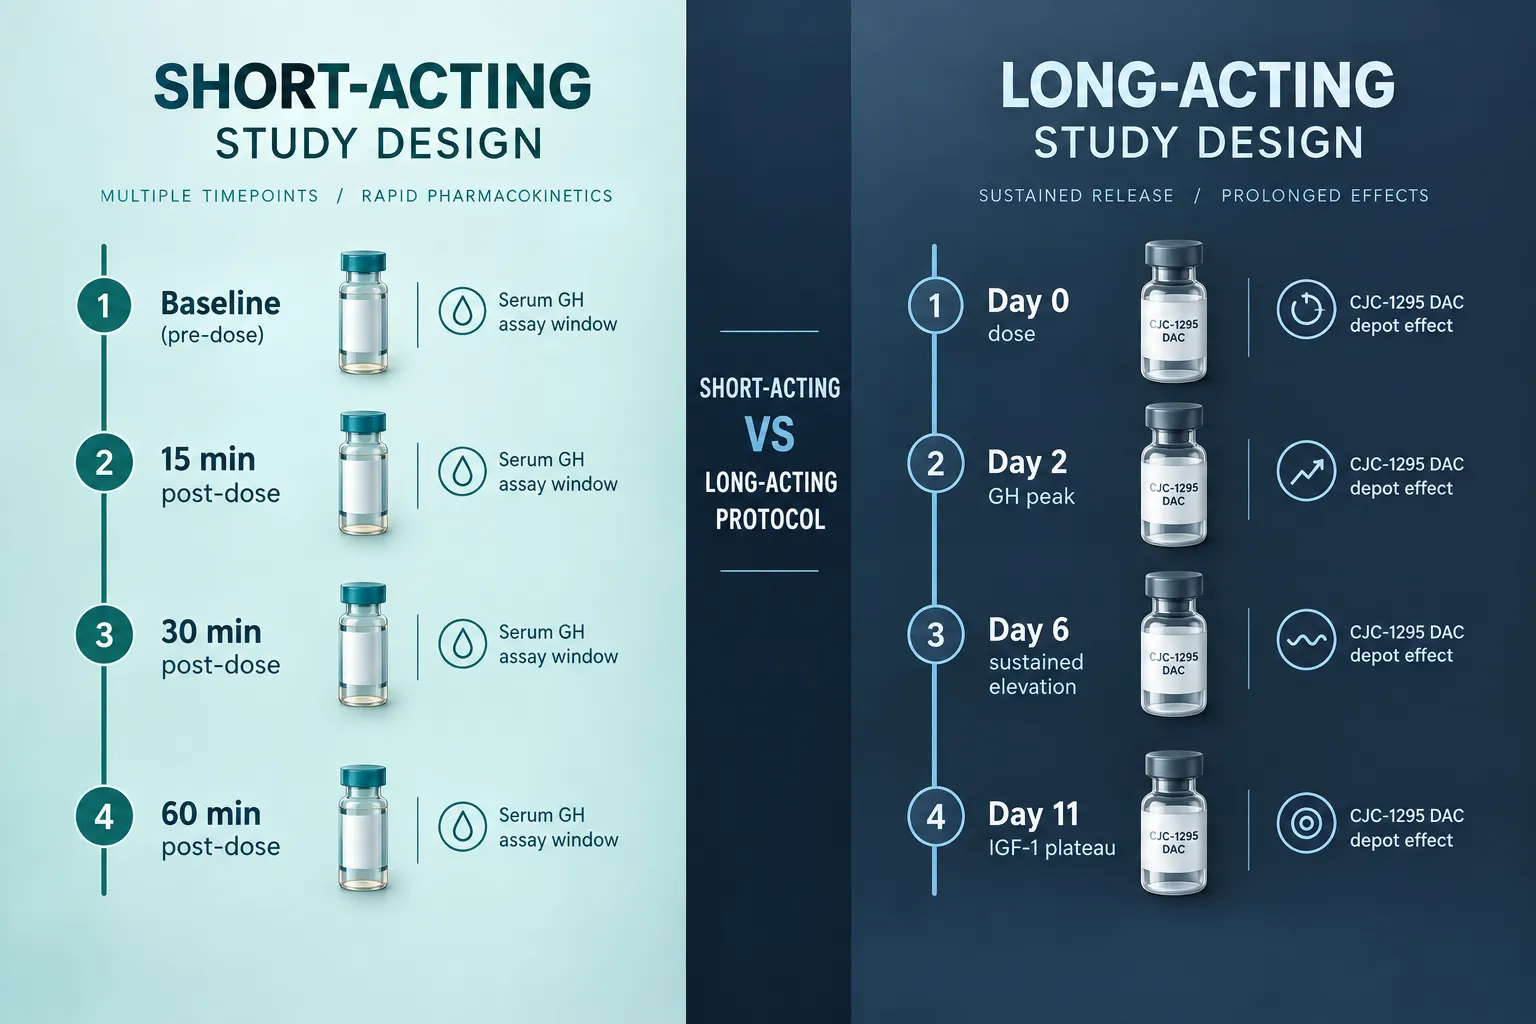
  2. Assay timing must capture multi-day kinetics rather than a 30-60 minute post-dose window.
  3. IGF-1 as an endpoint becomes more meaningful because sustained GH elevation is required to drive meaningful IGF-1 synthesis; ultra-short agents like sermorelin or tesa generate IGF-1 changes through repeated daily pulses, not a single sustained signal.

For detailed pharmacokinetic comparisons of CJC-1295 with and without DAC, the dedicated CJC-1295 mechanism and pharmacokinetic comparison article is a primary reference.

When designing assay protocols, the following timing framework applies:

  • Sermorelin / Tesamorelin: Serum GH sampling at 15, 30, and 60 minutes post-dose; IGF-1 measured after at least 4 weeks of daily dosing.
  • Ipamorelin: Serum GH sampling at 30, 60, and 120 minutes post-dose; IGF-1 measured after sustained multi-week exposure.
  • CJC-1295 with DAC: Serum GH at 24, 48, and 96 hours post-dose; IGF-1 at days 7, 14, and 28 to capture accumulation across doses.

Misaligning assay windows with signal duration is one of the most common sources of false-negative results in secretagogue research. A study measuring GH at 4 hours post-tesa dose will miss the peak entirely.

Population PK/PD data from tesa trials in HIV-infected patients show approximately 34% higher systemic AUC compared with healthy subjects, despite similar Cmax and Tmax values. This exposure difference does not change the pulse-type time profile, it means downstream GH and IGF-1 responses may be amplified in certain populations, which must be accounted for in between-group comparisons. Researchers exploring tesa dosage parameters will find this population-level variability relevant to protocol calibration.


Conclusion

Growth-Hormone Secretagogue Research Design: Comparing Tesamorelin, CJC-1295, Ipamorelin, and Sermorelin by Signal Duration is ultimately a question of matching measurement strategy to mechanism. Each agent operates on a distinct timeline and at a distinct receptor, and treating them as interchangeable leads to flawed assay design and uninterpretable data.

Actionable next steps for researchers in 2026:

  • Classify agents by signal tier first, ultra-short (sermorelin, tesa), short (ipamorelin), or long-acting depot (CJC-1295 with DAC), before selecting endpoints or dosing intervals.
  • Confirm DAC status on any CJC-1295 source before designing a protocol; the presence or absence of DAC changes the experimental question entirely.
  • Align GH assay windows with each agent's Tmax and half-life; misaligned sampling is the most preventable source of false-negative results.
  • Treat IGF-1 as a cumulative marker, not an acute one; interpret it only in the context of dosing duration and frequency appropriate to each agent's signal length.
  • Avoid overstating combination evidence for CJC-1295 plus ipamorelin stacks until human randomized trial data are available.

Rigorous secretagogue research depends less on which peptide is chosen and more on whether the study design respects the biology of how each signal is generated, sustained, and cleared.

https://www.puretestedpeptides.com/wp-content/uploads/2026/09/growth-hormone-secretagogue-research-design-comparing-tesa-cjc-1295-ipamo.webp 1024 1536 https://www.puretestedpeptides.com/wp-content/uploads/2026/01/buy-peptides-online.jpg 2026-09-24 13:04:162026-09-24 13:04:16Growth-Hormone Secretagogue Research Design: Comparing Tesamorelin, CJC-1295, Ipamorelin, and Sermorelin by Signal Duration
Peptides and Common Prescription Drugs: A Researcher’s Interaction-Mapping Framework for Metoprolol, Lisinopril, Omeprazole, and More

Peptides and Common Prescription Drugs: A Researcher’s Interaction-Mapping Framework for Metoprolol, Lisinopril, Omeprazole, and More

September 23, 2026/0 Comments/in Uncategorized/by

Over 60% of adults in developed nations take at least two prescription medications daily, yet the growing use of research peptides in preclinical and translational studies means that co-exposure scenarios involving agents like metoprolol, lisinopril, and omeprazole are now routine in laboratory settings. This reality makes a structured approach to Peptides and Common Prescription Drugs: A Researcher's Interaction-Mapping Framework for Metoprolol, Lisinopril, Omeprazole, and More not just useful, but essential for producing reliable, reproducible data.


Key Takeaways

  • Most therapeutic peptides are broken down by proteolytic enzymes, not cytochrome P450 (CYP) enzymes, which significantly reduces classic pharmacokinetic drug-drug interaction risk compared with small molecules.
  • Pharmacodynamic overlap, such as additive blood pressure lowering when GLP-1 peptides combine with metoprolol or lisinopril, often represents the most clinically relevant interaction category in research models.
  • Omeprazole introduces two distinct interaction mechanisms: pH-mediated absorption changes and CYP2C19 inhibition, both of which must be mapped separately in any co-exposure framework.
  • Researchers should classify interactions into four categories, pharmacokinetic, pharmacodynamic, assay interference, and co-exposure design, before selecting study controls.
  • Targeted, mechanistic interaction studies are more informative than broad panels when the peptide class has a known physiological signal (e.g., gastric motility changes or renal clearance shifts).

Building the Four-Category Interaction Map

The foundation of Peptides and Common Prescription Drugs: A Researcher's Interaction-Mapping Framework for Metoprolol, Lisinopril, Omeprazole, and More rests on separating four distinct interaction types before any study design is finalized. Conflating these categories is the most common source of ambiguous results.

Four-panel interaction-mapping framework for peptides and prescription drugs

Category 1: Pharmacokinetic (PK) Interactions

Peptides are primarily metabolized by ubiquitous proteolytic enzymes into amino acids. This pathway operates largely outside the CYP450 system, which governs the metabolism of most small-molecule drugs. The practical result: direct PK interactions between peptides and CYP-metabolized drugs are markedly lower than interactions between two small molecules.

However, this does not mean PK concerns disappear entirely. Key variables to monitor include:

  • Gastric emptying rate, GLP-1 class peptides slow gastric motility, delaying the absorption of co-administered oral drugs. Drugs with narrow therapeutic windows (warfarin, levothyroxine, certain antiepileptics) require particular attention.
  • Renal clearance, Lisinopril, an ACE inhibitor, is eliminated almost entirely by the kidneys. Peptides that alter renal perfusion or glomerular filtration can shift lisinopril exposure without any CYP involvement.
  • Bioavailability shifts from pH changes, Omeprazole raises gastric pH, which can increase digoxin bioavailability by roughly 10% on average and up to 30% in some individuals. Any peptide co-administered with omeprazole in a polypharmacy model inherits this pH-altered environment.

Researcher note: When designing absorption studies, include a vehicle-only arm that still receives the omeprazole or proton pump inhibitor (PPI) to isolate pH effects from peptide-specific effects.

Category 2: Pharmacodynamic (PD) Interactions

PD interactions occur when two agents produce overlapping or opposing effects on the same physiological system, independent of changes in drug concentration. This is where peptide-drug combinations involving cardiovascular agents carry the most meaningful risk in research models.

Metoprolol is a selective beta-1 adrenergic blocker metabolized by CYP2D6. It lowers heart rate and blood pressure. GLP-1 receptor agonist peptides also modulate cardiovascular endpoints. When combined, the monitoring variables should include:

Variable Metoprolol Effect GLP-1 Peptide Effect Combined Signal Risk
Heart rate Decrease Modest increase (acute) Attenuated or masked
Blood pressure Decrease Decrease Additive lowering
Glucose regulation Mild impairment Improvement Opposing, requires tracking

Lisinopril adds another layer. As an ACE inhibitor, it reduces angiotensin II and aldosterone, lowering blood pressure and affecting potassium handling. Peptides that independently affect the renin-angiotensin-aldosterone system (RAAS) or renal electrolyte balance require electrolyte panels as mandatory monitoring variables in any co-exposure protocol.

For researchers exploring polypeptide peptides in cardiometabolic models, understanding how these PD overlaps differ from classic small-molecule drug interactions is a critical starting point.


Omeprazole as a Framework Stress Test

Omeprazole deserves its own section in any Peptides and Common Prescription Drugs: A Researcher's Interaction-Mapping Framework because it simultaneously introduces two mechanistically distinct interaction pathways.

GLP-1 peptide effect on oral drug absorption and gastric pH

Pathway 1: CYP2C19 Inhibition

Omeprazole is a competitive inhibitor of CYP2C19. This means it can increase plasma concentrations of CYP2C19 substrates such as diazepam, phenytoin, and warfarin. Simultaneously, it reduces the conversion of clopidogrel to its active metabolite, a clinically significant reduction in antiplatelet effect. The magnitude of these interactions is dose-dependent; co-administration of omeprazole 40 mg with certain antiretroviral agents has been shown to reduce drug exposure by more than 90%, illustrating the dramatic range possible.

Pathway 2: pH-Mediated Absorption Changes

By raising gastric pH, omeprazole alters the solubility and ionization state of co-administered drugs. This affects absorption independent of any enzyme involvement. Researchers should classify each drug in their model as either acid-dependent or acid-independent for absorption, then apply appropriate controls.

Framework rule: When omeprazole is present in a co-exposure model, interaction signals must be attributed to either CYP2C19 inhibition, pH alteration, or both, never lumped under a single "omeprazole interaction" label.

Researchers studying peptide dosing protocols in models that include PPIs should build separate arms to isolate each mechanism.


Study Controls, Assay Interference, and Co-Exposure Design

The third and fourth categories, assay interference and co-exposure design, are often overlooked but can invalidate results if ignored.

Step-by-step peptide-drug interaction monitoring protocol for researchers

Assay Interference

Peptides can interfere with immunoassays and chromatographic methods used to measure small-molecule drug concentrations. Cross-reactivity in ELISA-based assays, co-elution in HPLC runs, and matrix effects in mass spectrometry are all documented issues. Before running a co-exposure experiment, validate each assay in the presence of the peptide at the expected study concentration.

Co-Exposure Design Controls

A rigorous framework requires at minimum four study arms:

  1. Drug alone, establishes baseline PK and PD parameters
  2. Peptide alone, establishes peptide-specific physiological effects
  3. Simultaneous co-administration, tests interaction at peak co-exposure
  4. Staggered administration, tests whether timing offsets (e.g., spacing oral drugs 1 hour before or 4 hours after peptide injection) reduce the interaction signal

This four-arm structure applies whether the peptide under study is a growth hormone secretagogue like those discussed in sermorelin, ipamorelin, and CJC-1295 combinations, a metabolic peptide, or a wound repair peptide being evaluated alongside standard-of-care medications.

Regulatory guidance increasingly supports targeted, mechanistic DDI studies over broad panels. If the peptide class has a known physiological signal, gastric motility, renal clearance, immune modulation, that signal defines which monitoring variables are mandatory. Researchers working with IPA peptides or other ipamorelin-class agents should map growth hormone axis effects against any cardiovascular drug that responds to changes in insulin sensitivity or fluid balance.

For mitochondria-targeted agents, SS-31 peptide benefits research illustrates how organ-level effects on renal and cardiac mitochondria can produce PD overlaps with lisinopril and metoprolol that would not appear in a standard CYP-based interaction screen.


Conclusion

A well-constructed interaction-mapping framework separates what is pharmacokinetic from what is pharmacodynamic, what is assay artifact from what is true co-exposure effect. For researchers working at the intersection of peptides and common prescription drugs, the actionable steps are clear:

  1. Classify before designing. Assign every potential interaction to one of the four categories before selecting assays or study arms.
  2. Treat omeprazole as a dual-mechanism variable. Map CYP2C19 and pH effects independently in any polypharmacy model.
  3. Prioritize PD monitoring for cardiovascular drugs. Metoprolol and lisinopril co-exposure with peptides demands heart rate, blood pressure, renal function, and electrolyte panels as primary endpoints, not just drug concentration curves.
  4. Validate assays in the peptide matrix. Never assume that a validated small-molecule assay performs identically in the presence of a co-administered peptide.
  5. Use staggered dosing arms. Timing offsets are a practical and informative variable, not a workaround.

As the peptide pipeline expands and co-administration with cardiovascular and gastrointestinal drugs becomes more common, this structured approach will remain the most defensible path to interpretable, reproducible research data.

https://www.puretestedpeptides.com/wp-content/uploads/2026/09/peptides-and-common-prescription-drugs-a-researchers-interaction-mapping-framewo.webp 1024 1536 https://www.puretestedpeptides.com/wp-content/uploads/2026/01/buy-peptides-online.jpg 2026-09-23 13:21:022026-09-23 13:21:03Peptides and Common Prescription Drugs: A Researcher’s Interaction-Mapping Framework for Metoprolol, Lisinopril, Omeprazole, and More
Peptide Reconstitution and Stability: How Buffer Choice, pH, Osmolality, and Freeze–Thaw Cycles Affect Research Samples

Peptide Reconstitution and Stability: How Buffer Choice, pH, Osmolality, and Freeze–Thaw Cycles Affect Research Samples

September 23, 2026/0 Comments/in Uncategorized/by

Roughly 30% of peptide research samples degrade before a single experiment is completed, not because of poor synthesis, but because of avoidable reconstitution errors. Peptide reconstitution and stability: how buffer choice, pH, osmolality, and freeze, thaw cycles affect research samples is one of the most consequential yet underappreciated topics in peptide science. A wrong buffer or a single extra freeze, thaw cycle can shift purity from 99% to well below 90%, invalidating weeks of downstream work.

Key Takeaways

  • The optimal pH window for most peptide solutions is 3.5-4.5, with acetate and citrate buffers as first-line choices.
  • Deamidation, hydrolysis, and aggregation each peak at distinct pH bands, making buffer selection sequence-specific.
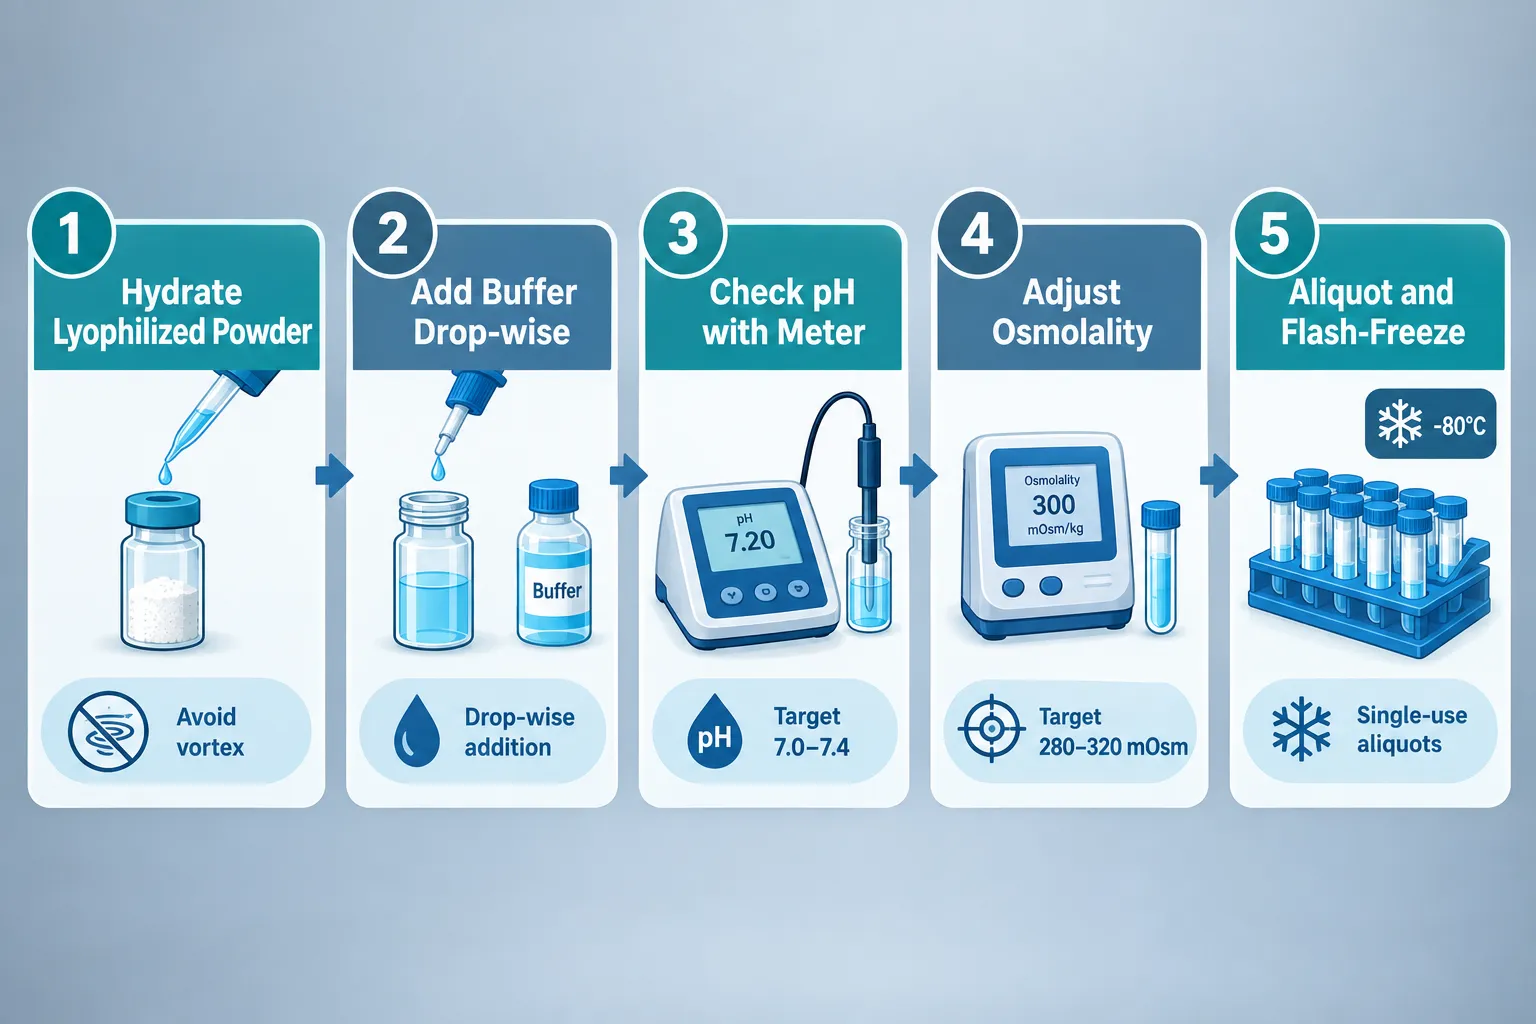
  • Osmolality must be controlled (280-320 mOsm/kg for parenteral and intranasal formulations) to preserve biorelevance.
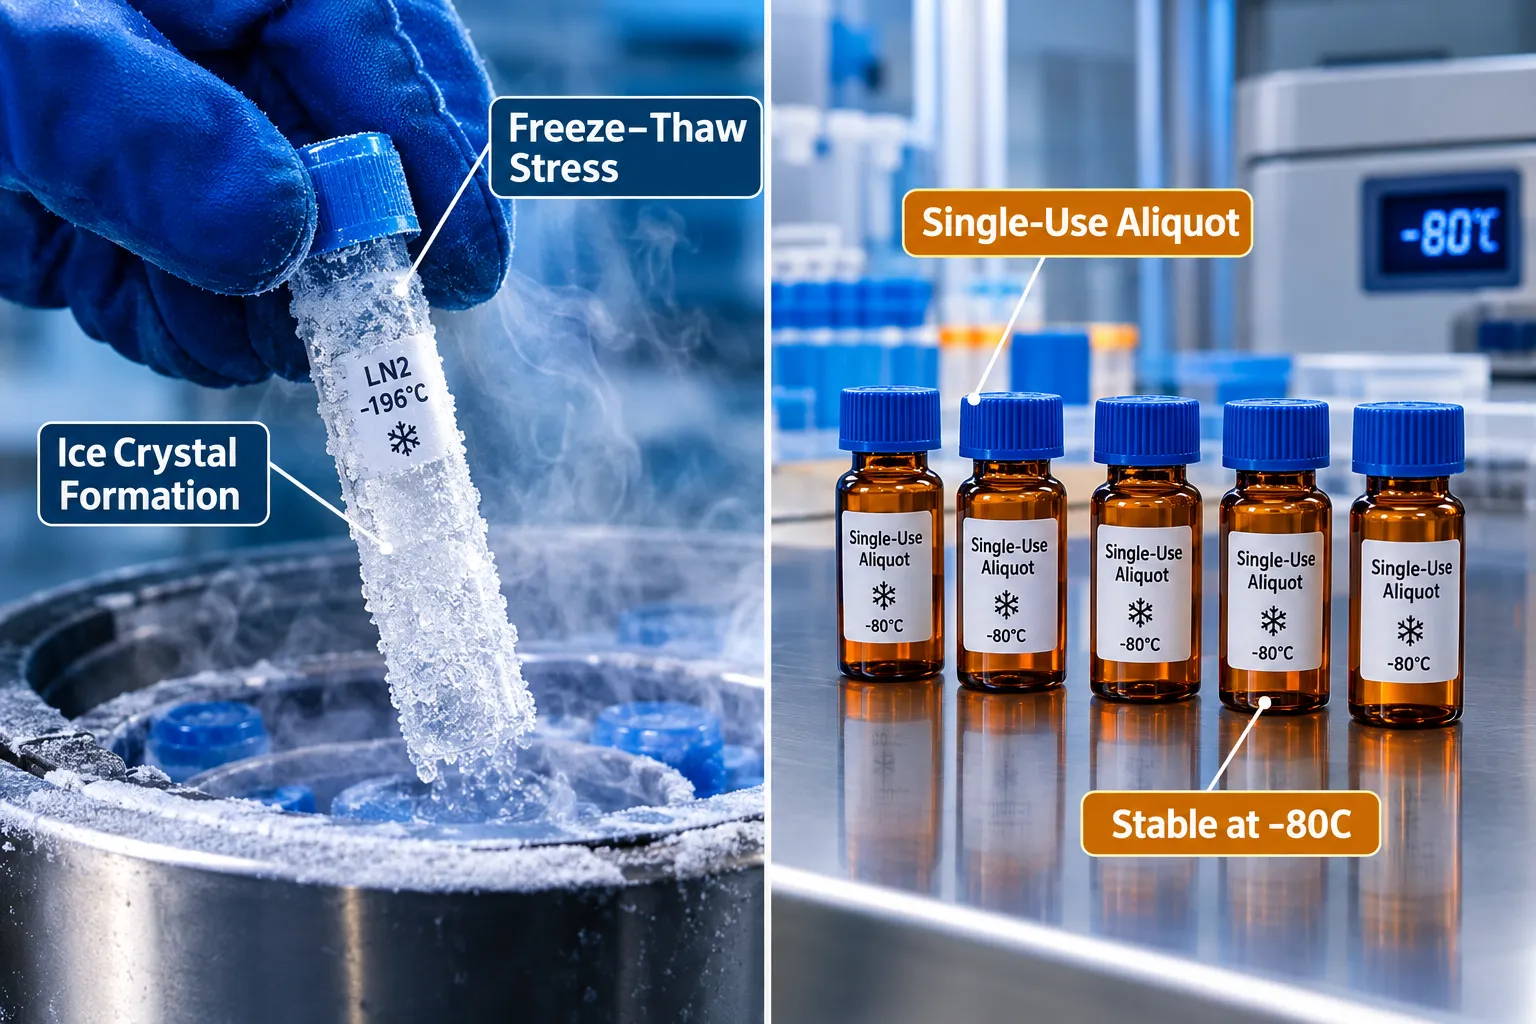
  • Every freeze, thaw cycle introduces measurable degradation; single-use aliquots are the primary mitigation strategy.
  • Stability profiles differ significantly across peptide classes, GLP-class, growth-hormone, regenerative, and nasal peptides each require tailored protocols.

Why Buffer Choice Drives Peptide Reconstitution and Stability

Why Buffer Choice Drives Peptide Reconstitution and Stability

The buffer is not a passive carrier. It sets the chemical environment that either protects or attacks a peptide's backbone and side chains from the moment of reconstitution.

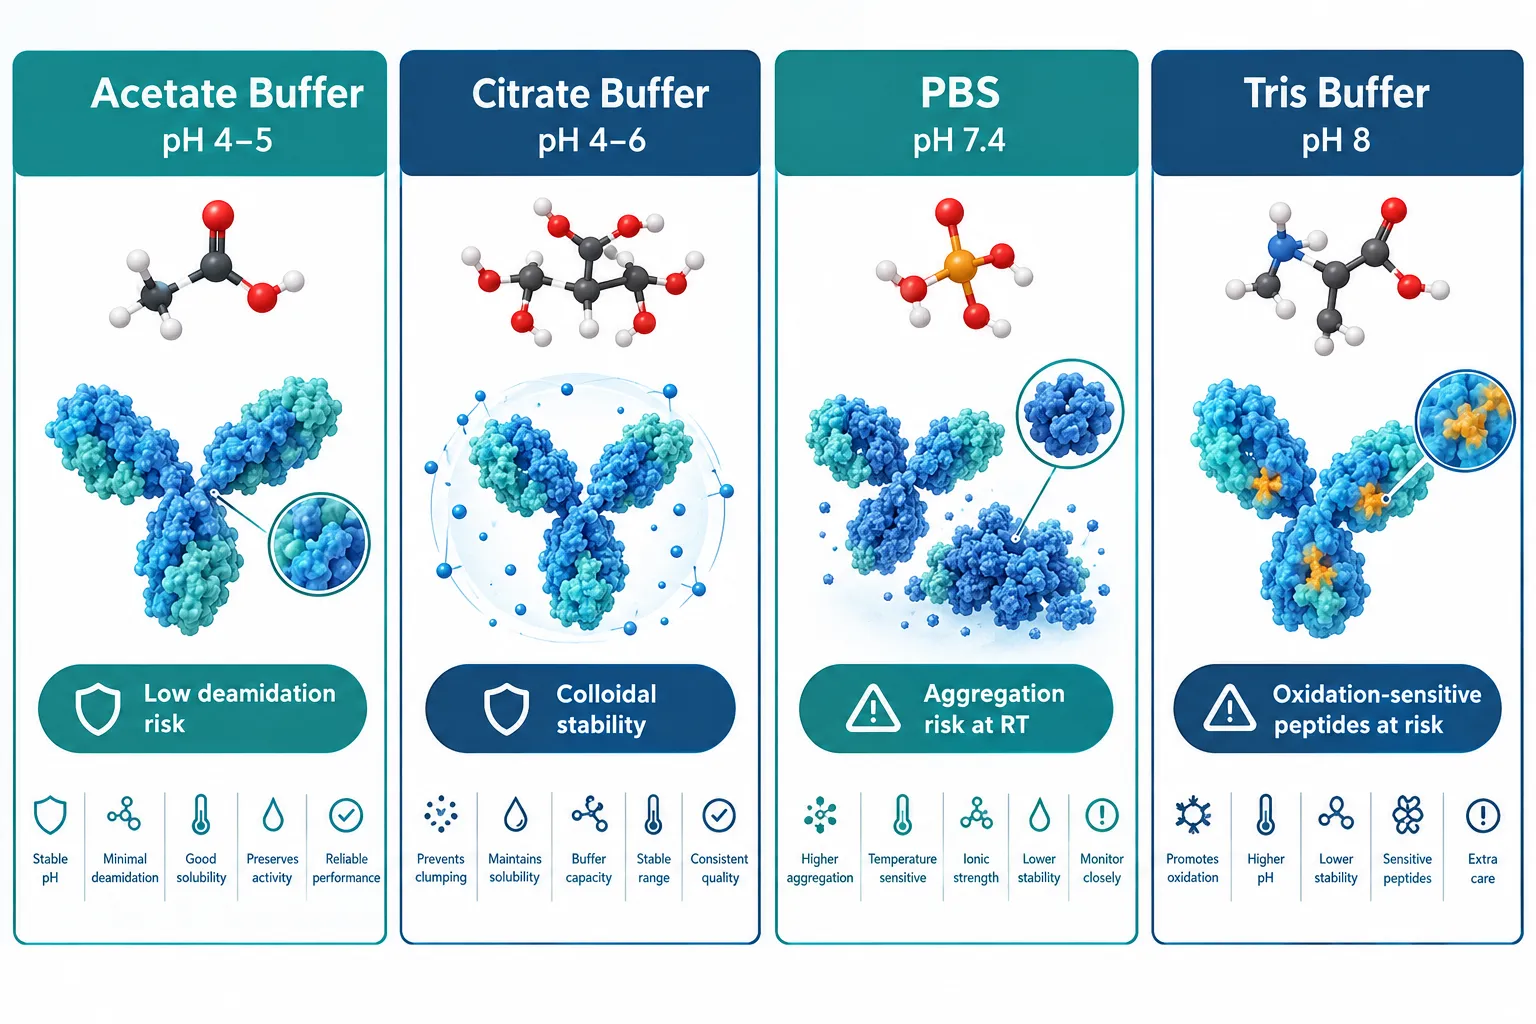
Acetate and citrate buffers at pH 4.0-6.0 have emerged as first-line vehicles for lab reconstitution. Both offer strong buffering capacity in the acidic range where most peptides show the lowest rates of deamidation and backbone hydrolysis. Citrate has the added advantage of mild metal-chelating activity, which is valuable for cysteine-containing and oxidation-sensitive sequences.

PBS (phosphate-buffered saline) at pH 7.4 remains widely used because it matches physiological conditions, but its limitations are now better characterized. At room temperature, PBS accelerates aggregation in hydrophobic peptides and offers no protection against oxidation. For short-term cell-based assays it is acceptable; for storage beyond 24 hours, it is a liability.

Tris and HEPES buffers (pH 7.5-8.0) are common in biochemistry but problematic for peptide stability. The alkaline environment accelerates deamidation of asparagine and glutamine residues and promotes beta-elimination in serine- and threonine-rich sequences.

"Buffer selection is not a formulation footnote, it is the first experimental variable that determines whether a peptide survives long enough to be tested."

Practical buffer selection by peptide class:

Peptide Class Recommended Buffer Target pH Key Risk Mitigated
GLP-class (e.g., GLP-3 analogs) Acetate or citrate 4.0-5.0 Hydrolysis, aggregation
Growth-hormone peptides (e.g., Sermorelin, CJC-1295) Acetate 4.5-5.5 Deamidation
Regenerative/antioxidant (e.g., SS-31, GHK-Cu) Citrate, pH-adjusted water 4.0-5.0 Oxidation, metal coordination
Nasal formulations (e.g., Semax) Citrate-phosphate 5.0-6.5 Mucosal compatibility, stability

Researchers working with SS-31 peptide should pay particular attention to citrate buffers, as the tetrapeptide's aromatic-cationic structure is sensitive to oxidative degradation at neutral or alkaline pH.


pH-Dependent Degradation Pathways: Mapping the Risk Zones

Every peptide has a pH-stability profile, and the degradation chemistry changes depending on where that profile sits.

Below pH 3.0: Acid-catalyzed hydrolysis of Asp-Pro bonds accelerates sharply. Peptides with proline-rich sequences or internal aspartate residues are particularly vulnerable.

pH 3.5-4.5 (optimal zone): For most peptides, this range minimizes both acid-catalyzed hydrolysis and base-catalyzed deamidation simultaneously. Solution purity data consistently show the slowest degradation rates here.

pH 5.0-6.5: Acceptable for many peptides, especially those destined for mucosal delivery. Deamidation begins to increase modestly above pH 5.5 for asparagine-containing sequences.

pH 7.0-8.0: Deamidation of Asn and Gln residues accelerates significantly. Beta-elimination in phosphorylated or glycosylated peptides also increases. Aggregation rates for hydrophobic sequences rise sharply.

Above pH 8.0: Racemization and disulfide scrambling become dominant degradation pathways. Cysteine-containing peptides are at high risk.

Researchers using GLP-3 peptide analogs should note that the long-chain fatty acid modifications common in this class increase hydrophobic aggregation risk at neutral pH, reinforcing the case for acidic reconstitution buffers.


Osmolality, Freeze, Thaw Cycles, and Practical Reconstitution Controls

Osmolality, Freeze, Thaw Cycles, and Practical Reconstitution Controls

Osmolality: The Overlooked Variable

Osmolality is frequently treated as relevant only for clinical formulations, but it matters in research too. For intranasal peptides such as Semax peptide formulations, osmolality outside the 270-320 mOsm/kg range can alter mucosal absorption and confound pharmacokinetic data. For parenteral research models, hyperosmolar solutions cause cell stress artifacts that distort results.

Achieving isotonicity in an acidic buffer requires careful addition of sodium chloride or mannitol. Mannitol is preferred when freeze-drying stability is also a concern, as it acts as a lyoprotectant.

Freeze, Thaw Cycles: Quantifying the Damage

Each freeze, thaw cycle introduces two distinct stresses:

  1. Ice crystal formation, mechanical disruption of peptide aggregates and concentration effects at the ice-liquid interface
  2. Cryoconcentration, solutes concentrate in unfrozen microdomains, creating transient local pH extremes and ionic strength spikes

Studies tracking purity over repeated cycles show measurable losses beginning at cycle two for most peptides, with cumulative degradation accelerating nonlinearly by cycle four or five. The practical implication is unambiguous: single-use aliquots are not optional.

Freeze, thaw mitigation checklist:

  • Aliquot into volumes that match a single experiment
  • Use cryoprotectants (5-10% mannitol or trehalose) when lyophilization is not available
  • Flash-freeze in liquid nitrogen rather than slow-freezing at -20°C
  • Store at -80°C; avoid -20°C for samples held longer than two weeks
  • Never refreeze a thawed aliquot

For complex blends such as Tesamorelin/CJC-1295/Ipamorelin reconstitution, each component has its own freeze, thaw sensitivity, making single-use aliquoting even more critical.

Order of Addition and Mixing

Lab-scale reconstitution protocols now emphasize that order of addition matters. Adding buffer to lyophilized peptide (rather than the reverse) prevents local pH extremes that can occur when a small volume of concentrated peptide contacts a large buffer volume. Gentle swirling, not vortexing, prevents shear-induced aggregation. Sonication is reserved for peptides confirmed to be aggregation-prone, and only in short, controlled pulses.


Stability Matrix Across Peptide Classes

Stability Matrix Across Peptide Classes

The table below consolidates stability variables across four research-relevant peptide classes. It is designed as a practical bench reference.

Variable GLP-Class Analogs Growth-Hormone Peptides Regenerative Peptides (SS-31, GHK-Cu) Nasal Peptides (Semax)
Optimal pH 4.0-5.0 4.5-5.5 4.0-5.0 5.0-6.5
Preferred buffer Acetate Acetate Citrate Citrate-phosphate
Osmolality target 280-310 mOsm/kg 280-310 mOsm/kg 280-310 mOsm/kg 270-320 mOsm/kg
Max freeze, thaw cycles 1-2 2-3 1-2 1
Primary degradation risk Aggregation, hydrolysis Deamidation Oxidation Mucosal pH mismatch
Cryoprotectant recommended Mannitol Mannitol or trehalose Trehalose Mannitol
Stable at -80°C (reconstituted) Up to 3 months Up to 6 months Up to 3 months Up to 4 weeks

Researchers sourcing SS-31 peptide for sale or GHK-Cu peptides should verify that third-party purity certificates reflect post-reconstitution stability data, not just pre-reconstitution synthesis purity.

For GLP-3 peptide research, the fatty acid-modified backbone demands particular attention to aggregation at the reconstitution step. Warming to room temperature before adding buffer, rather than adding cold buffer to a cold vial, reduces nucleation of aggregates.


Conclusion

Peptide reconstitution and stability, how buffer choice, pH, osmolality, and freeze, thaw cycles affect research samples, is a discipline that rewards systematic attention. The actionable steps are clear:

  1. Select buffer based on sequence chemistry, defaulting to acetate at pH 4.0-5.0 for most classes and citrate for oxidation-sensitive peptides.
  2. Verify osmolality before any intranasal or parenteral experiment; adjust with mannitol or NaCl.
  3. Aliquot immediately after reconstitution into single-use volumes and flash-freeze.
  4. Never exceed two freeze, thaw cycles for any peptide; treat cycle one as a warning threshold.
  5. Request purity data at multiple time points and pH values from suppliers, not just a single synthesis certificate.
  6. Match the stability matrix to the peptide class before the experiment begins, not after anomalous results appear.

Implementing these controls does not require expensive equipment. It requires deliberate protocol design and an understanding that every variable in the reconstitution environment is an experimental variable.

https://www.puretestedpeptides.com/wp-content/uploads/2026/09/peptide-reconstitution-and-stability-how-buffer-choice-ph-osmolality-and-freeze.webp 1024 1536 https://www.puretestedpeptides.com/wp-content/uploads/2026/01/buy-peptides-online.jpg 2026-09-23 13:07:532026-09-23 13:07:53Peptide Reconstitution and Stability: How Buffer Choice, pH, Osmolality, and Freeze–Thaw Cycles Affect Research Samples
How to Read Metabolic Research Endpoints: A Practical Guide to A1C, LDL, Triglycerides, Waist Circumference, and hsCRP

How to Read Metabolic Research Endpoints: A Practical Guide to A1C, LDL, Triglycerides, Waist Circumference, and hsCRP

September 23, 2026/0 Comments/in Uncategorized/by

Fewer than 20% of statin-treated patients with controlled LDL-C are actually free of residual cardiovascular risk, a gap that becomes visible only when researchers look beyond a single biomarker. This practical guide to reading metabolic research endpoints covers exactly that: how to interpret A1C, LDL, triglycerides, waist circumference, and hsCRP together, especially when evaluating studies on GLP-class peptides, MOTS-c analogs, and NNMT-related compounds where endpoint selection and baseline adjustment determine whether a result is meaningful or misleading.

Key Takeaways

  • No single metabolic endpoint tells the full story; A1C, LDL, triglycerides, waist circumference, and hsCRP each capture a distinct mechanism.
  • A1C targets in 2026 are stratified by hypoglycemia risk, age, and frailty, a numeric value must be read in that clinical context.
  • LDL-C interpretation depends entirely on the patient's cardiovascular risk tier; the same number can signal success or undertreatment.
  • hsCRP is now recognized as an independent predictor of cardiovascular events and should not be treated as a secondary or optional endpoint.
  • Waist circumference anchors biochemical endpoints to visceral adiposity and insulin resistance, making it a critical companion measure.

Understanding the Five Core Endpoints

A solid reading of metabolic research endpoints starts with knowing what each marker actually measures, and what it misses.

A1C (Glycated Hemoglobin)

A1C reflects average blood glucose over roughly three months. Current 2026 guidance from major diabetes organizations sets stratified targets rather than a single universal number. For most adults with type 2 diabetes at low hypoglycemia risk, an A1C of 6.5% or below is considered optimal. For frail elderly individuals, those with dementia, or those with recurrent severe hypoglycemia, a range of 7.1-8.5% is considered reasonable. In pediatric studies, a target below 7% applies to most children, with 6.5% achievable in low-risk youth with type 2 diabetes.

Critically, A1C alone is no longer sufficient in modern trials. Continuous glucose monitoring metrics, particularly time in range above 70%, must accompany A1C to confirm that a lower value was achieved safely rather than through excess hypoglycemia. When reviewing GLP-class compound studies, always ask: was the A1C reduction accompanied by improved time-in-range data?

LDL Cholesterol

LDL-C thresholds are tiered by cardiovascular risk category. For low-risk individuals, a value below 116 mg/dL is acceptable. Moderate-risk patients target below 100 mg/dL. High-risk patients aim for below 70 mg/dL, and very-high-risk patients, such as those post-acute coronary syndrome, target below 55 mg/dL. In individuals with recurrent ASCVD events, targets can fall below 40 mg/dL, with evidence showing continued benefit at even lower levels without identified safety concerns.

This tiered structure means a trial reporting an LDL-C of 68 mg/dL could represent excellent control in a moderate-risk primary prevention cohort but inadequate control in a secondary prevention population. Endpoint interpretation must always reference the appropriate risk category, not an absolute number in isolation.

Triglycerides

Triglycerides are increasingly recognized as contributors to residual cardiovascular risk, particularly in patients whose LDL-C is already at target. A normal fasting triglyceride level sits below 150 mg/dL, with values above 200 mg/dL considered high and above 500 mg/dL posing a risk for pancreatitis. Current guidelines remain LDL-centric, but accumulating evidence implicates elevated triglycerides and remnant lipoproteins as independent risk factors. Upcoming guideline revisions are expected to formalize more explicit triglyceride-based goals. In studies of compounds like retatrutide endpoints or GLP-3 peptides, triglyceride data should be treated as a leading indicator of future threshold shifts, not a secondary footnote.

Waist Circumference

Waist circumference is a practical proxy for visceral adiposity and insulin resistance. Standard thresholds flag elevated risk at above 88 cm in women and above 102 cm in men, though ethnicity-adjusted values are increasingly used. In cardiometabolic trials, waist circumference anchors biochemical endpoints to actual body composition. An improvement in A1C and LDL-C without a reduction in waist circumference may indicate partial but incomplete metabolic risk modification. Research on visceral fat outcomes consistently shows that central adiposity independently predicts insulin resistance, dyslipidemia, and cardiovascular events beyond what lipid panels capture alone.

hsCRP (High-Sensitivity C-Reactive Protein)

hsCRP is the most robust available biomarker of residual inflammatory cardiovascular risk. A value at or above 2 mg/L is now classified as a risk-enhancing factor in ASCVD prevention guidelines, and universal screening in both primary and secondary prevention is recommended as of 2026. Elevated hsCRP predicts major adverse cardiovascular events over decades of follow-up, and it remains strongly predictive of recurrent events even in statin-treated patients with normal LDL-C. In trials, a substantial fall in LDL-C without a corresponding reduction in hsCRP leaves significant vascular risk unaddressed.


Understanding the Five Core Endpoints

Why One Biomarker Cannot Stand In for a Complete Mechanism

The most common error in reading metabolic research is treating a single endpoint as a surrogate for the full cardiometabolic picture. This matters especially when evaluating compounds that operate through multiple pathways.

Consider a study on a GLP-class compound that reports a 1.2% reduction in A1C. That result is clinically meaningful, but it tells nothing about whether LDL-C moved, whether hsCRP fell, or whether waist circumference changed. A compound that lowers glucose while leaving visceral fat and systemic inflammation untouched has addressed only one of several interconnected mechanisms. For context on how polypeptide compounds differ from small-molecule drugs in their cardiometabolic effects, the analysis of tesofensine, GLP-3, retatrutide, and GLP-2-T illustrates why endpoint panels must match the mechanism being tested.

The same logic applies to MOTS-c research. MOTS-c is a mitochondria-derived peptide that influences insulin sensitivity and energy metabolism. A trial measuring only A1C misses the compound's potential effects on lipid oxidation, triglyceride clearance, and inflammatory signaling. Similarly, NNMT (nicotinamide N-methyltransferase) inhibition research, relevant to compounds like 5-amino-1MQ, targets metabolic reprogramming at the cellular level, where waist circumference and hsCRP may be more sensitive endpoints than A1C in short-duration studies.

Baseline adjustment is equally critical. A trial that does not stratify participants by baseline hsCRP, cardiovascular risk tier, or waist circumference cannot isolate the compound's effect from baseline population differences. A participant with an hsCRP of 0.5 mg/L at baseline has a fundamentally different inflammatory risk profile than one entering the study at 4 mg/L. Reporting a mean hsCRP change without this stratification obscures whether the compound meaningfully reduced inflammatory risk or simply reflected a low-inflammation cohort at the outset.

Key interpretive principle: In cardiometabolic research, endpoint panels should map directly to the compound’s proposed mechanism. Selecting endpoints that the compound is unlikely to affect, or omitting endpoints that it plausibly would affect, introduces systematic bias into the interpretation of results.

Why One Biomarker Cannot Stand In for a Complete Mechanism

A Practical Framework for Reading Metabolic Research Endpoints

The following framework applies directly when reviewing trial data on cardiometabolic compounds, including those studied in the context of tesa benefits for visceral fat reduction or SS-31 elamipretide for mitochondrial and cardiometabolic function.

Step Action Key Question
1 Establish baseline risk tier What was the population's cardiovascular risk category at enrollment?
2 Contextualize A1C Was the change accompanied by CGM time-in-range data? Was hypoglycemia tracked?
3 Apply LDL risk-tier target Does the reported LDL-C meet the threshold appropriate for this cohort's risk level?
4 Assess triglycerides and non-HDL Were remnant lipoproteins measured alongside LDL-C?
5 Cross-reference hsCRP and waist Did inflammatory burden and central adiposity change in the same direction as biochemical endpoints?

A Practical Framework for Reading Metabolic Research Endpoints

Reading the endpoints together reveals the mechanism. A compound that lowers A1C, reduces waist circumference, and decreases hsCRP is likely acting on insulin sensitivity, visceral fat, and systemic inflammation simultaneously, a genuinely comprehensive cardiometabolic effect. A compound that lowers only LDL-C may be addressing lipid transport without touching the inflammatory or adiposity components of risk.

Non-HDL cholesterol deserves mention here. Because it captures LDL plus remnant lipoproteins, non-HDL is a more complete lipid endpoint than LDL-C alone. In UK cardiovascular prevention audits, non-HDL targets of 2.6 mmol/L or below are used alongside LDL targets to judge treatment adequacy. Trials that report only LDL-C without non-HDL leave the remnant lipoprotein contribution to risk unaccounted for.


Conclusion

Reading metabolic research endpoints accurately requires treating A1C, LDL, triglycerides, waist circumference, and hsCRP as a complementary panel rather than interchangeable alternatives. Each marker captures a distinct biological mechanism, and no single value substitutes for the full picture.

Actionable next steps for researchers and informed readers:

  • When reviewing a trial, check whether the endpoint panel matches the compound's proposed mechanism of action.
  • Confirm that A1C results are accompanied by CGM-derived time-in-range data and hypoglycemia rates.
  • Identify the study population's cardiovascular risk tier before judging whether an LDL-C value represents success or residual undertreatment.
  • Treat hsCRP as a primary endpoint in any study involving inflammatory pathways, not a supplementary add-on.
  • Flag any trial that reports improvements in biochemical markers without measuring waist circumference, central adiposity may be the missing variable explaining why risk did not fully resolve.

The field is moving toward multi-endpoint cardiometabolic panels as the standard for evaluating both pharmaceutical and peptide-based interventions. Understanding how to read those panels is the foundational skill for interpreting the next generation of metabolic research.

https://www.puretestedpeptides.com/wp-content/uploads/2026/09/how-to-read-metabolic-research-endpoints-a-practical-guide-to-a1c-ldl-triglyceri.webp 1024 1536 https://www.puretestedpeptides.com/wp-content/uploads/2026/01/buy-peptides-online.jpg 2026-09-23 13:07:522026-09-23 13:07:52How to Read Metabolic Research Endpoints: A Practical Guide to A1C, LDL, Triglycerides, Waist Circumference, and hsCRP
Research Peptide Quality Control: How to Interpret COAs, HPLC Purity, Mass Spectrometry, Endotoxin, and Sterility Data

Research Peptide Quality Control: How to Interpret COAs, HPLC Purity, Mass Spectrometry, Endotoxin, and Sterility Data

September 23, 2026/0 Comments/in Uncategorized/by

Fewer than 30% of research peptide suppliers voluntarily publish all four core quality metrics on a single document, yet every one of those metrics answers a fundamentally different question about what is actually inside the vial. Understanding Research Peptide Quality Control: How to Interpret COAs, HPLC Purity, Mass Spectrometry, Endotoxin, and Sterility Data is not a matter of comparing numbers on a spec sheet; it is a matter of knowing what each test can prove, what it cannot, and where critical gaps remain.

Key Takeaways

  • A Certificate of Analysis (COA) is only as reliable as the tests it includes, always verify which assays were performed and by whom.
  • HPLC purity confirms the proportion of the target peptide but cannot confirm molecular identity or detect endotoxins.
  • Mass spectrometry confirms identity but does not quantify impurities or detect microbial contamination.
  • Endotoxin and sterility testing require entirely separate microbiological assays that HPLC and MS cannot replace.
  • Net peptide content, water, counterion load, and heavy metals are distinct from purity and must be reported separately.

What a Modern Peptide COA Should Contain

What a Modern Peptide COA Should Contain

A Certificate of Analysis is the primary quality document a researcher receives with a peptide order. In 2026, comprehensive supplier SOPs treat the COA as a multi-assay summary, not a single-number report. A well-constructed COA should include, at minimum:

COA Field What It Proves
Peptide sequence / identity Correct amino acid composition
HPLC purity (% area) Proportion of target compound
Molecular weight (MS confirmed) Correct molecular identity
Net peptide content (%) Actual peptide mass excluding water and salts
Endotoxin level (EU/mg or EU/mL) Bacterial contamination risk
Sterility / microbial limits Absence of viable microorganisms
Counterion and water content Accurate dosing calculation
Batch number and date Traceability and reproducibility

Four critical checks for any COA:

  1. Is the testing laboratory third-party or in-house? Third-party testing reduces conflict of interest.
  2. Are the test methods named (e.g., USP, ISO, LAL)? Named methods are reproducible and auditable.
  3. Does the document carry a batch-specific lot number? Generic COAs not tied to a specific lot are unreliable.
  4. Is net peptide content reported separately from HPLC purity? These are not the same figure.

When evaluating suppliers for specific compounds, such as those found in SS-31 10mg research peptide considerations or Ipamorelin peptide for sale listings, confirming all four checks before ordering is a baseline requirement.


Interpreting HPLC Purity and Mass Spectrometry Data

Interpreting HPLC Purity and Mass Spectrometry Data

HPLC Purity: What the Chromatogram Actually Measures

High-Performance Liquid Chromatography (HPLC) separates compounds by how they interact with a stationary phase. The resulting chromatogram shows peaks representing each component. Purity is reported as the area percentage of the target peak relative to all detected peaks.

Typical thresholds for research-grade peptides in 2026:

  • Greater than or equal to 98%, preferred for most in vitro and cell-based research
  • 95-97%, acceptable for some exploratory studies; impurity profile should still be disclosed
  • Below 95%, generally insufficient for publication-quality research

"HPLC purity tells you how much of the detected signal belongs to the target peptide. It does not tell you what the target peptide actually is."

This distinction matters. A degraded peptide fragment with a similar retention time can inflate the apparent purity figure. Oxidized methionine residues, truncated sequences, and epimers may co-elute with the parent compound depending on the column and gradient used.

Mass Spectrometry: Confirming Identity, Not Purity

Mass spectrometry (MS) measures the mass-to-charge ratio of ionized molecules. For peptide identity confirmation, the measured monoisotopic or average molecular weight is compared against the theoretical value calculated from the amino acid sequence.

Acceptable error windows in modern practice:

  • Electrospray ionization (ESI-MS): within ±0.5 Da or ±0.1% of theoretical mass, whichever is smaller
  • High-resolution MS: within ±5 ppm

MS confirms that a molecule of the correct mass is present. It does not quantify what fraction of the sample that molecule represents. This is why HPLC and MS are complementary, not interchangeable. Researchers sourcing compounds like MT-2 research peptide or GLP-3 peptides for sale should expect both tests on every COA, not one or the other.

Net Peptide Content: The Often-Overlooked Figure

Lyophilized peptides contain water (typically 5-15%) and counterions such as trifluoroacetate (TFA) or acetate. Net peptide content accounts for these and reports the actual mass of peptide per total mass of powder. A vial labeled "10 mg" with 75% net peptide content delivers only 7.5 mg of active compound. Accurate dosing in research depends on this figure.


Endotoxin Testing and Sterility Data in Research Peptide Quality Control

Endotoxin Testing and Sterility Data in Research Peptide Quality Control

Why HPLC and MS Cannot Address Contamination

This is one of the most consequential misunderstandings in peptide procurement. HPLC and MS detect chemical entities, they are blind to bacterial endotoxins, mycoplasma, and viable microorganisms. A peptide can show 99% HPLC purity and confirmed MS identity while carrying a significant endotoxin burden that invalidates cell-based assay results or causes inflammatory artifacts in animal models.

Endotoxin testing methods used by reputable suppliers include:

  • Limulus Amebocyte Lysate (LAL) assay, the established gold standard, with gel-clot, turbidimetric, and chromogenic variants
  • Recombinant Factor C (rFC) assay, increasingly adopted in 2026 as a sustainable alternative with comparable sensitivity

Understanding Endotoxin Limits

Context determines what endotoxin level is acceptable:

  • FDA clinical limits for parenteral drugs: 5 EU/kg/hour (approximately 0.5 EU/mL for most intravenous products)
  • Research-grade in vitro work: many suppliers target less than 1 EU/mg, though thresholds vary by application
  • In vivo animal research: stricter limits apply; even sub-clinical endotoxin loads can confound cytokine and metabolic endpoints

"Research-grade does not mean endotoxin-free. It means the supplier has characterized the contamination level, and the researcher must decide whether that level is acceptable for their specific model."

For studies involving compounds such as those discussed in SS-31 peptides for sale or IPA Sermorelin stack research, endotoxin data is especially relevant because these peptides are commonly used in models sensitive to inflammatory confounders.

Sterility Data: What "Research-Grade" Claims Actually Mean

Sterility testing under USP or ISO standards requires incubation of the sample in growth media for 14 days to detect viable organisms. Many research-grade suppliers do not perform full sterility testing; instead, they may report bioburden limits or microbial limits testing (MLT), which counts colony-forming units but does not guarantee sterility.

Researchers should distinguish between:

  • Sterility tested, full 14-day compendial test, result is pass/fail
  • Bioburden tested, quantitative count of viable organisms; not equivalent to sterility
  • No microbial data, the COA is silent on contamination; highest risk category

In 2026, a growing number of research suppliers are adopting routine endotoxin and bioburden testing as standard rather than optional. When evaluating a supplier's documentation for peptides like those in the where to buy research-grade Glow Blend peptide guide, confirming that endotoxin and microbial data appear on the COA, not just HPLC purity, separates rigorous suppliers from those providing incomplete documentation.


Conclusion

Evaluating Research Peptide Quality Control: How to Interpret COAs, HPLC Purity, Mass Spectrometry, Endotoxin, and Sterility Data requires treating each assay as a distinct lens on a different quality dimension. No single test is sufficient.

Actionable next steps for researchers:

  1. Request the full COA before ordering, not a sample or generic document. Confirm it is batch-specific.
  2. Verify that both HPLC and MS data are present, identity and purity must be confirmed independently.
  3. Check net peptide content, not just HPLC purity, for accurate dosing calculations.
  4. Demand endotoxin data expressed in EU/mg or EU/mL, with the test method named.
  5. Clarify sterility vs. bioburden, ask the supplier directly which test was performed and under what standard.
  6. Assess batch-to-batch consistency by requesting COAs from multiple lots when reproducibility matters to the study design.

Quality documentation is not a formality. It is the foundation on which valid research conclusions are built.

https://www.puretestedpeptides.com/wp-content/uploads/2026/09/research-peptide-quality-control-how-to-interpret-coas-hplc-purity-mass-spectrom.webp 1024 1536 https://www.puretestedpeptides.com/wp-content/uploads/2026/01/buy-peptides-online.jpg 2026-09-23 13:07:362026-09-23 13:07:36Research Peptide Quality Control: How to Interpret COAs, HPLC Purity, Mass Spectrometry, Endotoxin, and Sterility Data
Retatrutide Mechanism Explained: How GIP, GLP-1, and Glucagon Signaling Differ From Single-Incretin Models

Retatrutide Mechanism Explained: How GIP, GLP-1, and Glucagon Signaling Differ From Single-Incretin Models

September 23, 2026/0 Comments/in Uncategorized/by

Obesity drug development spent decades chasing a single receptor. Retatrutide broke that convention by engaging three simultaneously, and the metabolic consequences are not simply additive. Understanding the retatrutide mechanism explained through its GIP, GLP-1, and glucagon signaling offers a clearer picture of why this triple-agonist behaves so differently from earlier single-incretin models and why its clinical results have drawn serious scientific attention in 2026.

Key Takeaways

  • Retatrutide activates GIP, GLP-1, and glucagon receptors through a shared Gs-cAMP-PKA signaling cascade, but each receptor produces distinct downstream tissue effects.
  • The glucagon arm is the primary differentiator from dual-agonist drugs like tirzepatide, driving thermogenesis and hepatic fat clearance beyond what incretin signaling alone can achieve.
  • Triple-receptor engagement produces synergistic, not merely additive, metabolic effects across the pancreas, brain, adipose tissue, and liver.
  • Phase 2 clinical data show weight loss approaching bariatric surgery benchmarks, a threshold no approved single-incretin drug has reached.
  • The tolerability profile is broadly comparable to GLP-1 analogues, though the glucagon arm requires careful dose calibration to avoid hyperglycemia risk.

The Shared Signaling Foundation: Gs-cAMP-PKA Across All Three Receptors

All three receptors targeted by retatrutide, the GIP receptor (GIPR), the GLP-1 receptor (GLP-1R), and the glucagon receptor (GCGR), belong to the class B G-protein-coupled receptor (GPCR) family. When retatrutide binds any of them, it activates the stimulatory G-protein (Gs), which triggers adenylyl cyclase to produce cyclic AMP (cAMP). Rising cAMP activates protein kinase A (PKA), initiating downstream transcription and cellular responses.

The Shared Signaling Foundation: Gs-cAMP-PKA Across All Three Receptors

This shared architecture is important because it means retatrutide does not need to operate through fundamentally different biochemical languages at each receptor. What differs is the tissue distribution of each receptor and the physiological programs those receptors control once PKA is activated.

"The molecular key is the same; what changes is which door it opens, and in which organ."

  • GIPR is expressed heavily in adipose tissue, bone, and the gut, with moderate pancreatic beta-cell presence.
  • GLP-1R is concentrated in pancreatic beta cells, the hypothalamus, the brainstem, and the stomach.
  • GCGR is dominant in the liver, adipose tissue, and the heart, with a smaller presence in the brain.

This tissue map is the first reason why a triple-agonist produces effects that a single-incretin model simply cannot replicate.


How the Three Receptor Arms Differ: A Retatrutide Mechanism Explained Comparison

GLP-1 Receptor Signaling: The Established Anchor

GLP-1R activation is the best-understood arm. In the pancreas, it amplifies glucose-dependent insulin secretion and suppresses glucagon release from alpha cells. In the hypothalamus and brainstem, GLP-1R signaling reduces appetite and slows gastric emptying. These effects underpin the entire class of GLP-1 analogues, semaglutide, liraglutide, and they are fully preserved in retatrutide.

Explore the broader landscape of GLP-1 Reta research to understand how this receptor arm is positioned within the compound's overall profile.

GIP Receptor Signaling: The Tolerability and Fat-Tissue Modifier

GIPR activation was historically undervalued because early GIP-only studies produced modest glycemic effects. The dual-agonist tirzepatide changed that perspective by showing that GIPR co-activation potentiates GLP-1R signaling and improves tolerability, likely by reducing nausea through central mechanisms.

In adipose tissue, GIPR activation promotes lipid uptake and storage in a way that, paradoxically, appears to support fat redistribution rather than simple fat accumulation when combined with the energy-expenditure signals from the glucagon arm. GIPR also has roles in bone turnover and may influence the gut microbiome, though these remain active research questions.

Glucagon Receptor Signaling: The Differentiating Engine

The GCGR arm is what most sharply separates retatrutide from all approved single-incretin and dual-incretin drugs. Glucagon is classically viewed as a counter-regulatory hormone that raises blood glucose, which is exactly why adding glucagon agonism to an obesity drug seems counterintuitive at first.

The resolution lies in context and dose calibration. At the modest glucagon receptor activity built into retatrutide's design, the dominant effects are:

  1. Hepatic fat mobilization, GCGR activation in the liver promotes fatty acid oxidation and reduces hepatic lipid accumulation, making retatrutide particularly relevant for metabolic-associated steatotic liver disease (MASLD).
  2. Thermogenesis, Glucagon signaling in brown adipose tissue and the liver increases basal energy expenditure, a mechanism absent from GLP-1-only models.
  3. Satiety reinforcement, Central GCGR signaling in the hypothalamus contributes an additional appetite-suppressing signal independent of GLP-1R.

The glycemic risk from glucagon agonism is counterbalanced by the simultaneous GLP-1R-driven insulin secretion. This built-in counterweight is a deliberate pharmacological feature, not a coincidence.


Triple-Receptor Synergy vs. Single-Incretin Models: Why the Math Is Not Additive

The most important conceptual shift in understanding the retatrutide mechanism is recognizing that the three arms interact, not merely coexist.

Triple-Receptor Synergy vs. Single-Incretin Models: Why the Math Is Not Additive

Key distinction: Single-incretin drugs reduce appetite and improve insulin sensitivity. Triple-agonism does both of those things while simultaneously increasing energy expenditure, a third lever that single-incretin models do not meaningfully pull.
Mechanism GLP-1 Analogue Dual Agonist (GIP+GLP-1) Retatrutide (Triple)
Insulin secretion Strong Strong Strong
Appetite suppression Strong Strong Strong
Adipose tissue signaling Indirect Direct (GIPR) Direct (GIPR)
Hepatic fat clearance Modest Modest Significant (GCGR)
Thermogenesis / EE Minimal Minimal Meaningful (GCGR)
Tolerability support Baseline Improved Comparable to dual

This multi-lever action explains why phase 2 trial data for retatrutide have shown mean weight reductions exceeding 24% of body weight at the highest doses over 48 weeks, figures that approach outcomes historically associated with bariatric surgery. Researchers following Retatrutide clinical trials can track how these mechanistic predictions have translated into human outcomes.

For a useful contrast with non-incretin appetite modulation, the Tesofensine mechanism explained article outlines how noradrenergic pathways differ from this receptor-based approach.


Safety Profile, Open Questions, and the Road Ahead

Retatrutide's tolerability profile in trials has been broadly consistent with the GLP-1 drug class: nausea, vomiting, and diarrhea are the most common adverse events, predominantly dose-dependent and transient. The glucagon arm has not produced clinically significant hyperglycemia in non-diabetic participants, validating the pharmacological counterbalance design. Lean mass preservation remains an area of ongoing investigation, as with all potent weight-loss agents.

Safety Profile, Open Questions, and the Road Ahead

As of late 2026, retatrutide remains in late-stage clinical development and has not received regulatory approval in any major market. Phase 3 cardiovascular outcomes data are awaited, and the compound's long-term effects on bone density, given the GIPR's known skeletal role, are still being characterized.

Research-grade material is available for preclinical investigation. Those sourcing it can review options such as Reta 20mg for sale or browse the GLP Reta product category for available formats.

The broader industry is already exploring next-generation molecules that add a fourth receptor target, such as amylin or FGF21, to the triple-agonist scaffold, suggesting that retatrutide may represent a transitional rather than terminal point in metabolic pharmacology.


Conclusion

The retatrutide mechanism explained through its GIP, GLP-1, and glucagon signaling reveals a compound that is architecturally distinct from single-incretin models in three concrete ways: it adds a direct adipose-tissue signal via GIPR, it introduces a thermogenic and hepatic fat-clearing engine via GCGR, and it produces synergistic cross-receptor effects that no single or dual-incretin drug can replicate. For researchers and clinicians tracking this space, the actionable next steps are clear:

  • Follow phase 3 data closely, particularly cardiovascular outcomes and lean mass metrics, as these will determine the real-world risk-benefit profile.
  • Distinguish mechanism from marketing, the glucagon arm is the true differentiator; any future triple-agonist without it is functionally a dual-incretin drug.
  • Monitor regulatory timelines across the US, EU, and key Asian markets, where approval decisions could arrive within the next 12 to 24 months.
  • Engage with preclinical research responsibly, using verified, research-grade material from reputable sources when conducting laboratory investigations.

The triple-receptor model has redefined what metabolic pharmacology can achieve. Understanding the mechanism is the foundation for evaluating everything that follows.

https://www.puretestedpeptides.com/wp-content/uploads/2026/09/retatrutide-mechanism-explained-how-gip-glp-1-and-glucagon-signaling-differ-from.webp 1024 1536 https://www.puretestedpeptides.com/wp-content/uploads/2026/01/buy-peptides-online.jpg 2026-09-23 13:07:202026-09-23 13:07:20Retatrutide Mechanism Explained: How GIP, GLP-1, and Glucagon Signaling Differ From Single-Incretin Models
Page 12 of 81«‹1011121314›»
×

Helpful Links

  • My account
  • Cart
  • Checkout
  • Refund and Returns Policy
  • Privacy Policy
  • SMS Privacy Policy
  • Login
  • My Account
  • Logout

USA Made Lab Tested Peptides

All products are sold for research, laboratory, or analytical purposes only, and are not for human consumption


Pure Tested Peptides is a chemical supplier. Pure Tested Peptides is not a compounding / chemical compounding facility as defined under 503A of the Federal Food, Drug, and Cosmetic act. Pure Tested Peptides is not an outsourcing facility as defined under 503B of the Federal Food, Drug, and Cosmetic act.

The statements made within this website have not been evaluated by the US Food and Drug Administration. The products we offer are not intended to diagnose, treat, cure or prevent any disease.

Human/Animal Consumption Prohibited. Laboratory/In-Vitro Experimental Use Only

Scroll to top Scroll to top Scroll to top