

How to Interpret Weight Loss, A1C, and Discontinuation Rates in Retatrutide Research
"

A single phase-2 trial published in the New England Journal of Medicine reported mean body-weight reductions exceeding 17% at 24 weeks, a number that reshaped expectations for the entire incretin drug class. Yet that headline figure conceals at least six methodological layers that any serious researcher must unpack before drawing conclusions. Understanding how to interpret weight loss, A1C, and discontinuation rates in retatrutide research is not optional; it is the difference between actionable data and misleading benchmarks.
Key Takeaways
- Percent weight loss and absolute weight loss tell different stories; always identify which metric a study reports.
- A1C reductions must be read alongside baseline glycemic status, exposure duration, and dose level.
- Discontinuation rates introduce survivorship bias; completer-only analyses inflate efficacy estimates.
- Dose-escalation schedules vary across trials and directly affect both tolerability and endpoint timing.
- Missing-data handling methods, such as last observation carried forward versus modified intent-to-treat, materially change how results should be interpreted.
Understanding the Metrics: A Research Checklist for Retatrutide Trials
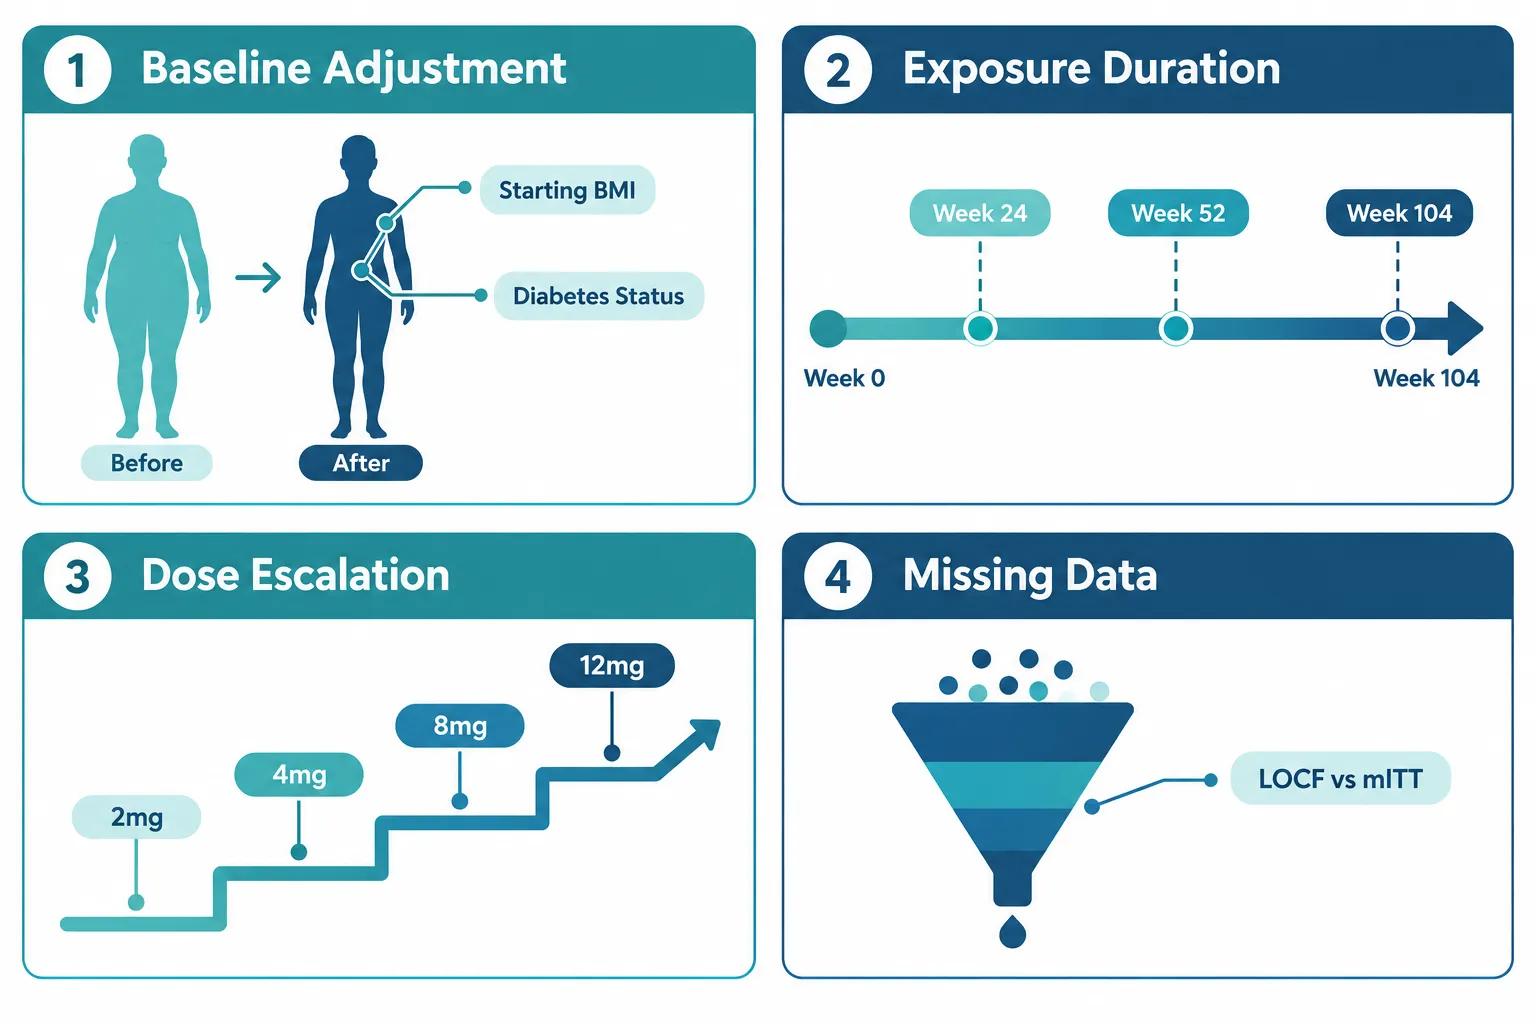
Before examining any specific endpoint, researchers reviewing retatrutide clinical trial data should build a structured checklist. Six variables consistently determine whether a reported number is comparable across studies.
1. Baseline adjustment. Weight-loss figures are meaningful only when the starting population is defined. TRIUMPH-3, the phase-3 obesity trial, enrolled adults with BMI of 30 or above without type 2 diabetes. TRIUMPH-2 enrolled adults with established type 2 diabetes, a population that typically shows attenuated weight loss due to disease-related metabolic differences. Comparing raw percentage figures between these two cohorts without baseline adjustment produces misleading conclusions.
2. Exposure duration. Long-term extension data from 2026 show approximately 30% mean weight loss at 104 weeks, roughly double the 24-week phase-2 figure. Researchers must anchor every efficacy claim to the exact week of assessment. A "24-week result" and a "2-year result" are not interchangeable data points.
3. Dose-escalation protocol. Retatrutide is titrated upward through multiple dose levels (commonly 2 mg, 4 mg, 8 mg, and 12 mg). Studies that terminate at lower doses or that allow slower escalation will report lower efficacy and potentially different tolerability profiles. Always confirm which dose was active at the time of the reported endpoint.
4. Missing-data handling. The modified intent-to-treat (mITT) population includes all randomized participants who received at least one dose. Last observation carried forward (LOCF) substitutes the final recorded value for participants who dropped out. These two approaches can shift reported weight loss by several percentage points. TRIUMPH-3 used mITT analysis; researchers comparing it to earlier phase-2 data should verify that the same convention was applied.
5. Responder rates versus mean change. A mean weight loss of 24% can mask a bimodal distribution where a subset of participants lost 40% and another subset lost less than 10%. Responder analyses, reporting the proportion achieving at least 5%, 10%, or 15% body-weight reduction, provide a more complete picture for visceral fat research contexts.
6. Tolerability and its interaction with efficacy. Gastrointestinal adverse events are the primary driver of early discontinuation. Participants who tolerate the drug long enough to reach maximum dose will inevitably show better outcomes than the full randomized group. This creates a systematic upward bias in completer analyses.
How to Interpret A1C Data in Retatrutide Research
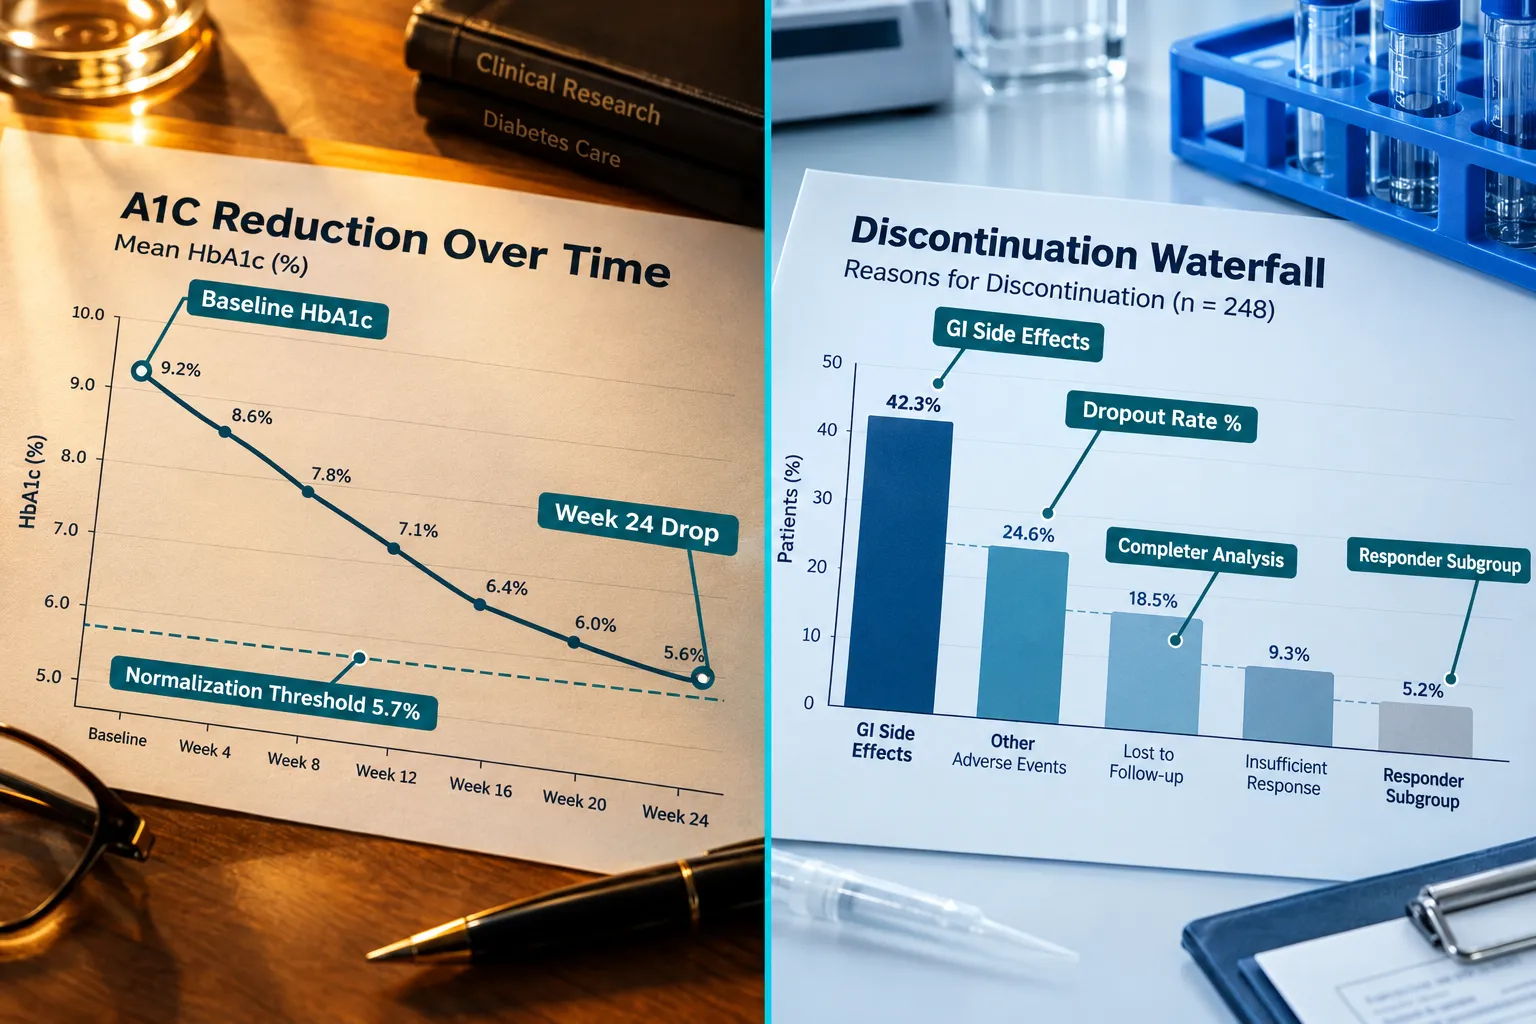
TRIUMPH-2 and the TRANSCEND-T2D-1 trial provide the most detailed glycemic data available as of 2026. TRANSCEND-T2D-1 reported A1C normalization, defined as reaching below 5.7%, in a substantial proportion of participants with type 2 diabetes, a result that positions retatrutide well above standard-of-care benchmarks. However, interpreting these numbers requires the same checklist discipline applied to weight-loss data.
"An A1C reduction from 8.5% to 6.2% and a reduction from 7.1% to 5.6% both represent meaningful clinical change, but they are not equivalent achievements and should never be averaged without stratification."
Baseline glycemic status matters most. A participant entering a trial with an A1C of 9% has more room to show a dramatic reduction than one starting at 7.2%. Meta-analytic reviews from 2025 and 2026 consistently flag this as the largest source of heterogeneity across retatrutide glycemic studies.
Concurrent weight loss confounds attribution. Because retatrutide acts on GLP-1, GIP, and glucagon receptors simultaneously, A1C improvements reflect both direct receptor-mediated effects and indirect benefits from weight reduction. Researchers should look for subgroup analyses that isolate glycemic response in participants with minimal weight loss to disentangle these mechanisms.
Dose level and A1C. Higher doses correlate with greater A1C reductions, but the dose-response curve flattens above 8 mg in most reported analyses. Citing an A1C result without specifying the active dose renders the figure nearly uninterpretable.
For researchers exploring related GLP-1 Reta receptor agonist mechanisms, understanding how triple-agonist activity differs from dual-agonist comparators is essential context for any glycemic endpoint.
Discontinuation Rates and What They Mean for Research Validity
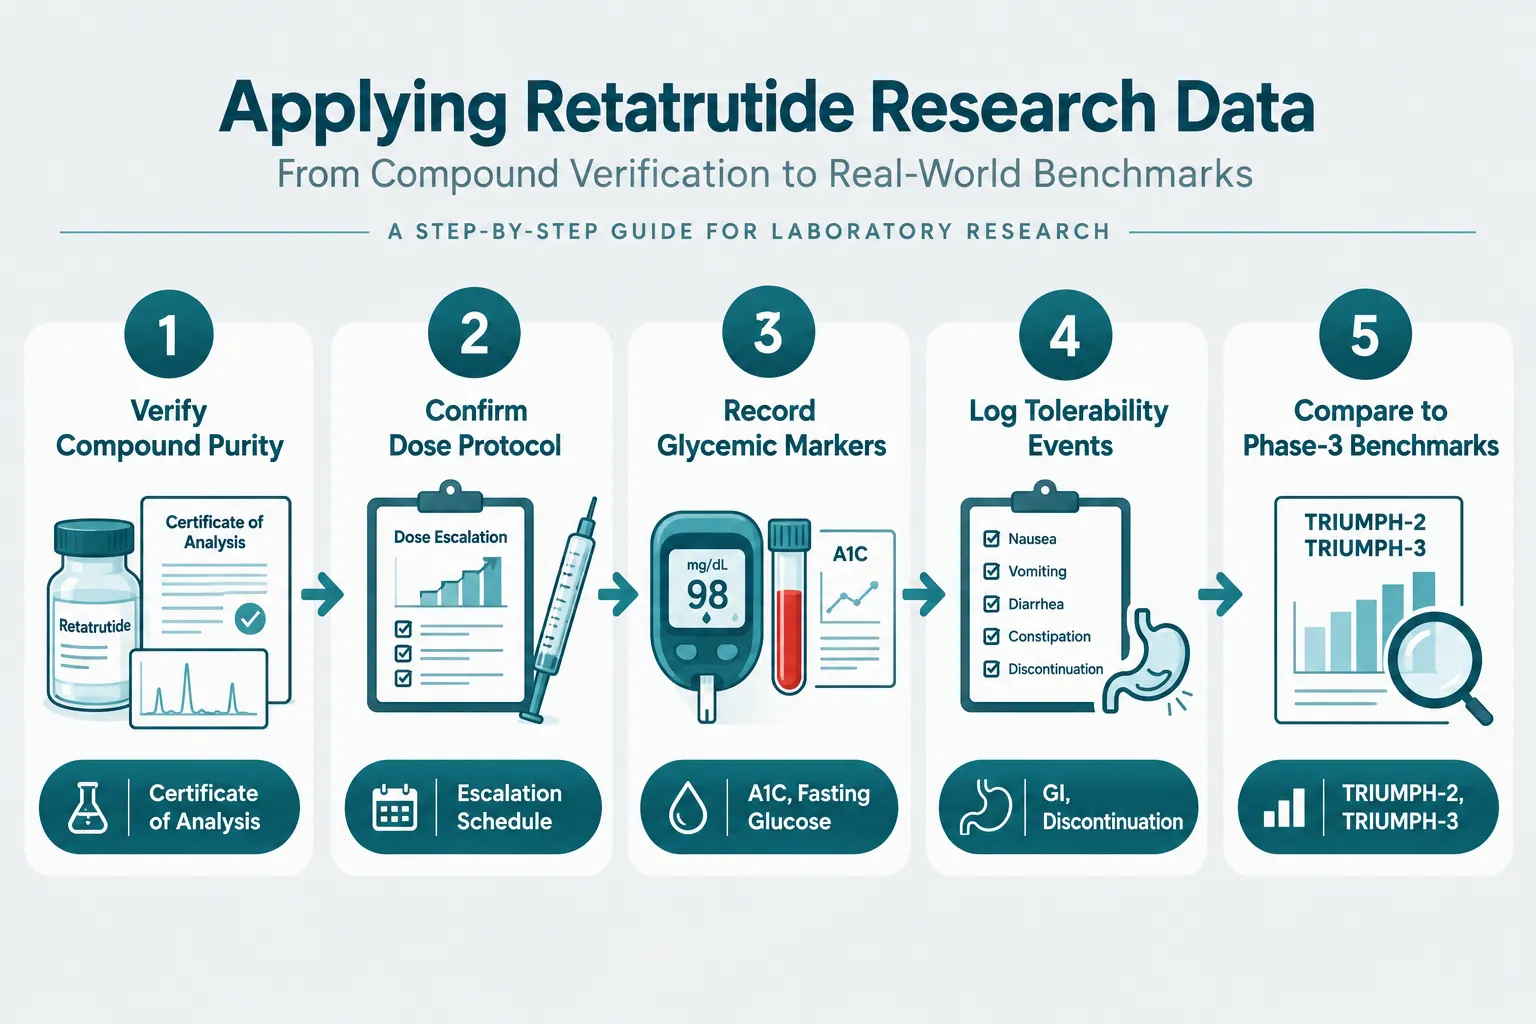
TRIUMPH-3 reported discontinuation rates that, while lower than some earlier incretin trials, still warrant careful analysis. Approximately 10 to 16% of participants discontinued due to adverse events, primarily nausea, vomiting, and diarrhea, rates consistent with the class but not trivial.
Why discontinuation bias matters. When a trial reports efficacy only in completers, the remaining sample is systematically healthier and more tolerant. This is survivorship bias in its most direct form. A rigorous reading of how to interpret weight loss, A1C, and discontinuation rates in retatrutide research demands that readers identify whether the primary endpoint was calculated on the full mITT population or on completers only.
Sensitivity analyses are the gold standard. Well-designed trials include sensitivity analyses that model what outcomes would have looked like if all dropouts had remained on treatment. When sensitivity analyses produce results close to the primary analysis, confidence in the headline number increases substantially.
Safety signals from uncontrolled sources. Independent reporting in late 2026 highlighted safety concerns associated with counterfeit or improperly dosed buy Reta products circulating outside regulated research channels. These cases introduce noise into any real-world interpretation of tolerability data and underscore why sourcing integrity matters for laboratory use. Researchers seeking verified material should consult resources on where to buy Reta from tested, documented suppliers.
Regulatory implications. The FDA and other agencies evaluating retatrutide's approval pathway in 2026 have emphasized that labeling will reflect the full randomized population's outcomes, not completer subgroups. This distinction will directly affect how prescribing information frames expected weight loss and glycemic benefit in clinical practice.
Conclusion
Interpreting retatrutide research accurately requires more than reading the abstract. Researchers should apply a six-point checklist, baseline adjustment, exposure duration, dose escalation, missing-data method, responder rates, and discontinuation analysis, to every efficacy claim before drawing comparisons or designing follow-on studies.
Actionable next steps for researchers in 2026:
- Obtain the full statistical analysis plan for any trial before interpreting its primary endpoint.
- Cross-reference weight-loss figures against the specific week, dose level, and analysis population reported.
- Treat completer-only A1C data as hypothesis-generating rather than confirmatory.
- Verify that any retatrutide compound used in laboratory settings comes from a documented, purity-tested source to prevent contaminated data.
- Review long-term extension data alongside short-term phase-2 benchmarks to contextualize trajectory, not just magnitude.
The science behind this triple-receptor agonist is advancing rapidly. Applying rigorous interpretive standards now ensures that research contributions to this field remain credible and reproducible.