

Why Peptide Research Results Are Hard to Compare: Sequence Identity, Salt Form, Purity, Vehicle, and Assay Context
Two research teams test what appears to be the same peptide. One reports robust receptor activation at 100 nM. The other sees no significant effect below 1 µM. Neither team made an error. The divergence comes from variables that never appear in the abstract, and understanding those variables is exactly why peptide research results are hard to compare across studies, suppliers, and model systems.
Key Takeaways
- A peptide sequence name does not fully identify a compound; stereochemistry, terminus modifications, and counterions all alter biological behavior
- Salt form and residual counterions such as trifluoroacetate (TFA) can introduce cytotoxic artifacts that distort assay results
- Purity figures are only meaningful when the analytical method, instrument platform, and impurity profile are disclosed
- Vehicle, buffer pH, reconstitution solvent, and handling temperature each shift effective peptide concentration and aggregation state
- Assay context, species, receptor density, dose normalization basis, and readout method, determines whether two studies are genuinely comparable
Sequence Identity Is Not as Simple as It Looks
When researchers cite a peptide by its one-letter amino acid string, they are describing connectivity only. That string says nothing about stereochemistry, terminus status, backbone modifications, or cyclic constraints. A peptide containing even one D-amino acid substitution can show dramatically different protease resistance and receptor binding compared to its all-L counterpart, yet both compounds may carry the same sequence notation in a publication.
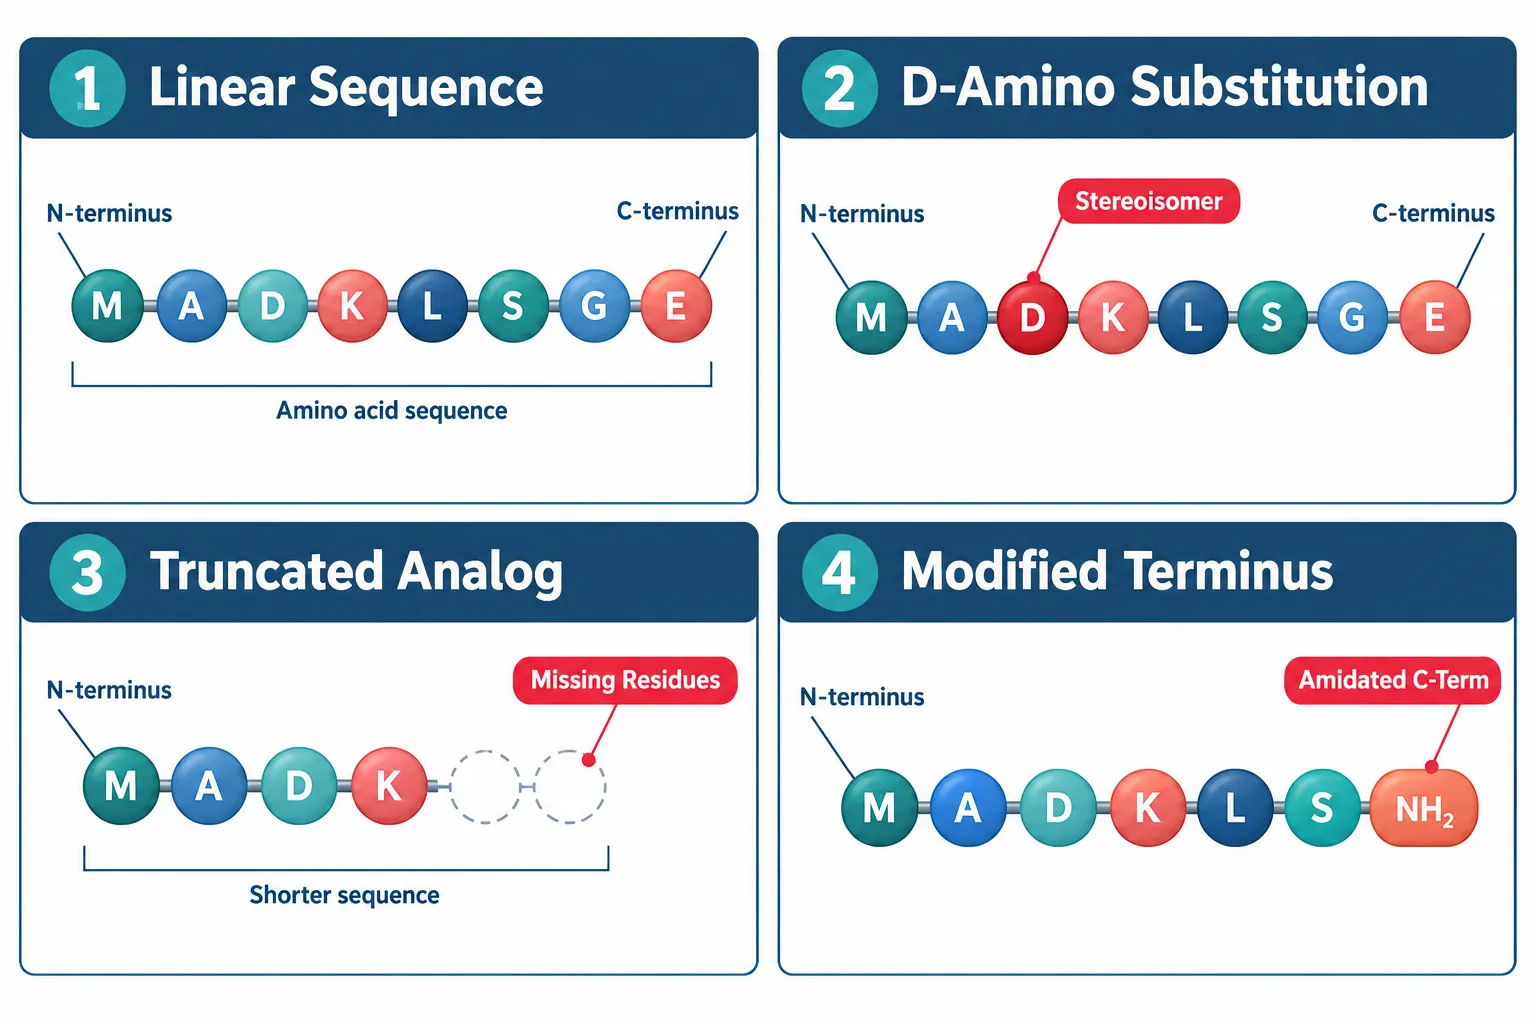
Terminus modifications compound this problem further. An amidated C-terminus changes the charge distribution across the molecule. An acetylated N-terminus alters hydrogen-bonding capacity. Regulatory guidance effective in 2026 explicitly states that sequence identity alone is insufficient for comparability assessments and requires orthogonal analytical methods to confirm structural equivalence. A 2026 reproducibility framework formalizes this by introducing a six-field specification, sequence, stereochemistry, terminus status, modification type, supplier lot, and certificate data, arguing that a sequence string "defines connectivity only."
Researchers sourcing compounds such as Ipamorelin peptide for sale or GHK-Cu peptide for sale should request full structural confirmation, not just a sequence match, before drawing cross-study comparisons.
Salt Form, Purity, and Why the Numbers Mislead
The Counterion Problem
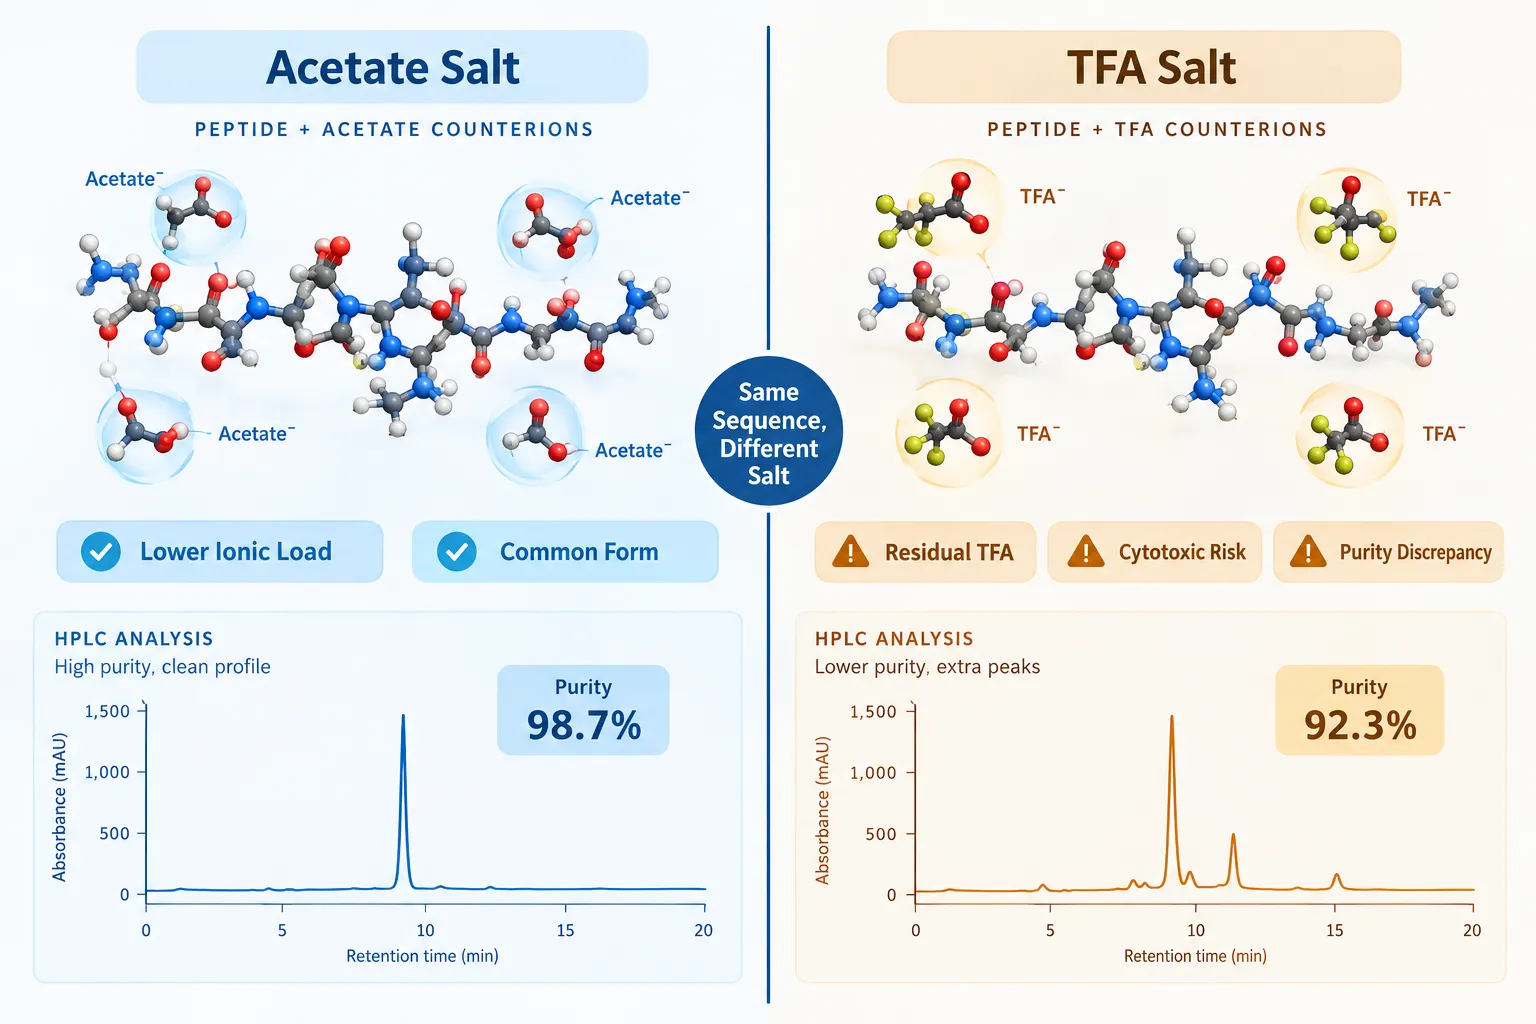
Most synthetic peptides are supplied as salts. The two most common counterions are acetate and trifluoroacetate (TFA). TFA is a byproduct of standard Fmoc solid-phase synthesis and is not always removed during purification. Residual TFA has documented cytotoxic effects in cell-based assays. A compound reported at 95% purity as a TFA salt and the same compound at 95% purity as an acetate salt are not functionally equivalent, even though the purity figures look identical on paper.
Purity Figures Without Context Are Incomplete
Purity is reported as a percentage, but that number depends entirely on the analytical method used to generate it. Reversed-phase HPLC at 214 nm is the most common approach, but it weights peptide bonds rather than mass. A 2026 researcher's guide positions HPLC combined with mass spectrometry (MS) as the gold standard, noting that purity definitions and vehicle choices are among the leading drivers of inter-study divergence. Without knowing the detection wavelength, column chemistry, gradient conditions, and whether MS confirmation was performed, a purity certificate is difficult to interpret.
This matters especially for structurally complex or modified peptides. Research into compounds like SS-31 peptide or cagrilintide peptide, both of which carry specific structural features, requires purity data tied to orthogonal methods, not a single HPLC trace.
Vehicle, Assay Context, and Dose Normalization
How Vehicle and Handling Shift Results
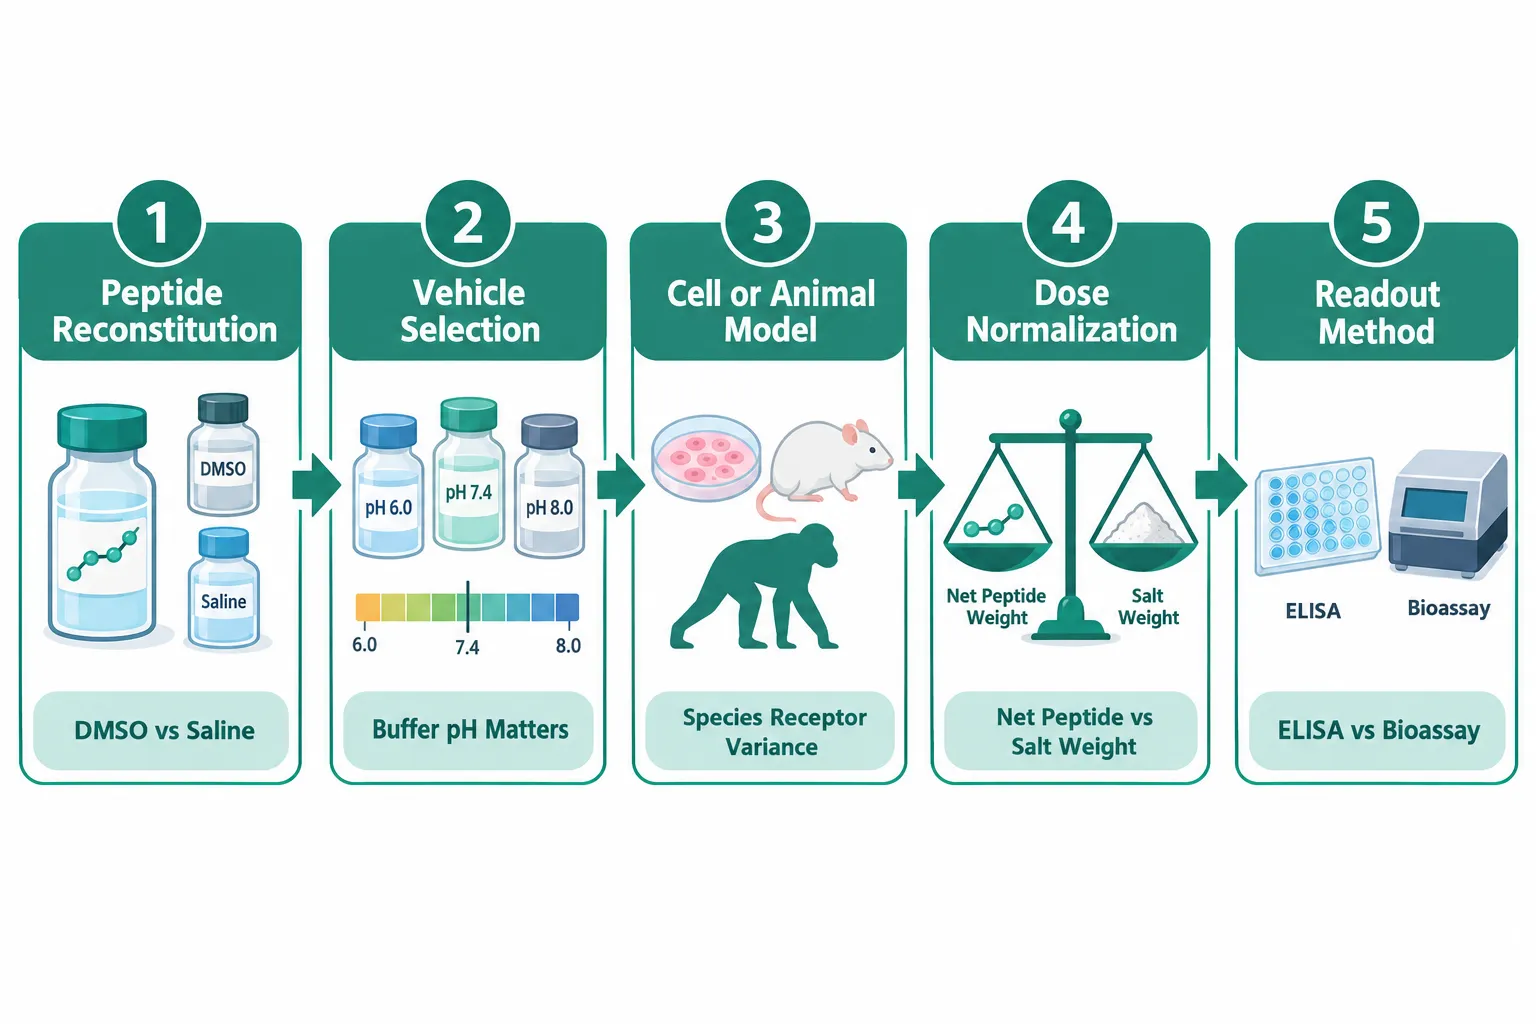
Even a perfectly characterized peptide can behave differently depending on how it is reconstituted and delivered. DMSO, aqueous buffers, saline, and serum-containing media each interact with peptide secondary structure in distinct ways. Some peptides aggregate readily in aqueous solution; others require a co-solvent to achieve true monomeric dispersion. Temperature during reconstitution, freeze-thaw cycles, and storage duration all affect aggregation state and therefore effective concentration at the receptor.
Buffer pH is equally critical. A peptide with multiple ionizable residues will carry a different net charge at pH 7.0 versus pH 7.4. That charge difference alters membrane interaction, receptor docking, and even metabolic stability in cell culture media.
Dose Normalization: Net Peptide vs. Salt Weight
One of the most overlooked sources of non-comparability is how dose is expressed. When a peptide is supplied as a TFA or acetate salt, the counterion contributes to the total mass. A 1 mg vial of a peptide TFA salt may contain only 0.80-0.88 mg of actual peptide, depending on the molecular weight ratio. If one study doses by salt weight and another by net peptide content, the effective molar doses differ, sometimes by 15-20%, without any note in the methods section.
Researchers working with GLP-3 peptide analogs or visceral fat research models should confirm whether reported doses reflect salt weight or net peptide content before comparing results across publications.
Model System and Readout Method
Species differences in receptor expression, receptor density, and downstream signaling cascades mean that results from a rodent model do not translate directly to human cell lines, and vice versa. An immunogenicity review from mid-2025 highlighted ongoing regulatory uncertainty about "how different is too different" when quality attributes vary across batches or suppliers.
Readout method adds another layer. An ELISA measuring a downstream marker, a radioligand binding assay measuring receptor occupancy, and a functional bioassay measuring cellular response can each produce different apparent potency rankings for the same set of compounds. None of these methods is wrong; they simply measure different things.
Practical Steps for Improving Comparability
Researchers can reduce non-comparability by adopting a structured documentation approach before and after any experiment:
| Variable | Minimum Disclosure |
|---|---|
| Sequence | Full sequence with stereochemistry and terminus status |
| Salt form | Counterion identity and conversion factor used |
| Purity | Method, instrument, wavelength, and lot number |
| Vehicle | Reconstitution solvent, buffer, pH, and storage conditions |
| Dose | Net peptide content, not salt weight |
| Assay | Species, cell line, receptor density, and readout method |
Sourcing from suppliers who provide full analytical packages, including HPLC traces, MS confirmation, and counterion disclosure, is the single most effective way to reduce pre-experimental uncertainty. Platforms that offer wholesale peptides for sale with batch-specific certificates of analysis make this documentation easier to obtain and archive.
For AI-designed or novel peptides entering research pipelines, a July 2026 analysis of computational peptide design identifies physical validation and full contextual reporting as the primary bottleneck to reproducibility, reinforcing that the problem is not unique to commercially sourced compounds.
Conclusion
Why peptide research results are hard to compare comes down to a chain of underreported variables: sequence notation that omits stereochemistry and modifications, counterion identity that affects both mass calculation and cell viability, purity figures that depend on undisclosed analytical conditions, vehicles that alter aggregation and effective concentration, and assay contexts that measure fundamentally different biological endpoints.
Actionable next steps for researchers:
- Request and archive full structural specifications, not just sequence strings, for every compound used
- Confirm counterion identity and apply the appropriate mass correction factor before calculating molar doses
- Report purity with method details, including instrument, column, wavelength, and gradient
- Document reconstitution solvent, buffer pH, storage temperature, and freeze-thaw history in the methods section
- When comparing across studies, map each variable in the table above before drawing mechanistic conclusions
Adopting these practices does not eliminate all sources of divergence, but it transforms vague disagreements between studies into tractable, resolvable differences, which is the foundation of reproducible science.


Leave a Reply
Want to join the discussion?Feel free to contribute!