

LDL Cholesterol and Peptide Research: How to Interpret Lipid Changes When Weight Loss and Food Intake Also Shift
Across tirzepatide trials, LDL cholesterol falls by roughly 10 to 20 percent at therapeutic doses, yet in at least one large obesity trial, LDL-C actually rose slightly while every other atherogenic marker improved. That apparent contradiction is not a flaw in the data. It is a signal that standard LDL-C readings during active weight loss and dietary change are notoriously difficult to interpret without a causal framework. For anyone working in LDL cholesterol and peptide research, understanding how to interpret lipid changes when weight loss and food intake also shift is the difference between drawing the right conclusion and acting on noise.
Key Takeaways
- LDL-C alone is an unreliable endpoint during active weight loss; ApoB and non-HDL cholesterol are more informative markers of atherogenic risk.
- Peptide-driven lipid improvements are mediated partly by direct receptor signaling and partly by caloric restriction and body-fat reduction, separating these effects requires baseline stratification.
- Triglycerides and HDL-C tend to respond most strongly to weight loss, while LDL-C changes are smaller and more variable.
- Diet quality independently shapes the lipid response to peptides; Mediterranean-style eating amplifies favorable shifts.
- Re-evaluating statin intensity after weight stabilizes, not during active loss, produces more accurate clinical decisions.
Why LDL-C Behaves Differently During Peptide-Driven Weight Loss
When a research subject or patient loses significant body weight through a peptide protocol, several metabolic processes change at once. Hepatic VLDL secretion decreases as visceral fat mass shrinks. Postprandial triglyceride clearance improves. Insulin sensitivity rises, reducing the liver's drive to overproduce atherogenic lipoproteins. All of these shifts affect the lipoprotein pool in ways that do not always move LDL-C in a straight line.
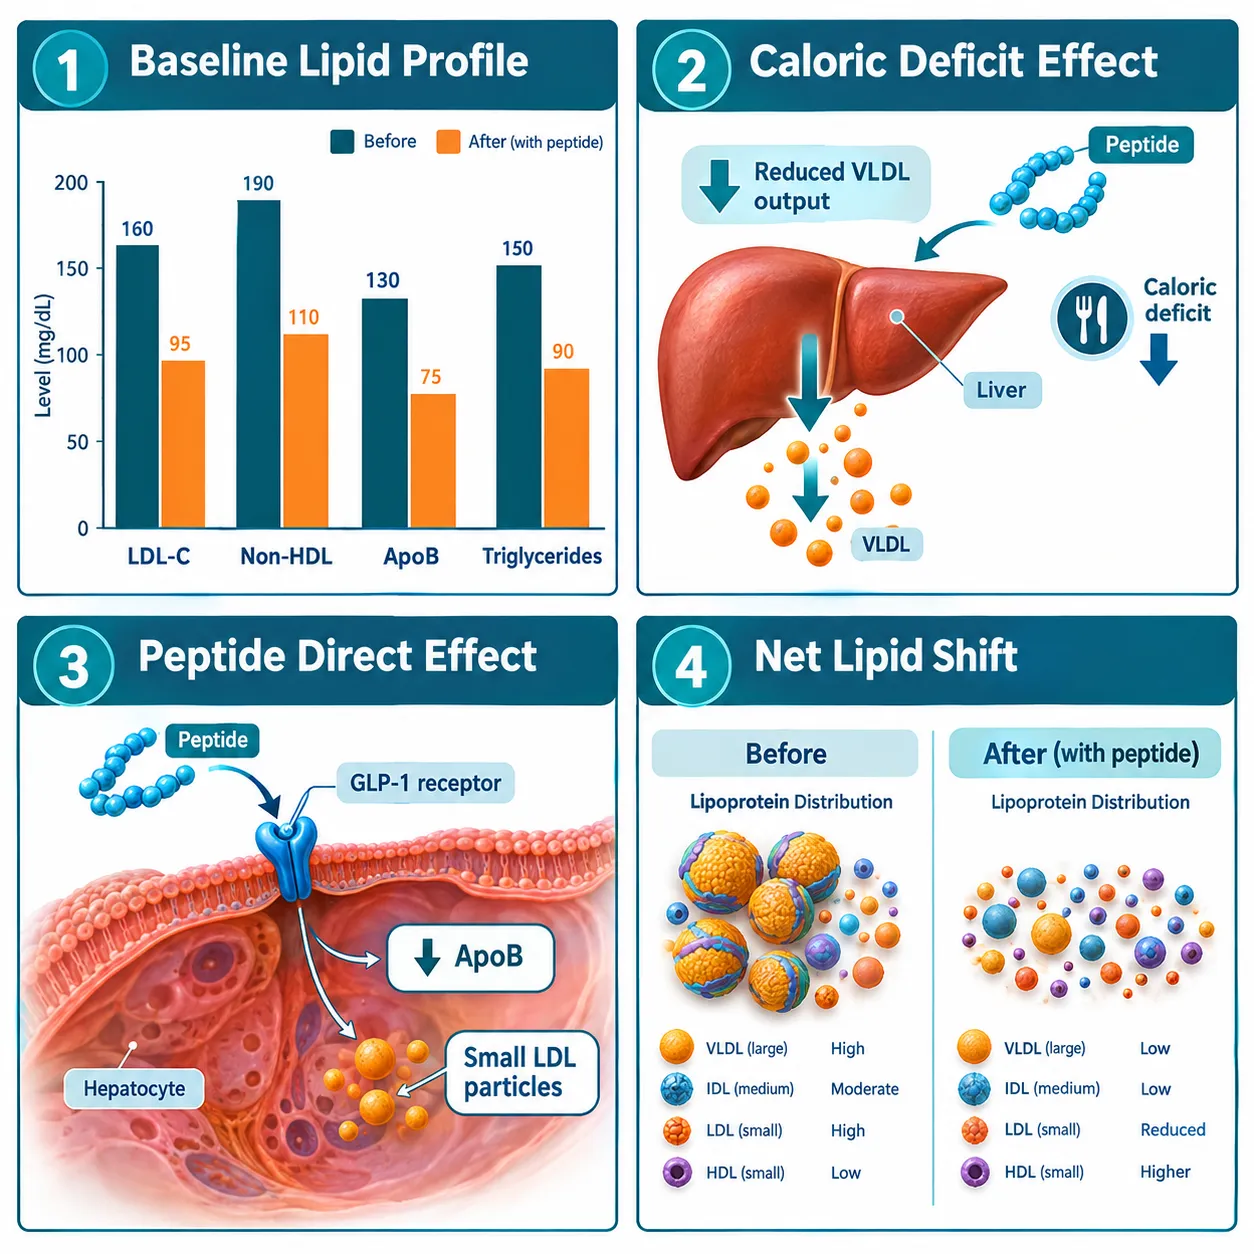
The cholesterol-ester transfer protein (CETP) pathway partly explains the paradox. As triglycerides fall sharply, a consistent finding across GLP-1 and dual GIP/GLP-1 agonist studies, CETP-mediated exchange between VLDL and LDL particles slows. This can temporarily raise LDL-C on a standard panel even as the actual number of atherogenic particles, measured by ApoB, falls. The SURMOUNT-2 obesity trial observed a small LDL-C increase of roughly 2 to 3 percent at certain doses, yet post-hoc particle analysis showed reduced ApoB, fewer small dense LDL particles, and lower remnant cholesterol, a genuinely less atherogenic profile hidden behind a misleading headline number.
This is why researchers exploring what is the strongest peptide for weight loss must pair efficacy data with a full lipoprotein panel rather than relying on LDL-C alone.
Key principle: A rising LDL-C during rapid weight loss does not automatically indicate increased cardiovascular risk. Context is everything.
A Causal-Analysis Framework for LDL Cholesterol and Peptide Research
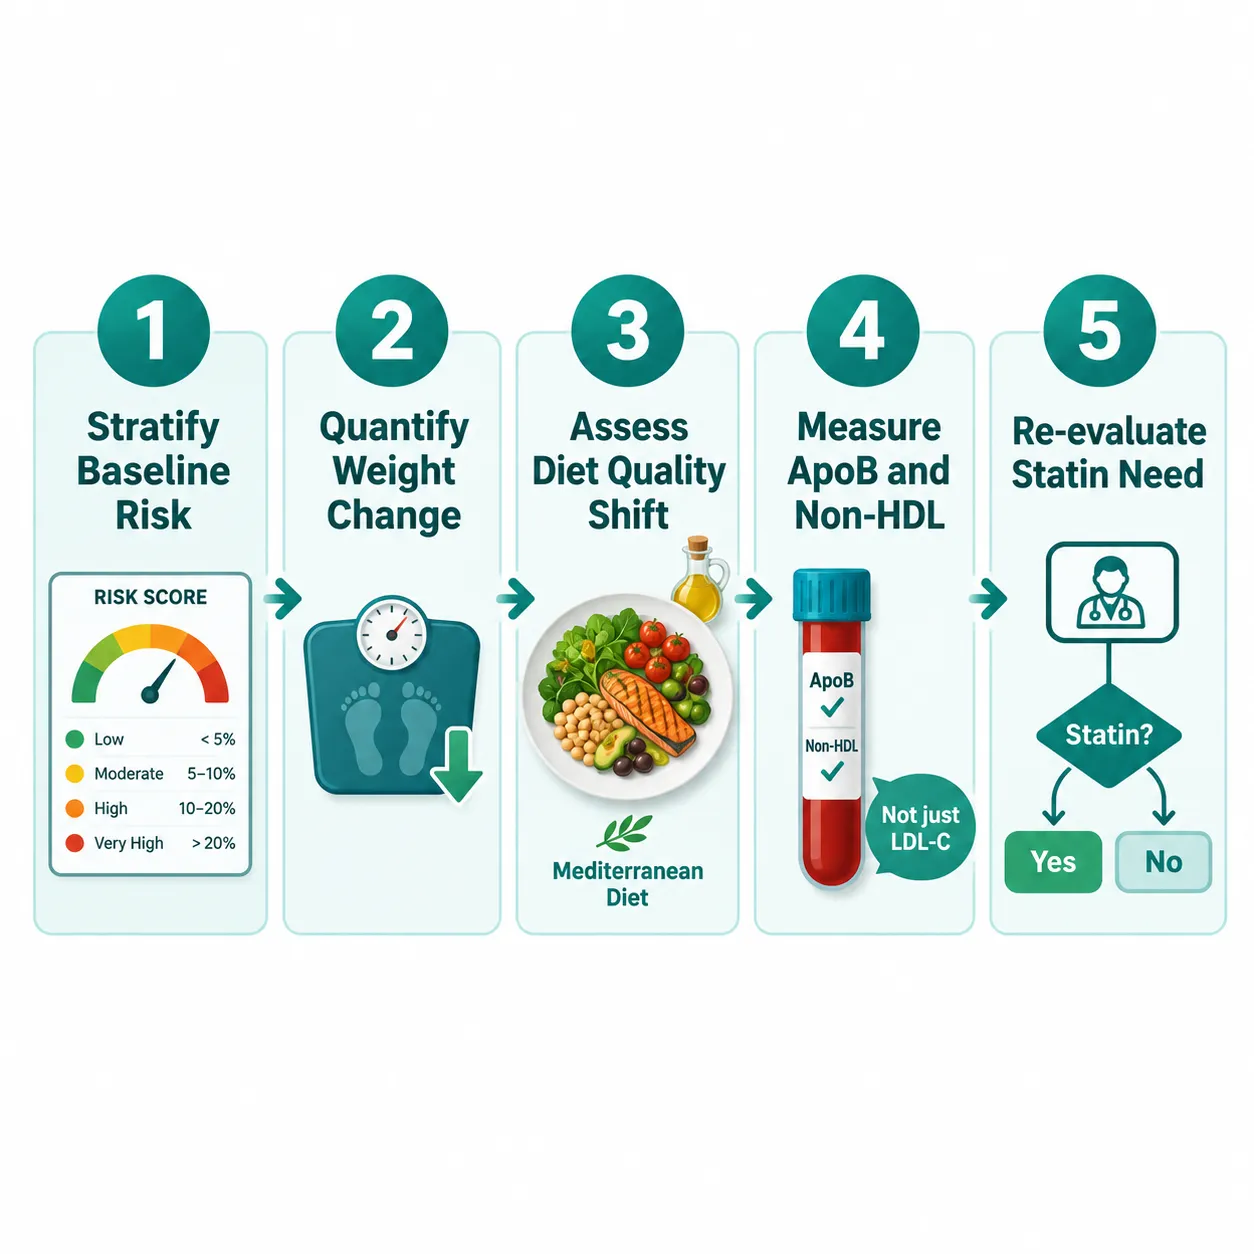
Interpreting lipid changes when weight loss and food intake also shift requires treating the lipid panel as an outcome with multiple upstream causes, not a single drug effect. The following framework applies mediation-analysis thinking to practical research settings.
Step 1: Stratify Baseline Risk Before Intervention
Lipid responses to peptides are not uniform. Participants with elevated baseline triglycerides (above 150 mg/dL) and low HDL-C show the largest improvements, while those with near-normal baseline values show modest or negligible shifts. This is consistent with regression to the mean, but it also reflects the metabolic phenotype driving the abnormality in the first place.
Baseline stratification categories:
| Baseline Profile | Expected LDL-C Response | Priority Marker |
|---|---|---|
| High TG, low HDL-C | Moderate LDL-C fall | TG and ApoB |
| Isolated high LDL-C | Small or variable change | ApoB and non-HDL |
| Mixed dyslipidemia | Broad improvement | Non-HDL cholesterol |
| Near-normal lipids | Minimal change | Particle size |
Step 2: Separate Weight-Loss Mediation from Direct Peptide Effects
Real-world data show that combining Mediterranean diet adherence with a GLP-1/GIP agonist produces total cholesterol reductions from roughly 194 to 184 mg/dL and LDL-C drops from about 116 to 109 mg/dL, modest numbers that reflect the additive contribution of diet quality. Without controlling for dietary change, attributing the entire LDL shift to the peptide overstates the pharmacological effect.
Researchers using compounds such as GLP-3R peptide formulations or studying GLP-3 peptide signaling pathways should record dietary intake changes alongside lipid panels to allow proper mediation analysis.
Step 3: Prioritize ApoB and Non-HDL Cholesterol Over LDL-C
"Non-HDL cholesterol functions as a practical integrator of all atherogenic lipoprotein fractions, it captures remnant particles that LDL-C misses entirely."
Post-hoc analysis of the three-year SURMOUNT-1 trial found that tirzepatide significantly increased the proportion of participants achieving more than 10 percent non-HDL cholesterol reduction alongside meaningful weight loss and blood pressure improvements. Non-HDL cholesterol captures VLDL remnants, IDL, and Lp(a) contributions that a standard LDL-C calculation ignores, making it far more reliable when the lipoprotein pool is actively reshaping during weight loss.
ApoB is even more precise. A dose-dependent reduction in ApoB, large triglyceride-rich lipoproteins, and small LDL particles has been documented across tirzepatide dose ranges from 5 to 15 mg, confirming a genuinely less atherogenic profile even when LDL-C moves inconsistently.
For foundational context on how peptide classes interact with metabolic pathways, see Peptides 101 for research-use-only buyers.
Applying the Framework: Practical Interpretation of Lipid Panels
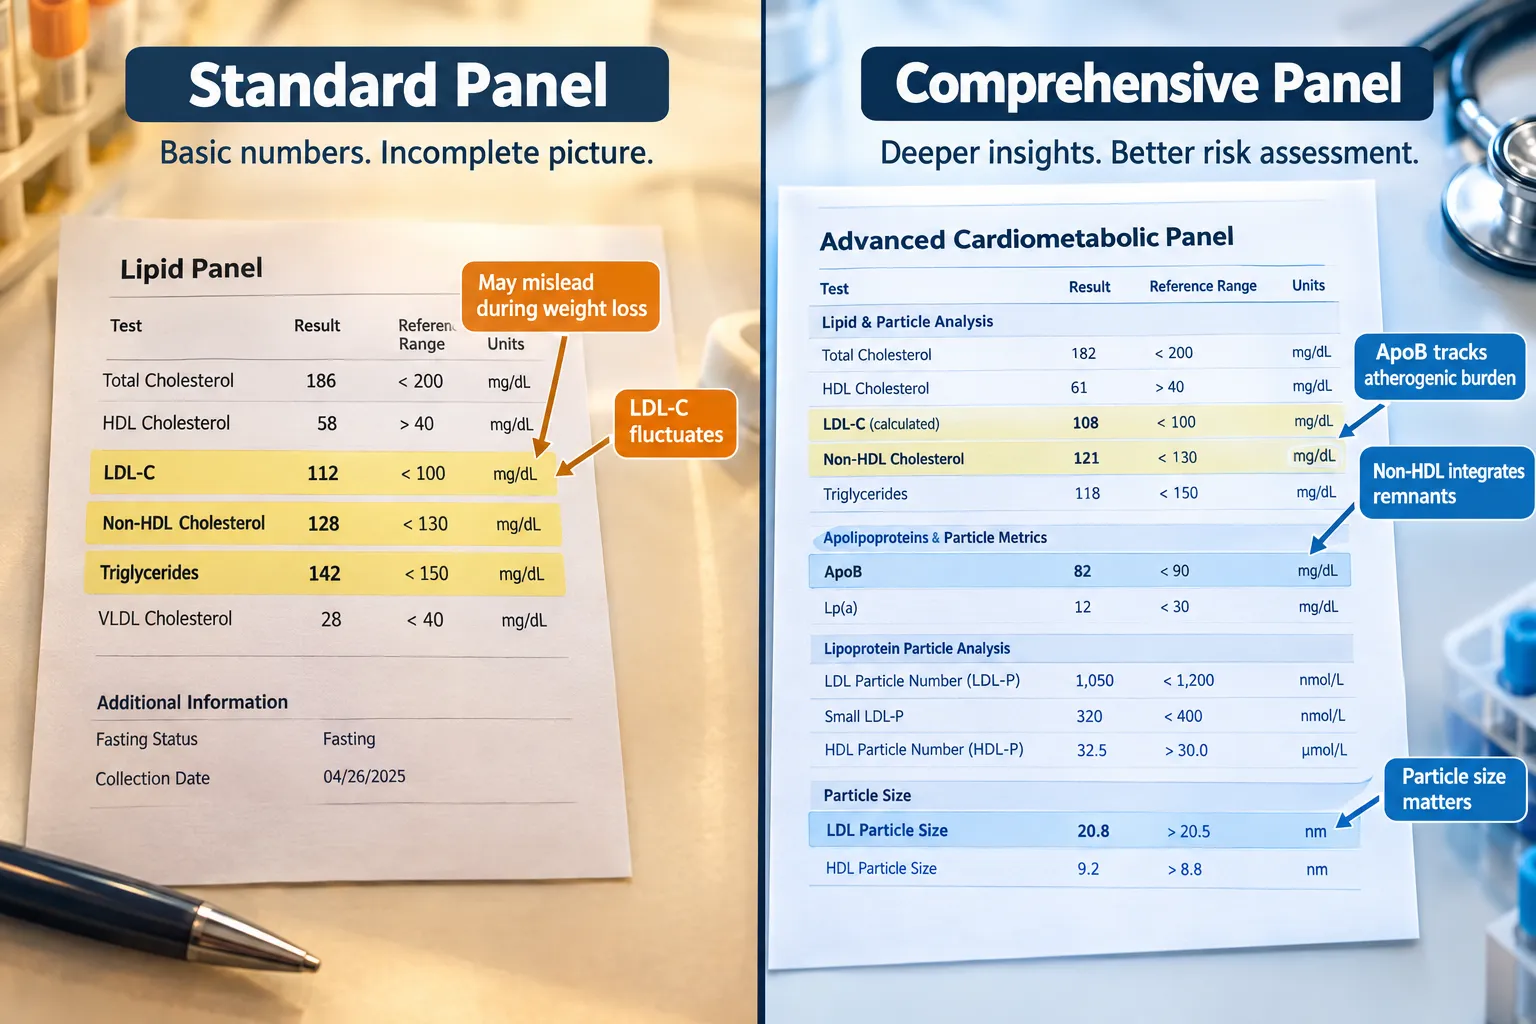
When LDL-C and peptide research intersect with active weight loss, a structured interpretation protocol prevents misclassification of results.
Interpreting common scenarios:
- LDL-C falls, ApoB falls: Genuine atherogenic improvement. Weight loss and peptide effects are aligned.
- LDL-C rises slightly, ApoB falls: Likely CETP-mediated redistribution. Risk has not increased; do not escalate lipid therapy.
- LDL-C unchanged, TG falls sharply: Weight-loss-driven improvement dominant. Recheck after weight stabilizes.
- LDL-C unchanged, ApoB unchanged: Consider underlying familial hypercholesterolemia or poor dietary adherence. Peptide effect on LDL is modest by design.
Oral peptide formulations such as orforglipron at higher doses produce cardiometabolic improvements on composite indices including LDL-C, HDL-C, and triglycerides that are comparable to injectable semaglutide, but these improvements are driven predominantly by changes in energy intake and body weight rather than direct potent LDL-lowering. This distinction matters for setting realistic expectations in research protocols.
For researchers studying metabolic peptides with overlapping mechanisms, MOTS-C peptide and 5-amino-1MQ combinations offer additional context on energy metabolism pathways that intersect with lipid regulation.
Triple agonists such as retatrutide, which targets GIP, GLP-1, and glucagon receptors simultaneously, have produced mean weight losses exceeding 25 percent in recent trials. At that magnitude of fat loss, LDL-C, triglycerides, and blood pressure all improve, but re-evaluating statin intensity should wait until weight stabilizes, since ongoing lipoprotein remodeling during active loss creates a moving target.
Important note on statin therapy: French consensus guidance and NIH-linked reviews both emphasize that statins remain first-line therapy for LDL-C and ApoB targets. Peptide-induced lipid improvements complement statin therapy; they do not replace it for high-risk individuals.
Timing, Dosing, and Re-Evaluation Checkpoints
The timing of lipid measurements relative to weight-loss trajectory matters considerably. Early measurements at 12 weeks reflect initial metabolic disruption and may not represent steady-state lipoprotein levels. A 2026 real-world study found that lipid improvements at low doses of 2.5 to 5 mg weekly tracked closely with the rate of weight change rather than cumulative weight lost, meaning that a plateau in lipid improvement does not indicate loss of drug effect, but rather stabilization of the weight-loss-mediated pathway.
Recommended measurement checkpoints:
- Baseline (fasting, before peptide initiation)
- 12 weeks (early metabolic response, note active weight-loss phase)
- 6 months (partial weight stabilization)
- 12 months (near steady-state for most protocols)
- Post-stabilization (definitive lipid re-evaluation for statin decisions)
For researchers interested in peptide dosing protocols and their relationship to metabolic outcomes, aligning lipid measurement timing with dosing escalation schedules improves interpretive accuracy.
A meta-analysis pooling six randomized controlled trials of tirzepatide in type 2 diabetes confirmed consistent reductions in total cholesterol, triglycerides, LDL-C, and VLDL-C versus baseline or comparators, confirming that observed LDL changes reflect a real class effect rather than measurement noise, provided the analysis accounts for concurrent weight and dietary shifts.
Conclusion
LDL cholesterol and peptide research presents a genuine interpretive challenge when weight loss and food intake are simultaneously changing. The core takeaway for 2026 research practice is straightforward: treat LDL-C as one data point in a broader causal picture, not the primary endpoint. Prioritize ApoB and non-HDL cholesterol as the anchoring markers of atherogenic burden. Stratify participants by baseline lipid phenotype before drawing conclusions about drug effect size. Account for dietary quality as an independent variable. And time definitive lipid re-evaluations to coincide with weight stabilization, not active loss.
Actionable next steps for researchers and clinicians:
- Add ApoB and non-HDL cholesterol to every lipid panel in peptide weight-loss protocols.
- Document dietary pattern changes alongside pharmacological interventions.
- Apply baseline stratification to set realistic expectations for LDL-C response magnitude.
- Defer statin intensity adjustments until body weight has plateaued for at least 8 to 12 weeks.
- Use non-HDL cholesterol reduction of more than 10 percent as a composite success marker rather than LDL-C alone.


Leave a Reply
Want to join the discussion?Feel free to contribute!